Zip Codes with the Highest Percentage of Population Employed in Legal Services & Support in Las Vegas, NV

RELATED REPORTS & OPTIONS

Legal Services & Support
Population
Families and Households
Female Fertility
Female Fertility (Unmarried)
Race (Community Size)
Race (Percentage)
Ancestry (Community Size)
AfghanAfricanAlaska NativeAlbanianAleutAmericanApacheArabArapahoArgentineanArmenianAssyrian / Chaldean / SyriacAustralianAustrianBangladeshiBarbadianBasqueBelgianBelizeanBhutaneseBlackfeetBolivianBrazilianBritishBritish West IndianBulgarianBurmeseCajunCambodianCanadianCape VerdeanCelticCentral AmericanCentral American IndianCherokeeCheyenneChickasawChileanChineseChippewaChoctawColombianComancheCosta RicanCreeCreekCroatianCubanCzechCzechoslovakianDanishDelawareDominicanDutchDutch West IndianEastern EuropeanEcuadorianEgyptianEnglishEstonianEthiopianEuropeanFijianFilipinoFinnishFrenchFrench American IndianFrench CanadianGermanGerman RussianGhanaianGreekGuamanian / ChamorroGuatemalanGuyaneseHaitianHonduranHopiHungarianIcelanderIndian (Asian)IndonesianInupiatIranianIraqiIrishIroquoisIsraeliItalianJamaicanJapaneseJordanianKenyanKoreanLaotianLatvianLebaneseLiberianLithuanianLuxembourgerMacedonianMalaysianMalteseMenomineeMexicanMexican American IndianMongolianMoroccanNative HawaiianNavajoNew ZealanderNicaraguanNigerianNorthern EuropeanNorwegianOkinawanOsagePaiutePakistaniPalestinianPanamanianParaguayanPennsylvania GermanPeruvianPimaPolishPortuguesePotawatomiPuebloPuerto RicanPuget Sound SalishRomanianRussianSalvadoranSamoanScandinavianScotch-IrishScottishSeminoleSenegaleseSerbianShoshoneSierra LeoneanSiouxSlavicSlovakSloveneSomaliSouth AfricanSouth AmericanSouth American IndianSoviet UnionSpaniardSpanishSpanish AmericanSpanish American IndianSri LankanSubsaharan AfricanSudaneseSwedishSwissSyrianThaiTlingit-HaidaTohono O'OdhamTonganTrinidadian and TobagonianTurkishU.S. Virgin IslanderUgandanUkrainianUruguayanUteVenezuelanVietnameseWelshWest IndianYaquiYugoslavianYumanYup'ikZimbabwean
Ancestry (Percentage)
AfghanAfricanAlaska NativeAlbanianAleutAmericanApacheArabArapahoArgentineanArmenianAssyrian / Chaldean / SyriacAustralianAustrianBangladeshiBarbadianBasqueBelgianBelizeanBhutaneseBlackfeetBolivianBrazilianBritishBritish West IndianBulgarianBurmeseCajunCambodianCanadianCape VerdeanCelticCentral AmericanCentral American IndianCherokeeCheyenneChickasawChileanChineseChippewaChoctawColombianComancheCosta RicanCreeCreekCroatianCubanCzechCzechoslovakianDanishDelawareDominicanDutchDutch West IndianEastern EuropeanEcuadorianEgyptianEnglishEstonianEthiopianEuropeanFijianFilipinoFinnishFrenchFrench American IndianFrench CanadianGermanGerman RussianGhanaianGreekGuamanian / ChamorroGuatemalanGuyaneseHaitianHonduranHopiHungarianIcelanderIndian (Asian)IndonesianInupiatIranianIraqiIrishIroquoisIsraeliItalianJamaicanJapaneseJordanianKenyanKoreanLaotianLatvianLebaneseLiberianLithuanianLuxembourgerMacedonianMalaysianMalteseMenomineeMexicanMexican American IndianMongolianMoroccanNative HawaiianNavajoNew ZealanderNicaraguanNigerianNorthern EuropeanNorwegianOkinawanOsagePaiutePakistaniPalestinianPanamanianParaguayanPennsylvania GermanPeruvianPimaPolishPortuguesePotawatomiPuebloPuerto RicanPuget Sound SalishRomanianRussianSalvadoranSamoanScandinavianScotch-IrishScottishSeminoleSenegaleseSerbianShoshoneSierra LeoneanSiouxSlavicSlovakSloveneSomaliSouth AfricanSouth AmericanSouth American IndianSoviet UnionSpaniardSpanishSpanish AmericanSpanish American IndianSri LankanSubsaharan AfricanSudaneseSwedishSwissSyrianThaiTlingit-HaidaTohono O'OdhamTonganTrinidadian and TobagonianTurkishU.S. Virgin IslanderUgandanUkrainianUruguayanUteVenezuelanVietnameseWelshWest IndianYaquiYugoslavianYumanYup'ikZimbabwean
Immigrant Origin (Total)
AfghanistanAfricaAlbaniaArgentinaArmeniaAsiaAustraliaAustriaBahamasBangladeshBarbadosBelarusBelgiumBelizeBoliviaBosnia and HerzegovinaBrazilBulgariaBurma / MyanmarCambodiaCameroonCanadaCaribbeanCentral AmericaChileChinaColombiaCosta RicaCroatiaCubaCzechoslovakiaDenmarkDominican RepublicEastern AfricaEastern AsiaEastern EuropeEcuadorEgyptEl SalvadorEnglandEritreaEthiopiaEuropeFijiFranceGermanyGhanaGreeceGuatemalaGuyanaHaitiHondurasHong KongHungaryIndiaIndonesiaIranIraqIrelandIsraelItalyJamaicaJapanJordanKazakhstanKenyaKoreaLaosLatin AmericaLatviaLebanonLiberiaLithuaniaMalaysiaMexicoMicronesiaMiddle AfricaMoldovaMoroccoNepalNetherlandsNicaraguaNigeriaNorth MacedoniaNorthern AfricaNorthern EuropeNorwayOceaniaPakistanPanamaPeruPhilippinesPolandPortugalRomaniaRussiaSaudi ArabiaScotlandSenegalSerbiaSierra LeoneSingaporeSomaliaSouth AfricaSouth AmericaSouth Central AsiaSouth Eastern AsiaSouthern EuropeSpainSri LankaSudanSwedenSwitzerlandSyriaTaiwanThailandTrinidad and TobagoTurkeyUgandaUkraineUruguayUzbekistanVenezuelaVietnamWest IndiesWestern AfricaWestern AsiaWestern EuropeYemenZaireZimbabwe
Immigrant Origin (Percentage)
AfghanistanAfricaAlbaniaArgentinaArmeniaAsiaAustraliaAustriaBahamasBangladeshBarbadosBelarusBelgiumBelizeBoliviaBosnia and HerzegovinaBrazilBulgariaBurma / MyanmarCambodiaCameroonCanadaCaribbeanCentral AmericaChileChinaColombiaCosta RicaCroatiaCubaCzechoslovakiaDenmarkDominican RepublicEastern AfricaEastern AsiaEastern EuropeEcuadorEgyptEl SalvadorEnglandEritreaEthiopiaEuropeFijiFranceGermanyGhanaGreeceGuatemalaGuyanaHaitiHondurasHong KongHungaryIndiaIndonesiaIranIraqIrelandIsraelItalyJamaicaJapanJordanKazakhstanKenyaKoreaLaosLatin AmericaLatviaLebanonLiberiaLithuaniaMalaysiaMexicoMicronesiaMiddle AfricaMoldovaMoroccoNepalNetherlandsNicaraguaNigeriaNorth MacedoniaNorthern AfricaNorthern EuropeNorwayOceaniaPakistanPanamaPeruPhilippinesPolandPortugalRomaniaRussiaSaudi ArabiaScotlandSenegalSerbiaSierra LeoneSingaporeSomaliaSouth AfricaSouth AmericaSouth Central AsiaSouth Eastern AsiaSouthern EuropeSpainSri LankaSudanSwedenSwitzerlandSyriaTaiwanThailandTrinidad and TobagoTurkeyUgandaUkraineUruguayUzbekistanVenezuelaVietnamWest IndiesWestern AfricaWestern AsiaWestern EuropeYemenZaireZimbabwe
Income
Income (Families)
Income (Households)
Poverty
Poverty (Families)
Unemployment
Employment Occupations
Employment Industries
Employer Class
Commute Time
Commute Means
School Enrollment
Education by Degree Field
Occupancy
Finances
Physical Characteristics
Las Vegas
Compare Zip Codes
Comparison Subject

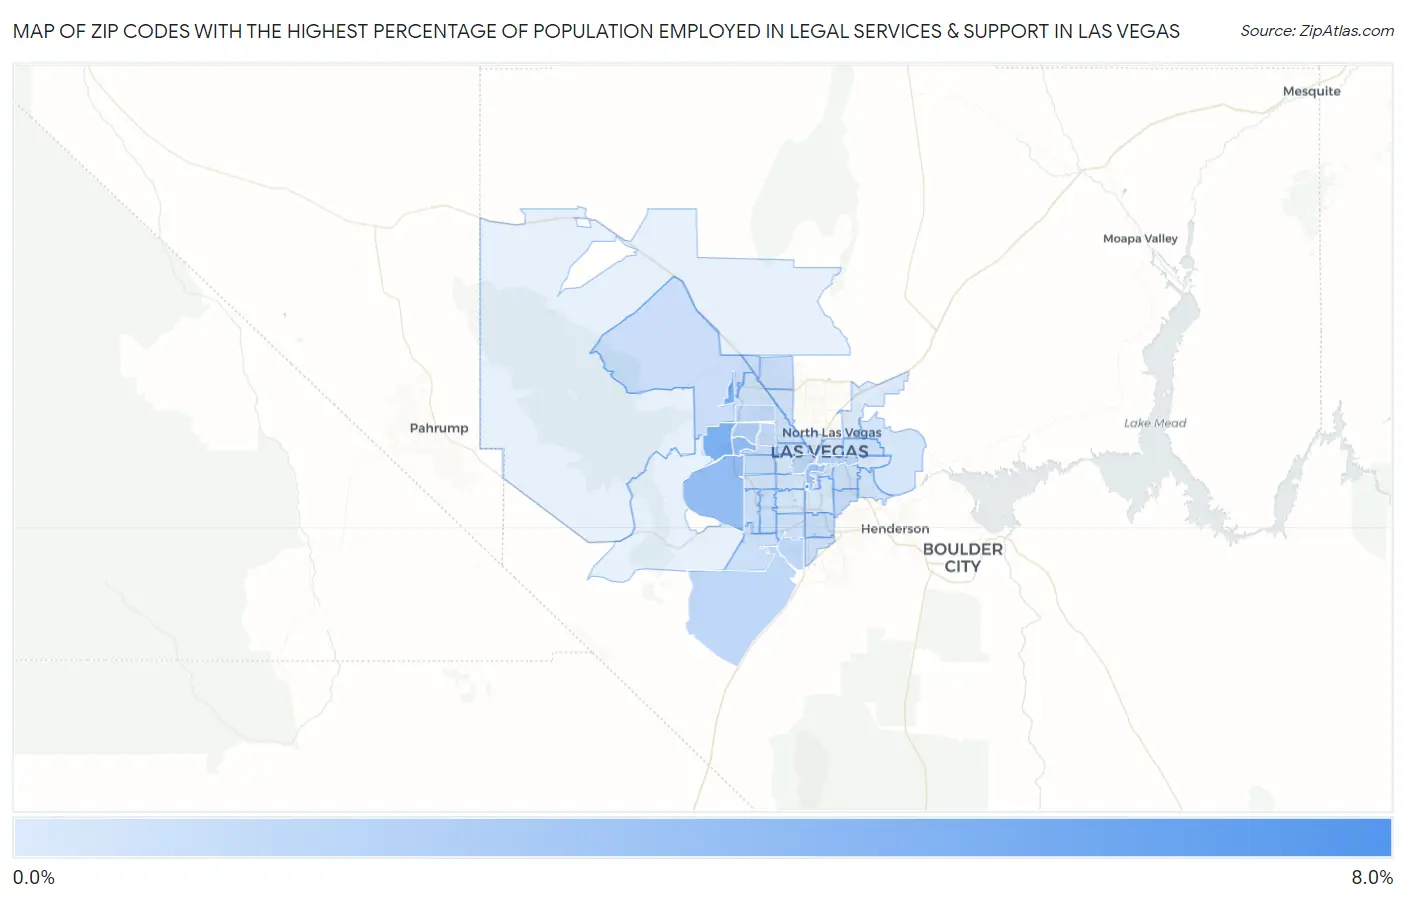
Map of Zip Codes with the Highest Percentage of Population Employed in Legal Services & Support in Las Vegas

0.0%
8.0%
Zip Codes with the Highest Percentage of Population Employed in Legal Services & Support in Las Vegas Map

Zip Codes with the Highest Percentage of Population Employed in Legal Services & Support in Las Vegas, NV

Zip Code % Employed vs State vs National
1.891587.2%0.99%(+6.18)#31.2%(+5.98)#326
2.891384.7%0.99%(+3.67)#71.2%(+3.47)#827
3.891443.6%0.99%(+2.62)#81.2%(+2.43)#1,342
4.891353.5%0.99%(+2.53)#91.2%(+2.33)#1,421
5.891092.8%0.99%(+1.82)#101.2%(+1.63)#2,072
6.891342.2%0.99%(+1.23)#131.2%(+1.03)#3,011
7.891041.7%0.99%(+0.695)#231.2%(+0.498)#4,370
8.891021.7%0.99%(+0.686)#241.2%(+0.488)#4,414
9.891791.4%0.99%(+0.459)#291.2%(+0.261)#5,271
10.891411.4%0.99%(+0.431)#321.2%(+0.233)#5,386
11.891281.4%0.99%(+0.395)#331.2%(+0.198)#5,557
12.891291.3%0.99%(+0.332)#351.2%(+0.134)#5,840
13.891201.2%0.99%(+0.190)#391.2%(-0.007)#6,663
14.891171.1%0.99%(+0.143)#401.2%(-0.055)#6,948
15.891131.1%0.99%(+0.101)#411.2%(-0.096)#7,250
16.891231.1%0.99%(+0.092)#421.2%(-0.105)#7,311
17.891451.0%0.99%(+0.035)#481.2%(-0.162)#7,676
18.891660.96%0.99%(-0.027)#511.2%(-0.224)#8,127
19.891310.95%0.99%(-0.033)#521.2%(-0.231)#8,185
20.891210.94%0.99%(-0.045)#531.2%(-0.243)#8,266
21.891430.92%0.99%(-0.064)#541.2%(-0.261)#8,406
22.891480.87%0.99%(-0.114)#561.2%(-0.311)#8,837
23.891780.86%0.99%(-0.123)#571.2%(-0.320)#8,900
24.891690.83%0.99%(-0.154)#581.2%(-0.352)#9,175
25.891830.80%0.99%(-0.189)#591.2%(-0.386)#9,462
26.891490.76%0.99%(-0.225)#601.2%(-0.423)#9,809
27.891100.76%0.99%(-0.231)#621.2%(-0.428)#9,863
28.891390.74%0.99%(-0.248)#641.2%(-0.446)#10,025
29.891300.74%0.99%(-0.251)#651.2%(-0.448)#10,055
30.891080.71%0.99%(-0.273)#681.2%(-0.470)#10,276
31.891470.64%0.99%(-0.342)#711.2%(-0.539)#10,993
32.891070.64%0.99%(-0.350)#721.2%(-0.547)#11,059
33.891220.60%0.99%(-0.391)#741.2%(-0.588)#11,512
34.891030.48%0.99%(-0.503)#811.2%(-0.700)#12,839
35.891180.45%0.99%(-0.539)#831.2%(-0.736)#13,278
36.891190.44%0.99%(-0.544)#841.2%(-0.741)#13,336
37.891560.42%0.99%(-0.568)#871.2%(-0.765)#13,624
38.891460.38%0.99%(-0.602)#881.2%(-0.799)#14,013
39.891010.36%0.99%(-0.631)#911.2%(-0.829)#14,389
40.891060.20%0.99%(-0.783)#991.2%(-0.980)#16,148
41.891420.13%0.99%(-0.856)#1021.2%(-1.05)#16,866
42.891150.074%0.99%(-0.913)#1071.2%(-1.11)#17,309

Common Questions

What are the Top 10 Zip Codes with the Highest Percentage of Population Employed in Legal Services & Support in Las Vegas, NV?
Top 10 Zip Codes with the Highest Percentage of Population Employed in Legal Services & Support in Las Vegas, NV are:
#1
7.2%
#2
4.7%
#3
3.6%
#4
3.5%
#5
2.8%
#6
2.2%
#7
1.7%
#8
1.7%
#9
1.4%
#10
1.4%
What zip code has the Highest Percentage of Population Employed in Legal Services & Support in Las Vegas, NV?
89158 has the Highest Percentage of Population Employed in Legal Services & Support in Las Vegas, NV with 7.2%.
What is the Percentage of Population Employed in Legal Services & Support in Las Vegas, NV?
Percentage of Population Employed in Legal Services & Support in Las Vegas is 1.2%.
What is the Percentage of Population Employed in Legal Services & Support in Nevada?
Percentage of Population Employed in Legal Services & Support in Nevada is 0.99%.
What is the Percentage of Population Employed in Legal Services & Support in the United States?
Percentage of Population Employed in Legal Services & Support in the United States is 1.2%.