Zip Codes with the Highest Percentage of Population Employed in Arts, Media & Entertainment in Las Vegas, NV

RELATED REPORTS & OPTIONS

Arts, Media & Entertainment
Population
Families and Households
Female Fertility
Female Fertility (Unmarried)
Race (Community Size)
Race (Percentage)
Ancestry (Community Size)
AfghanAfricanAlaska NativeAlbanianAleutAmericanApacheArabArapahoArgentineanArmenianAssyrian / Chaldean / SyriacAustralianAustrianBangladeshiBarbadianBasqueBelgianBelizeanBhutaneseBlackfeetBolivianBrazilianBritishBritish West IndianBulgarianBurmeseCajunCambodianCanadianCape VerdeanCelticCentral AmericanCentral American IndianCherokeeCheyenneChickasawChileanChineseChippewaChoctawColombianComancheCosta RicanCreeCreekCroatianCubanCzechCzechoslovakianDanishDelawareDominicanDutchDutch West IndianEastern EuropeanEcuadorianEgyptianEnglishEstonianEthiopianEuropeanFijianFilipinoFinnishFrenchFrench American IndianFrench CanadianGermanGerman RussianGhanaianGreekGuamanian / ChamorroGuatemalanGuyaneseHaitianHonduranHopiHungarianIcelanderIndian (Asian)IndonesianInupiatIranianIraqiIrishIroquoisIsraeliItalianJamaicanJapaneseJordanianKenyanKoreanLaotianLatvianLebaneseLiberianLithuanianLuxembourgerMacedonianMalaysianMalteseMenomineeMexicanMexican American IndianMongolianMoroccanNative HawaiianNavajoNew ZealanderNicaraguanNigerianNorthern EuropeanNorwegianOkinawanOsagePaiutePakistaniPalestinianPanamanianParaguayanPennsylvania GermanPeruvianPimaPolishPortuguesePotawatomiPuebloPuerto RicanPuget Sound SalishRomanianRussianSalvadoranSamoanScandinavianScotch-IrishScottishSeminoleSenegaleseSerbianShoshoneSierra LeoneanSiouxSlavicSlovakSloveneSomaliSouth AfricanSouth AmericanSouth American IndianSoviet UnionSpaniardSpanishSpanish AmericanSpanish American IndianSri LankanSubsaharan AfricanSudaneseSwedishSwissSyrianThaiTlingit-HaidaTohono O'OdhamTonganTrinidadian and TobagonianTurkishU.S. Virgin IslanderUgandanUkrainianUruguayanUteVenezuelanVietnameseWelshWest IndianYaquiYugoslavianYumanYup'ikZimbabwean
Ancestry (Percentage)
AfghanAfricanAlaska NativeAlbanianAleutAmericanApacheArabArapahoArgentineanArmenianAssyrian / Chaldean / SyriacAustralianAustrianBangladeshiBarbadianBasqueBelgianBelizeanBhutaneseBlackfeetBolivianBrazilianBritishBritish West IndianBulgarianBurmeseCajunCambodianCanadianCape VerdeanCelticCentral AmericanCentral American IndianCherokeeCheyenneChickasawChileanChineseChippewaChoctawColombianComancheCosta RicanCreeCreekCroatianCubanCzechCzechoslovakianDanishDelawareDominicanDutchDutch West IndianEastern EuropeanEcuadorianEgyptianEnglishEstonianEthiopianEuropeanFijianFilipinoFinnishFrenchFrench American IndianFrench CanadianGermanGerman RussianGhanaianGreekGuamanian / ChamorroGuatemalanGuyaneseHaitianHonduranHopiHungarianIcelanderIndian (Asian)IndonesianInupiatIranianIraqiIrishIroquoisIsraeliItalianJamaicanJapaneseJordanianKenyanKoreanLaotianLatvianLebaneseLiberianLithuanianLuxembourgerMacedonianMalaysianMalteseMenomineeMexicanMexican American IndianMongolianMoroccanNative HawaiianNavajoNew ZealanderNicaraguanNigerianNorthern EuropeanNorwegianOkinawanOsagePaiutePakistaniPalestinianPanamanianParaguayanPennsylvania GermanPeruvianPimaPolishPortuguesePotawatomiPuebloPuerto RicanPuget Sound SalishRomanianRussianSalvadoranSamoanScandinavianScotch-IrishScottishSeminoleSenegaleseSerbianShoshoneSierra LeoneanSiouxSlavicSlovakSloveneSomaliSouth AfricanSouth AmericanSouth American IndianSoviet UnionSpaniardSpanishSpanish AmericanSpanish American IndianSri LankanSubsaharan AfricanSudaneseSwedishSwissSyrianThaiTlingit-HaidaTohono O'OdhamTonganTrinidadian and TobagonianTurkishU.S. Virgin IslanderUgandanUkrainianUruguayanUteVenezuelanVietnameseWelshWest IndianYaquiYugoslavianYumanYup'ikZimbabwean
Immigrant Origin (Total)
AfghanistanAfricaAlbaniaArgentinaArmeniaAsiaAustraliaAustriaBahamasBangladeshBarbadosBelarusBelgiumBelizeBoliviaBosnia and HerzegovinaBrazilBulgariaBurma / MyanmarCambodiaCameroonCanadaCaribbeanCentral AmericaChileChinaColombiaCosta RicaCroatiaCubaCzechoslovakiaDenmarkDominican RepublicEastern AfricaEastern AsiaEastern EuropeEcuadorEgyptEl SalvadorEnglandEritreaEthiopiaEuropeFijiFranceGermanyGhanaGreeceGuatemalaGuyanaHaitiHondurasHong KongHungaryIndiaIndonesiaIranIraqIrelandIsraelItalyJamaicaJapanJordanKazakhstanKenyaKoreaLaosLatin AmericaLatviaLebanonLiberiaLithuaniaMalaysiaMexicoMicronesiaMiddle AfricaMoldovaMoroccoNepalNetherlandsNicaraguaNigeriaNorth MacedoniaNorthern AfricaNorthern EuropeNorwayOceaniaPakistanPanamaPeruPhilippinesPolandPortugalRomaniaRussiaSaudi ArabiaScotlandSenegalSerbiaSierra LeoneSingaporeSomaliaSouth AfricaSouth AmericaSouth Central AsiaSouth Eastern AsiaSouthern EuropeSpainSri LankaSudanSwedenSwitzerlandSyriaTaiwanThailandTrinidad and TobagoTurkeyUgandaUkraineUruguayUzbekistanVenezuelaVietnamWest IndiesWestern AfricaWestern AsiaWestern EuropeYemenZaireZimbabwe
Immigrant Origin (Percentage)
AfghanistanAfricaAlbaniaArgentinaArmeniaAsiaAustraliaAustriaBahamasBangladeshBarbadosBelarusBelgiumBelizeBoliviaBosnia and HerzegovinaBrazilBulgariaBurma / MyanmarCambodiaCameroonCanadaCaribbeanCentral AmericaChileChinaColombiaCosta RicaCroatiaCubaCzechoslovakiaDenmarkDominican RepublicEastern AfricaEastern AsiaEastern EuropeEcuadorEgyptEl SalvadorEnglandEritreaEthiopiaEuropeFijiFranceGermanyGhanaGreeceGuatemalaGuyanaHaitiHondurasHong KongHungaryIndiaIndonesiaIranIraqIrelandIsraelItalyJamaicaJapanJordanKazakhstanKenyaKoreaLaosLatin AmericaLatviaLebanonLiberiaLithuaniaMalaysiaMexicoMicronesiaMiddle AfricaMoldovaMoroccoNepalNetherlandsNicaraguaNigeriaNorth MacedoniaNorthern AfricaNorthern EuropeNorwayOceaniaPakistanPanamaPeruPhilippinesPolandPortugalRomaniaRussiaSaudi ArabiaScotlandSenegalSerbiaSierra LeoneSingaporeSomaliaSouth AfricaSouth AmericaSouth Central AsiaSouth Eastern AsiaSouthern EuropeSpainSri LankaSudanSwedenSwitzerlandSyriaTaiwanThailandTrinidad and TobagoTurkeyUgandaUkraineUruguayUzbekistanVenezuelaVietnamWest IndiesWestern AfricaWestern AsiaWestern EuropeYemenZaireZimbabwe
Income
Income (Families)
Income (Households)
Poverty
Poverty (Families)
Unemployment
Employment Occupations
Employment Industries
Employer Class
Commute Time
Commute Means
School Enrollment
Education by Degree Field
Occupancy
Finances
Physical Characteristics
Las Vegas
Compare Zip Codes
Comparison Subject

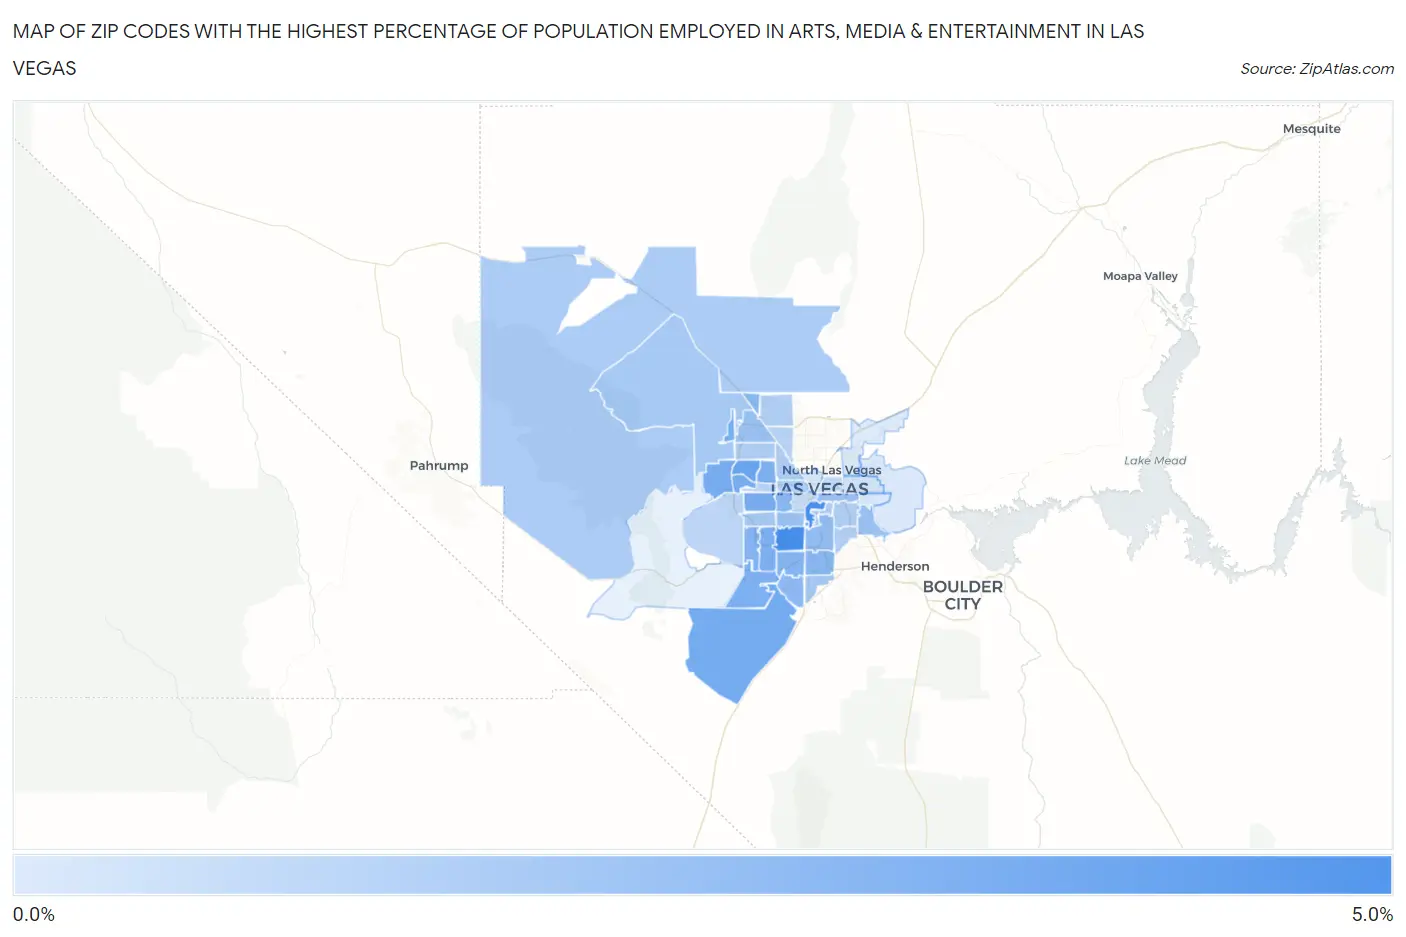
Map of Zip Codes with the Highest Percentage of Population Employed in Arts, Media & Entertainment in Las Vegas

0.0%
5.0%
Zip Codes with the Highest Percentage of Population Employed in Arts, Media & Entertainment in Las Vegas Map

Zip Codes with the Highest Percentage of Population Employed in Arts, Media & Entertainment in Las Vegas, NV

Zip Code % Employed vs State vs National
1.891184.6%2.1%(+2.57)#102.1%(+2.57)#1,748
2.891094.6%2.1%(+2.55)#112.1%(+2.55)#1,770
3.891583.8%2.1%(+1.69)#162.1%(+1.69)#2,684
4.891343.7%2.1%(+1.65)#182.1%(+1.65)#2,744
5.891793.4%2.1%(+1.33)#202.1%(+1.33)#3,266
6.891383.3%2.1%(+1.28)#212.1%(+1.28)#3,357
7.891443.3%2.1%(+1.28)#222.1%(+1.28)#3,359
8.891173.3%2.1%(+1.24)#232.1%(+1.24)#3,427
9.891133.2%2.1%(+1.13)#252.1%(+1.13)#3,625
10.891283.2%2.1%(+1.12)#262.1%(+1.12)#3,647
11.891783.2%2.1%(+1.12)#272.1%(+1.12)#3,664
12.891483.0%2.1%(+0.917)#292.1%(+0.918)#4,138
13.891392.9%2.1%(+0.883)#302.1%(+0.884)#4,218
14.891232.9%2.1%(+0.815)#322.1%(+0.816)#4,405
15.891432.9%2.1%(+0.791)#332.1%(+0.792)#4,467
16.891462.8%2.1%(+0.766)#342.1%(+0.767)#4,540
17.891412.7%2.1%(+0.680)#372.1%(+0.680)#4,786
18.891192.6%2.1%(+0.563)#402.1%(+0.563)#5,156
19.891032.4%2.1%(+0.368)#412.1%(+0.369)#5,822
20.891042.4%2.1%(+0.314)#432.1%(+0.315)#6,028
21.891492.4%2.1%(+0.307)#442.1%(+0.308)#6,059
22.891222.4%2.1%(+0.298)#452.1%(+0.299)#6,086
23.891832.1%2.1%(+0.043)#532.1%(+0.043)#7,258
24.891662.1%2.1%(+0.026)#552.1%(+0.027)#7,348
25.891472.1%2.1%(-0.004)#562.1%(-0.003)#7,507
26.891242.0%2.1%(-0.088)#582.1%(-0.087)#7,961
27.891691.9%2.1%(-0.149)#632.1%(-0.148)#8,297
28.891291.8%2.1%(-0.213)#652.1%(-0.213)#8,677
29.891071.8%2.1%(-0.226)#662.1%(-0.226)#8,764
30.891211.8%2.1%(-0.233)#672.1%(-0.232)#8,807
31.891081.8%2.1%(-0.237)#682.1%(-0.236)#8,828
32.891311.7%2.1%(-0.313)#712.1%(-0.312)#9,276
33.891201.7%2.1%(-0.316)#722.1%(-0.315)#9,298
34.891301.6%2.1%(-0.468)#762.1%(-0.467)#10,381
35.891451.6%2.1%(-0.471)#772.1%(-0.471)#10,399
36.891351.5%2.1%(-0.514)#782.1%(-0.513)#10,670
37.891011.3%2.1%(-0.734)#872.1%(-0.733)#12,254
38.891021.3%2.1%(-0.747)#882.1%(-0.746)#12,342
39.891100.93%2.1%(-1.13)#982.1%(-1.13)#15,416
40.891560.78%2.1%(-1.29)#1042.1%(-1.29)#16,621
41.891420.78%2.1%(-1.29)#1052.1%(-1.29)#16,623
42.891060.75%2.1%(-1.31)#1062.1%(-1.31)#16,850
43.891150.69%2.1%(-1.37)#1072.1%(-1.37)#17,336

Common Questions

What are the Top 10 Zip Codes with the Highest Percentage of Population Employed in Arts, Media & Entertainment in Las Vegas, NV?
Top 10 Zip Codes with the Highest Percentage of Population Employed in Arts, Media & Entertainment in Las Vegas, NV are:
#1
4.6%
#2
4.6%
#3
3.8%
#4
3.7%
#5
3.4%
#6
3.3%
#7
3.3%
#8
3.3%
#9
3.2%
#10
3.2%
What zip code has the Highest Percentage of Population Employed in Arts, Media & Entertainment in Las Vegas, NV?
89118 has the Highest Percentage of Population Employed in Arts, Media & Entertainment in Las Vegas, NV with 4.6%.
What is the Percentage of Population Employed in Arts, Media & Entertainment in Las Vegas, NV?
Percentage of Population Employed in Arts, Media & Entertainment in Las Vegas is 2.2%.
What is the Percentage of Population Employed in Arts, Media & Entertainment in Nevada?
Percentage of Population Employed in Arts, Media & Entertainment in Nevada is 2.1%.
What is the Percentage of Population Employed in Arts, Media & Entertainment in the United States?
Percentage of Population Employed in Arts, Media & Entertainment in the United States is 2.1%.