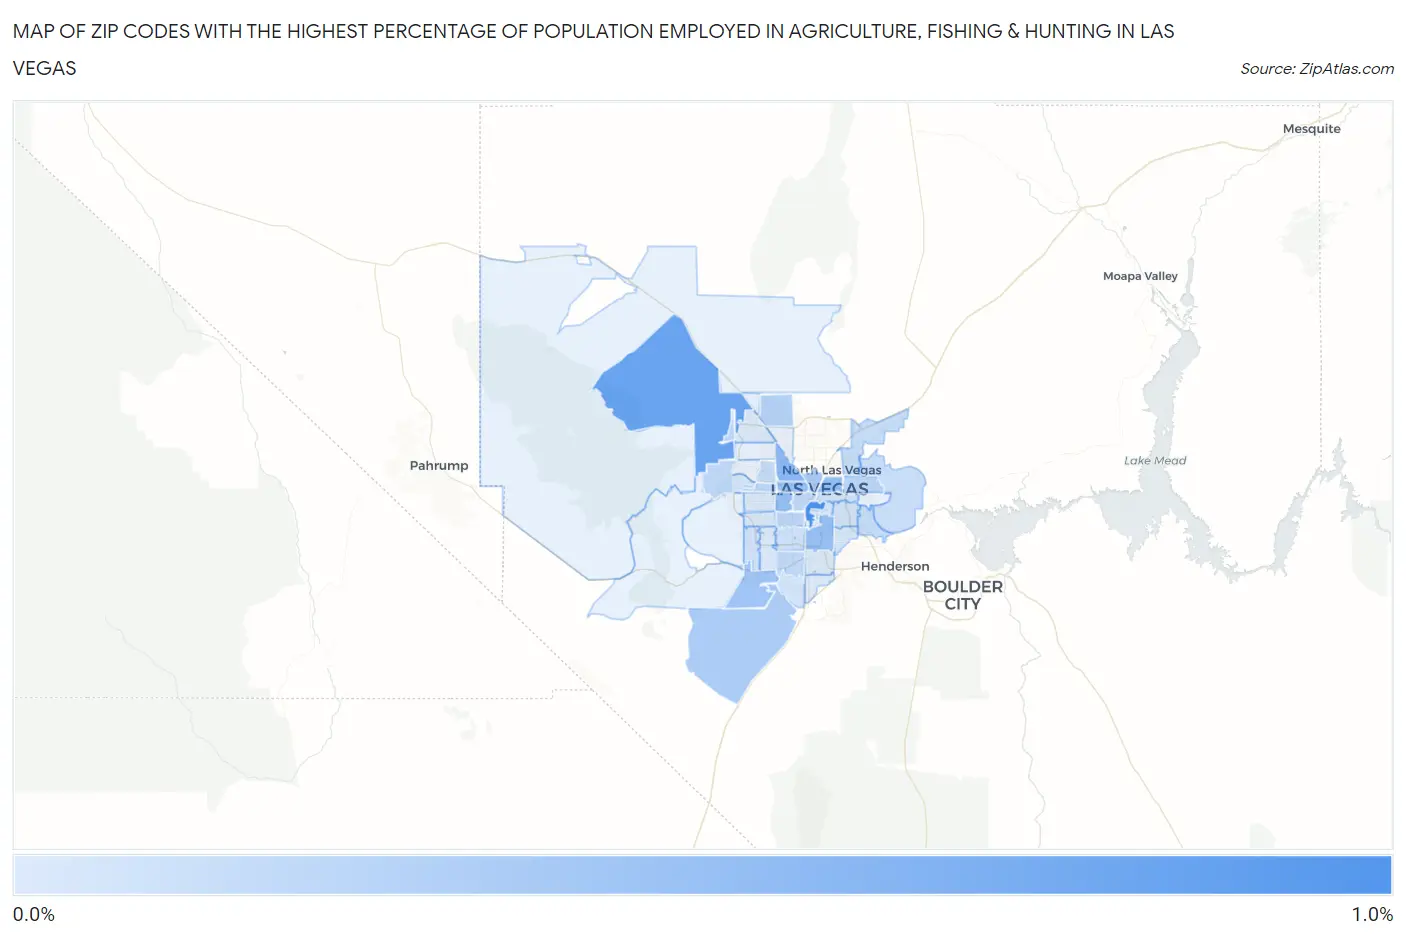
Zip Codes with the Highest Percentage of Population Employed in Agriculture, Fishing & Hunting in Las Vegas, NV
RELATED REPORTS & OPTIONS
Agriculture, Fishing & Hunting
Las Vegas
Compare Zip Codes
Map of Zip Codes with the Highest Percentage of Population Employed in Agriculture, Fishing & Hunting in Las Vegas
0.014%
0.94%

Zip Codes with the Highest Percentage of Population Employed in Agriculture, Fishing & Hunting in Las Vegas, NV
| Zip Code | % Employed | vs State | vs National | |
| 1. | 89109 | 0.94% | 0.40%(+0.541)#41 | 1.2%(-0.262)#16,514 |
| 2. | 89166 | 0.73% | 0.40%(+0.333)#46 | 1.2%(-0.471)#17,679 |
| 3. | 89108 | 0.52% | 0.40%(+0.122)#54 | 1.2%(-0.682)#19,130 |
| 4. | 89101 | 0.45% | 0.40%(+0.059)#55 | 1.2%(-0.745)#19,659 |
| 5. | 89146 | 0.45% | 0.40%(+0.051)#57 | 1.2%(-0.752)#19,728 |
| 6. | 89119 | 0.44% | 0.40%(+0.043)#60 | 1.2%(-0.761)#19,809 |
| 7. | 89107 | 0.43% | 0.40%(+0.035)#61 | 1.2%(-0.769)#19,899 |
| 8. | 89178 | 0.38% | 0.40%(-0.014)#65 | 1.2%(-0.817)#20,321 |
| 9. | 89106 | 0.33% | 0.40%(-0.066)#70 | 1.2%(-0.869)#20,848 |
| 10. | 89179 | 0.32% | 0.40%(-0.080)#71 | 1.2%(-0.883)#20,988 |
| 11. | 89131 | 0.25% | 0.40%(-0.145)#74 | 1.2%(-0.948)#21,746 |
| 12. | 89103 | 0.23% | 0.40%(-0.166)#75 | 1.2%(-0.969)#21,990 |
| 13. | 89110 | 0.22% | 0.40%(-0.180)#77 | 1.2%(-0.984)#22,159 |
| 14. | 89145 | 0.21% | 0.40%(-0.181)#78 | 1.2%(-0.985)#22,176 |
| 15. | 89138 | 0.21% | 0.40%(-0.187)#80 | 1.2%(-0.991)#22,260 |
| 16. | 89139 | 0.20% | 0.40%(-0.194)#81 | 1.2%(-0.998)#22,343 |
| 17. | 89102 | 0.18% | 0.40%(-0.211)#82 | 1.2%(-1.01)#22,537 |
| 18. | 89128 | 0.17% | 0.40%(-0.229)#83 | 1.2%(-1.03)#22,780 |
| 19. | 89115 | 0.16% | 0.40%(-0.236)#85 | 1.2%(-1.04)#22,868 |
| 20. | 89122 | 0.16% | 0.40%(-0.236)#86 | 1.2%(-1.04)#22,877 |
| 21. | 89156 | 0.14% | 0.40%(-0.252)#87 | 1.2%(-1.06)#23,095 |
| 22. | 89118 | 0.11% | 0.40%(-0.288)#92 | 1.2%(-1.09)#23,565 |
| 23. | 89148 | 0.10% | 0.40%(-0.295)#93 | 1.2%(-1.10)#23,677 |
| 24. | 89121 | 0.084% | 0.40%(-0.312)#94 | 1.2%(-1.12)#23,906 |
| 25. | 89104 | 0.079% | 0.40%(-0.317)#95 | 1.2%(-1.12)#23,969 |
| 26. | 89144 | 0.072% | 0.40%(-0.323)#98 | 1.2%(-1.13)#24,066 |
| 27. | 89141 | 0.069% | 0.40%(-0.327)#99 | 1.2%(-1.13)#24,117 |
| 28. | 89120 | 0.055% | 0.40%(-0.340)#100 | 1.2%(-1.14)#24,283 |
| 29. | 89147 | 0.042% | 0.40%(-0.354)#102 | 1.2%(-1.16)#24,429 |
| 30. | 89113 | 0.040% | 0.40%(-0.355)#103 | 1.2%(-1.16)#24,443 |
| 31. | 89169 | 0.038% | 0.40%(-0.357)#104 | 1.2%(-1.16)#24,469 |
| 32. | 89123 | 0.035% | 0.40%(-0.361)#105 | 1.2%(-1.16)#24,500 |
| 33. | 89149 | 0.028% | 0.40%(-0.367)#106 | 1.2%(-1.17)#24,540 |
| 34. | 89117 | 0.022% | 0.40%(-0.374)#107 | 1.2%(-1.18)#24,568 |
| 35. | 89183 | 0.014% | 0.40%(-0.381)#110 | 1.2%(-1.19)#24,608 |
1
Common Questions
What are the Top 10 Zip Codes with the Highest Percentage of Population Employed in Agriculture, Fishing & Hunting in Las Vegas, NV?
Top 10 Zip Codes with the Highest Percentage of Population Employed in Agriculture, Fishing & Hunting in Las Vegas, NV are:
What zip code has the Highest Percentage of Population Employed in Agriculture, Fishing & Hunting in Las Vegas, NV?
89109 has the Highest Percentage of Population Employed in Agriculture, Fishing & Hunting in Las Vegas, NV with 0.94%.
What is the Percentage of Population Employed in Agriculture, Fishing & Hunting in Las Vegas, NV?
Percentage of Population Employed in Agriculture, Fishing & Hunting in Las Vegas is 0.24%.
What is the Percentage of Population Employed in Agriculture, Fishing & Hunting in Nevada?
Percentage of Population Employed in Agriculture, Fishing & Hunting in Nevada is 0.40%.
What is the Percentage of Population Employed in Agriculture, Fishing & Hunting in the United States?
Percentage of Population Employed in Agriculture, Fishing & Hunting in the United States is 1.2%.