Zip Codes with the Highest Percentage of Hawaiian / Pacific Population in Las Vegas, NV
RELATED REPORTS & OPTIONS
Hawaiian / Pacific
Las Vegas
Compare Zip Codes
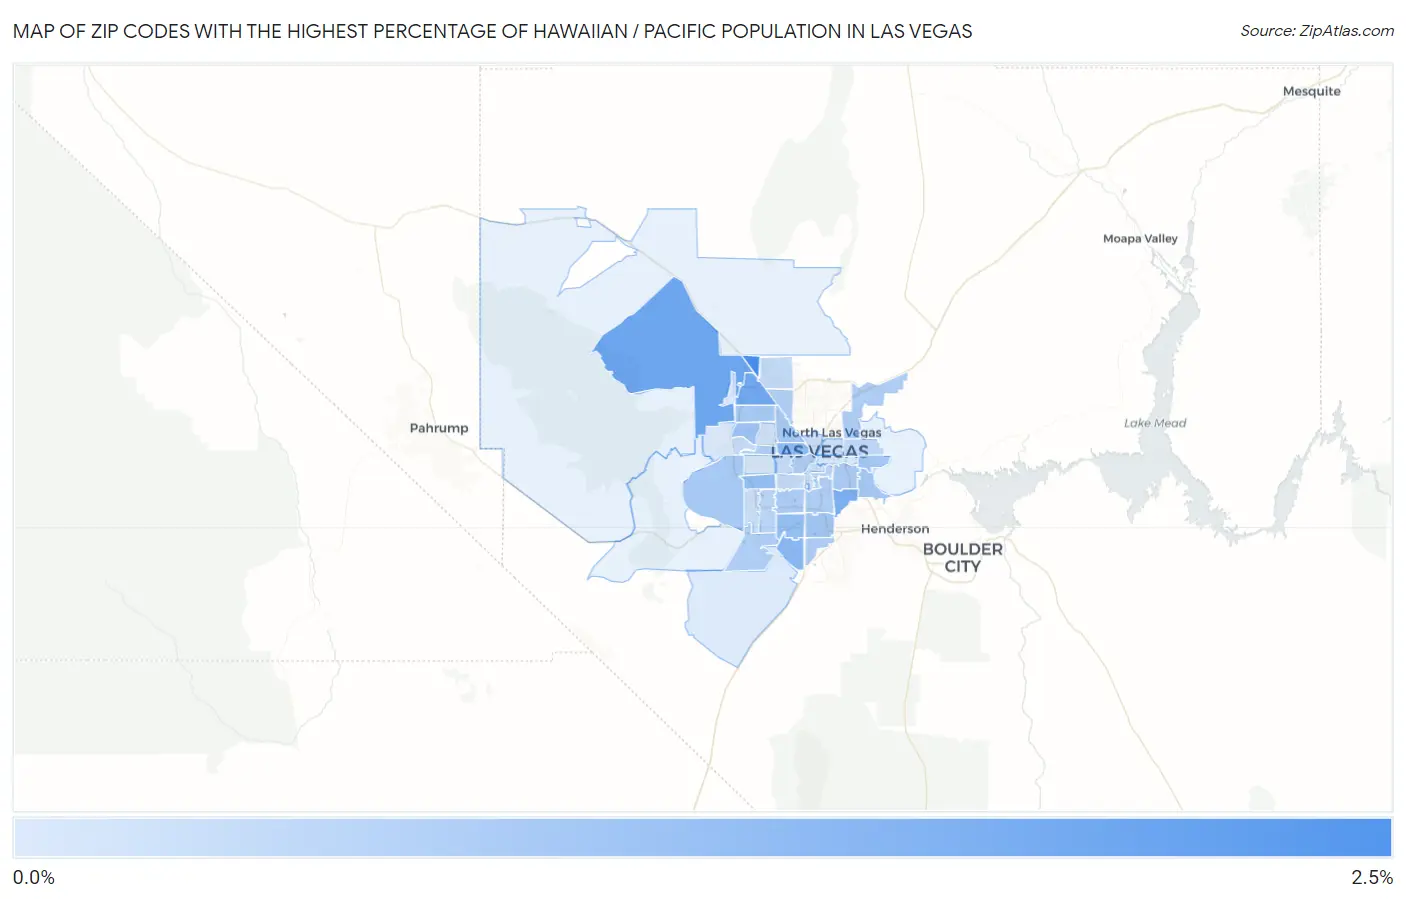
Map of Zip Codes with the Highest Percentage of Hawaiian / Pacific Population in Las Vegas
0.075%
2.5%
Zip Codes with the Highest Percentage of Hawaiian / Pacific Population in Las Vegas, NV
| Zip Code | Hawaiian / Pacific | vs State | vs National | |
| 1. | 89143 | 2.5% | 0.70%(+1.76)#6 | 0.19%(+2.28)#265 |
| 2. | 89166 | 1.8% | 0.70%(+1.12)#8 | 0.19%(+1.63)#376 |
| 3. | 89149 | 1.8% | 0.70%(+1.11)#9 | 0.19%(+1.62)#378 |
| 4. | 89120 | 1.6% | 0.70%(+0.906)#12 | 0.19%(+1.42)#432 |
| 5. | 89141 | 1.4% | 0.70%(+0.705)#15 | 0.19%(+1.22)#499 |
| 6. | 89107 | 1.3% | 0.70%(+0.562)#18 | 0.19%(+1.08)#572 |
| 7. | 89147 | 1.2% | 0.70%(+0.495)#19 | 0.19%(+1.01)#602 |
| 8. | 89139 | 1.2% | 0.70%(+0.487)#20 | 0.19%(+1.00)#611 |
| 9. | 89134 | 1.1% | 0.70%(+0.396)#23 | 0.19%(+0.912)#660 |
| 10. | 89123 | 0.98% | 0.70%(+0.272)#31 | 0.19%(+0.788)#750 |
| 11. | 89142 | 0.96% | 0.70%(+0.260)#32 | 0.19%(+0.776)#758 |
| 12. | 89122 | 0.96% | 0.70%(+0.257)#33 | 0.19%(+0.773)#764 |
| 13. | 89108 | 0.93% | 0.70%(+0.226)#34 | 0.19%(+0.742)#782 |
| 14. | 89129 | 0.91% | 0.70%(+0.203)#35 | 0.19%(+0.719)#799 |
| 15. | 89135 | 0.90% | 0.70%(+0.199)#36 | 0.19%(+0.715)#805 |
| 16. | 89121 | 0.85% | 0.70%(+0.142)#38 | 0.19%(+0.658)#861 |
| 17. | 89118 | 0.84% | 0.70%(+0.130)#40 | 0.19%(+0.646)#877 |
| 18. | 89183 | 0.81% | 0.70%(+0.106)#41 | 0.19%(+0.622)#910 |
| 19. | 89178 | 0.80% | 0.70%(+0.094)#43 | 0.19%(+0.610)#927 |
| 20. | 89102 | 0.80% | 0.70%(+0.091)#44 | 0.19%(+0.607)#929 |
| 21. | 89119 | 0.79% | 0.70%(+0.086)#45 | 0.19%(+0.602)#935 |
| 22. | 89115 | 0.79% | 0.70%(+0.082)#46 | 0.19%(+0.598)#940 |
| 23. | 89145 | 0.78% | 0.70%(+0.074)#47 | 0.19%(+0.590)#948 |
| 24. | 89130 | 0.74% | 0.70%(+0.031)#49 | 0.19%(+0.547)#1,006 |
| 25. | 89113 | 0.62% | 0.70%(-0.080)#52 | 0.19%(+0.436)#1,185 |
| 26. | 89169 | 0.60% | 0.70%(-0.101)#53 | 0.19%(+0.415)#1,215 |
| 27. | 89110 | 0.51% | 0.70%(-0.197)#57 | 0.19%(+0.319)#1,398 |
| 28. | 89144 | 0.48% | 0.70%(-0.220)#59 | 0.19%(+0.296)#1,460 |
| 29. | 89131 | 0.48% | 0.70%(-0.228)#62 | 0.19%(+0.288)#1,480 |
| 30. | 89103 | 0.47% | 0.70%(-0.235)#63 | 0.19%(+0.281)#1,501 |
| 31. | 89146 | 0.45% | 0.70%(-0.256)#65 | 0.19%(+0.260)#1,554 |
| 32. | 89148 | 0.39% | 0.70%(-0.310)#68 | 0.19%(+0.206)#1,717 |
| 33. | 89106 | 0.37% | 0.70%(-0.333)#69 | 0.19%(+0.183)#1,814 |
| 34. | 89109 | 0.37% | 0.70%(-0.335)#70 | 0.19%(+0.181)#1,822 |
| 35. | 89101 | 0.34% | 0.70%(-0.369)#73 | 0.19%(+0.147)#1,953 |
| 36. | 89128 | 0.30% | 0.70%(-0.406)#77 | 0.19%(+0.110)#2,131 |
| 37. | 89117 | 0.17% | 0.70%(-0.531)#86 | 0.19%(-0.015)#3,070 |
| 38. | 89138 | 0.14% | 0.70%(-0.563)#89 | 0.19%(-0.047)#3,440 |
| 39. | 89104 | 0.11% | 0.70%(-0.594)#92 | 0.19%(-0.078)#3,853 |
| 40. | 89179 | 0.075% | 0.70%(-0.630)#98 | 0.19%(-0.114)#4,534 |
1
Common Questions
What are the Top 10 Zip Codes with the Highest Percentage of Hawaiian / Pacific Population in Las Vegas, NV?
Top 10 Zip Codes with the Highest Percentage of Hawaiian / Pacific Population in Las Vegas, NV are:
What zip code has the Highest Percentage of Hawaiian / Pacific Population in Las Vegas, NV?
89143 has the Highest Percentage of Hawaiian / Pacific Population in Las Vegas, NV with 2.5%.
What is the Percentage of Hawaiian / Pacific Population in Las Vegas, NV?
Percentage of Hawaiian / Pacific Population in Las Vegas is 0.81%.
What is the Percentage of Hawaiian / Pacific Population in Nevada?
Percentage of Hawaiian / Pacific Population in Nevada is 0.70%.
What is the Percentage of Hawaiian / Pacific Population in the United States?
Percentage of Hawaiian / Pacific Population in the United States is 0.19%.