Zip Codes with the Highest Percentage of Population Employed in Firefighting & Prevention in Las Vegas, NV

RELATED REPORTS & OPTIONS

Firefighting & Prevention
Population
Families and Households
Female Fertility
Female Fertility (Unmarried)
Race (Community Size)
Race (Percentage)
Ancestry (Community Size)
AfghanAfricanAlaska NativeAlbanianAleutAmericanApacheArabArapahoArgentineanArmenianAssyrian / Chaldean / SyriacAustralianAustrianBangladeshiBarbadianBasqueBelgianBelizeanBhutaneseBlackfeetBolivianBrazilianBritishBritish West IndianBulgarianBurmeseCajunCambodianCanadianCape VerdeanCelticCentral AmericanCentral American IndianCherokeeCheyenneChickasawChileanChineseChippewaChoctawColombianComancheCosta RicanCreeCreekCroatianCubanCzechCzechoslovakianDanishDelawareDominicanDutchDutch West IndianEastern EuropeanEcuadorianEgyptianEnglishEstonianEthiopianEuropeanFijianFilipinoFinnishFrenchFrench American IndianFrench CanadianGermanGerman RussianGhanaianGreekGuamanian / ChamorroGuatemalanGuyaneseHaitianHonduranHopiHungarianIcelanderIndian (Asian)IndonesianInupiatIranianIraqiIrishIroquoisIsraeliItalianJamaicanJapaneseJordanianKenyanKoreanLaotianLatvianLebaneseLiberianLithuanianLuxembourgerMacedonianMalaysianMalteseMenomineeMexicanMexican American IndianMongolianMoroccanNative HawaiianNavajoNew ZealanderNicaraguanNigerianNorthern EuropeanNorwegianOkinawanOsagePaiutePakistaniPalestinianPanamanianParaguayanPennsylvania GermanPeruvianPimaPolishPortuguesePotawatomiPuebloPuerto RicanPuget Sound SalishRomanianRussianSalvadoranSamoanScandinavianScotch-IrishScottishSeminoleSenegaleseSerbianShoshoneSierra LeoneanSiouxSlavicSlovakSloveneSomaliSouth AfricanSouth AmericanSouth American IndianSoviet UnionSpaniardSpanishSpanish AmericanSpanish American IndianSri LankanSubsaharan AfricanSudaneseSwedishSwissSyrianThaiTlingit-HaidaTohono O'OdhamTonganTrinidadian and TobagonianTurkishU.S. Virgin IslanderUgandanUkrainianUruguayanUteVenezuelanVietnameseWelshWest IndianYaquiYugoslavianYumanYup'ikZimbabwean
Ancestry (Percentage)
AfghanAfricanAlaska NativeAlbanianAleutAmericanApacheArabArapahoArgentineanArmenianAssyrian / Chaldean / SyriacAustralianAustrianBangladeshiBarbadianBasqueBelgianBelizeanBhutaneseBlackfeetBolivianBrazilianBritishBritish West IndianBulgarianBurmeseCajunCambodianCanadianCape VerdeanCelticCentral AmericanCentral American IndianCherokeeCheyenneChickasawChileanChineseChippewaChoctawColombianComancheCosta RicanCreeCreekCroatianCubanCzechCzechoslovakianDanishDelawareDominicanDutchDutch West IndianEastern EuropeanEcuadorianEgyptianEnglishEstonianEthiopianEuropeanFijianFilipinoFinnishFrenchFrench American IndianFrench CanadianGermanGerman RussianGhanaianGreekGuamanian / ChamorroGuatemalanGuyaneseHaitianHonduranHopiHungarianIcelanderIndian (Asian)IndonesianInupiatIranianIraqiIrishIroquoisIsraeliItalianJamaicanJapaneseJordanianKenyanKoreanLaotianLatvianLebaneseLiberianLithuanianLuxembourgerMacedonianMalaysianMalteseMenomineeMexicanMexican American IndianMongolianMoroccanNative HawaiianNavajoNew ZealanderNicaraguanNigerianNorthern EuropeanNorwegianOkinawanOsagePaiutePakistaniPalestinianPanamanianParaguayanPennsylvania GermanPeruvianPimaPolishPortuguesePotawatomiPuebloPuerto RicanPuget Sound SalishRomanianRussianSalvadoranSamoanScandinavianScotch-IrishScottishSeminoleSenegaleseSerbianShoshoneSierra LeoneanSiouxSlavicSlovakSloveneSomaliSouth AfricanSouth AmericanSouth American IndianSoviet UnionSpaniardSpanishSpanish AmericanSpanish American IndianSri LankanSubsaharan AfricanSudaneseSwedishSwissSyrianThaiTlingit-HaidaTohono O'OdhamTonganTrinidadian and TobagonianTurkishU.S. Virgin IslanderUgandanUkrainianUruguayanUteVenezuelanVietnameseWelshWest IndianYaquiYugoslavianYumanYup'ikZimbabwean
Immigrant Origin (Total)
AfghanistanAfricaAlbaniaArgentinaArmeniaAsiaAustraliaAustriaBahamasBangladeshBarbadosBelarusBelgiumBelizeBoliviaBosnia and HerzegovinaBrazilBulgariaBurma / MyanmarCambodiaCameroonCanadaCaribbeanCentral AmericaChileChinaColombiaCosta RicaCroatiaCubaCzechoslovakiaDenmarkDominican RepublicEastern AfricaEastern AsiaEastern EuropeEcuadorEgyptEl SalvadorEnglandEritreaEthiopiaEuropeFijiFranceGermanyGhanaGreeceGuatemalaGuyanaHaitiHondurasHong KongHungaryIndiaIndonesiaIranIraqIrelandIsraelItalyJamaicaJapanJordanKazakhstanKenyaKoreaLaosLatin AmericaLatviaLebanonLiberiaLithuaniaMalaysiaMexicoMicronesiaMiddle AfricaMoldovaMoroccoNepalNetherlandsNicaraguaNigeriaNorth MacedoniaNorthern AfricaNorthern EuropeNorwayOceaniaPakistanPanamaPeruPhilippinesPolandPortugalRomaniaRussiaSaudi ArabiaScotlandSenegalSerbiaSierra LeoneSingaporeSomaliaSouth AfricaSouth AmericaSouth Central AsiaSouth Eastern AsiaSouthern EuropeSpainSri LankaSudanSwedenSwitzerlandSyriaTaiwanThailandTrinidad and TobagoTurkeyUgandaUkraineUruguayUzbekistanVenezuelaVietnamWest IndiesWestern AfricaWestern AsiaWestern EuropeYemenZaireZimbabwe
Immigrant Origin (Percentage)
AfghanistanAfricaAlbaniaArgentinaArmeniaAsiaAustraliaAustriaBahamasBangladeshBarbadosBelarusBelgiumBelizeBoliviaBosnia and HerzegovinaBrazilBulgariaBurma / MyanmarCambodiaCameroonCanadaCaribbeanCentral AmericaChileChinaColombiaCosta RicaCroatiaCubaCzechoslovakiaDenmarkDominican RepublicEastern AfricaEastern AsiaEastern EuropeEcuadorEgyptEl SalvadorEnglandEritreaEthiopiaEuropeFijiFranceGermanyGhanaGreeceGuatemalaGuyanaHaitiHondurasHong KongHungaryIndiaIndonesiaIranIraqIrelandIsraelItalyJamaicaJapanJordanKazakhstanKenyaKoreaLaosLatin AmericaLatviaLebanonLiberiaLithuaniaMalaysiaMexicoMicronesiaMiddle AfricaMoldovaMoroccoNepalNetherlandsNicaraguaNigeriaNorth MacedoniaNorthern AfricaNorthern EuropeNorwayOceaniaPakistanPanamaPeruPhilippinesPolandPortugalRomaniaRussiaSaudi ArabiaScotlandSenegalSerbiaSierra LeoneSingaporeSomaliaSouth AfricaSouth AmericaSouth Central AsiaSouth Eastern AsiaSouthern EuropeSpainSri LankaSudanSwedenSwitzerlandSyriaTaiwanThailandTrinidad and TobagoTurkeyUgandaUkraineUruguayUzbekistanVenezuelaVietnamWest IndiesWestern AfricaWestern AsiaWestern EuropeYemenZaireZimbabwe
Income
Income (Families)
Income (Households)
Poverty
Poverty (Families)
Unemployment
Employment Occupations
Employment Industries
Employer Class
Commute Time
Commute Means
School Enrollment
Education by Degree Field
Occupancy
Finances
Physical Characteristics
Las Vegas
Compare Zip Codes
Comparison Subject

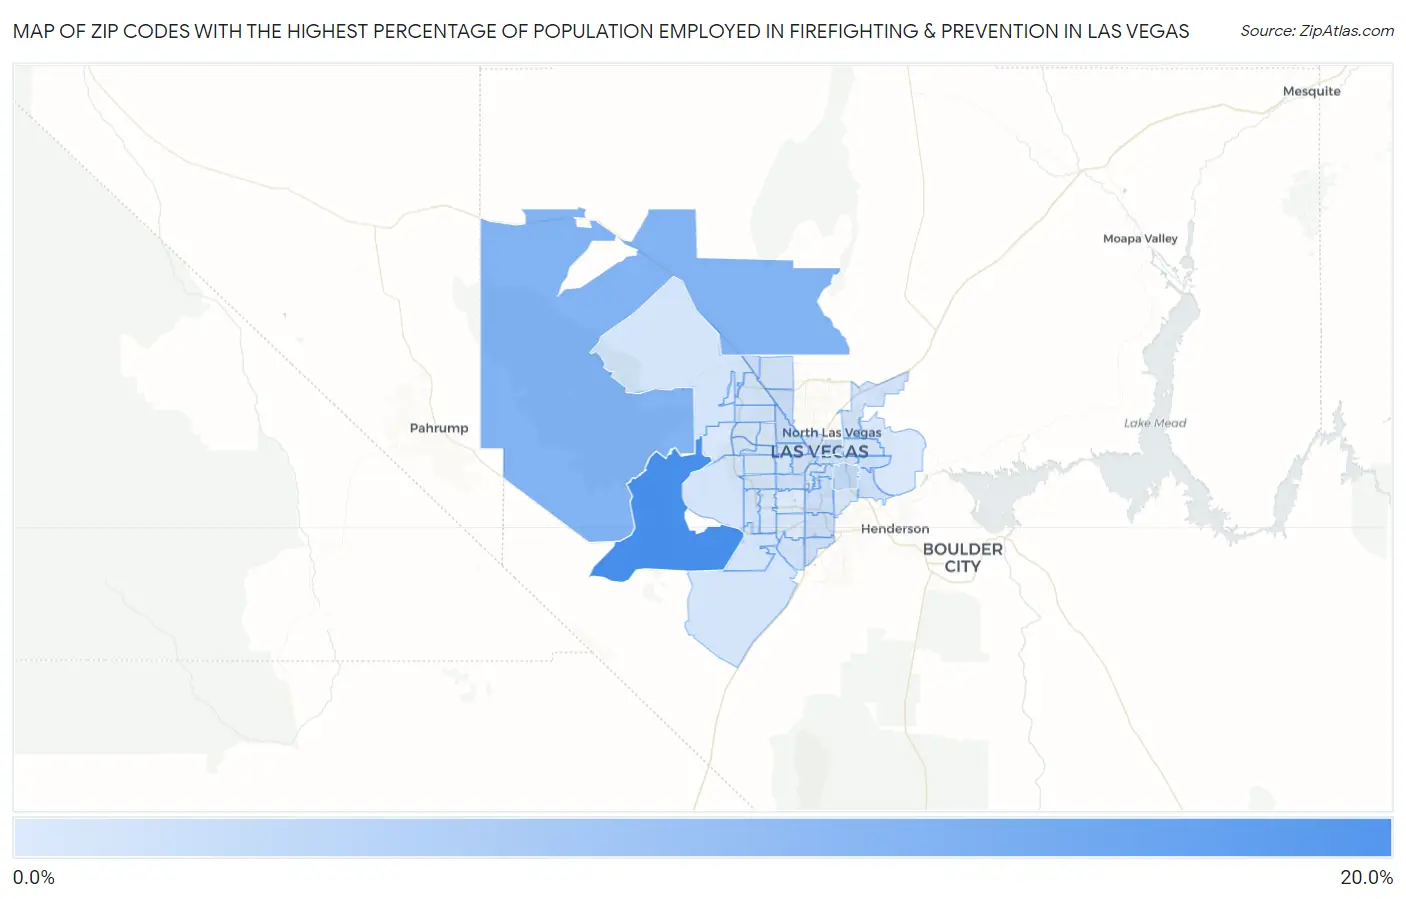
Map of Zip Codes with the Highest Percentage of Population Employed in Firefighting & Prevention in Las Vegas

0.0%
20.0%
Zip Codes with the Highest Percentage of Population Employed in Firefighting & Prevention in Las Vegas Map

Zip Codes with the Highest Percentage of Population Employed in Firefighting & Prevention in Las Vegas, NV

Zip Code % Employed vs State vs National
1.8916117.9%2.1%(+15.8)#21.2%(+16.7)#119
2.8912411.2%2.1%(+9.08)#41.2%(+10.00)#257
3.891214.0%2.1%(+1.87)#131.2%(+2.78)#1,377
4.891013.8%2.1%(+1.72)#141.2%(+2.63)#1,457
5.891303.2%2.1%(+1.06)#241.2%(+1.98)#2,061
6.891083.1%2.1%(+0.971)#261.2%(+1.88)#2,160
7.891433.0%2.1%(+0.924)#281.2%(+1.84)#2,213
8.891192.8%2.1%(+0.744)#311.2%(+1.66)#2,480
9.891832.6%2.1%(+0.546)#341.2%(+1.46)#2,801
10.891422.6%2.1%(+0.532)#351.2%(+1.45)#2,828
11.891232.6%2.1%(+0.531)#371.2%(+1.45)#2,835
12.891022.5%2.1%(+0.409)#401.2%(+1.32)#3,076
13.891692.5%2.1%(+0.406)#411.2%(+1.32)#3,080
14.891062.5%2.1%(+0.366)#441.2%(+1.28)#3,174
15.891222.5%2.1%(+0.364)#451.2%(+1.28)#3,180
16.891032.4%2.1%(+0.314)#461.2%(+1.23)#3,300
17.891452.3%2.1%(+0.249)#481.2%(+1.16)#3,453
18.891042.3%2.1%(+0.225)#501.2%(+1.14)#3,507
19.891152.2%2.1%(+0.117)#521.2%(+1.03)#3,807
20.891292.2%2.1%(+0.107)#531.2%(+1.02)#3,843
21.891472.2%2.1%(+0.100)#541.2%(+1.01)#3,861
22.891442.2%2.1%(+0.062)#561.2%(+0.976)#3,978
23.891412.1%2.1%(+0.038)#571.2%(+0.952)#4,039
24.891312.1%2.1%(-0.023)#581.2%(+0.891)#4,230
25.891482.1%2.1%(-0.035)#591.2%(+0.879)#4,279
26.891352.0%2.1%(-0.081)#601.2%(+0.833)#4,447
27.891662.0%2.1%(-0.096)#611.2%(+0.818)#4,494
28.891342.0%2.1%(-0.097)#621.2%(+0.817)#4,497
29.891782.0%2.1%(-0.108)#631.2%(+0.806)#4,532
30.891792.0%2.1%(-0.143)#661.2%(+0.771)#4,673
31.891462.0%2.1%(-0.145)#671.2%(+0.768)#4,684
32.891491.9%2.1%(-0.173)#681.2%(+0.741)#4,799
33.891101.8%2.1%(-0.333)#761.2%(+0.581)#5,507
34.891091.8%2.1%(-0.338)#781.2%(+0.576)#5,534
35.891131.6%2.1%(-0.505)#801.2%(+0.408)#6,416
36.891281.6%2.1%(-0.530)#831.2%(+0.383)#6,549
37.891201.5%2.1%(-0.551)#841.2%(+0.362)#6,669
38.891071.5%2.1%(-0.608)#851.2%(+0.305)#7,033
39.891171.4%2.1%(-0.712)#901.2%(+0.202)#7,730
40.891381.3%2.1%(-0.786)#931.2%(+0.127)#8,255
41.891561.3%2.1%(-0.796)#941.2%(+0.118)#8,318
42.891391.2%2.1%(-0.875)#1001.2%(+0.039)#8,946
43.891180.94%2.1%(-1.15)#1121.2%(-0.241)#11,698

Common Questions

What are the Top 10 Zip Codes with the Highest Percentage of Population Employed in Firefighting & Prevention in Las Vegas, NV?
Top 10 Zip Codes with the Highest Percentage of Population Employed in Firefighting & Prevention in Las Vegas, NV are:
#1
17.9%
#2
11.2%
#3
4.0%
#4
3.8%
#5
3.2%
#6
3.1%
#7
3.0%
#8
2.8%
#9
2.6%
#10
2.6%
What zip code has the Highest Percentage of Population Employed in Firefighting & Prevention in Las Vegas, NV?
89161 has the Highest Percentage of Population Employed in Firefighting & Prevention in Las Vegas, NV with 17.9%.
What is the Percentage of Population Employed in Firefighting & Prevention in Las Vegas, NV?
Percentage of Population Employed in Firefighting & Prevention in Las Vegas is 2.3%.
What is the Percentage of Population Employed in Firefighting & Prevention in Nevada?
Percentage of Population Employed in Firefighting & Prevention in Nevada is 2.1%.
What is the Percentage of Population Employed in Firefighting & Prevention in the United States?
Percentage of Population Employed in Firefighting & Prevention in the United States is 1.2%.