Zip Codes with the Highest Poverty Level Among Children Under the Age of 5 in Las Vegas, NV

RELATED REPORTS & OPTIONS

Highest Poverty | Child 0-5
Population
Families and Households
Female Fertility
Female Fertility (Unmarried)
Race (Community Size)
Race (Percentage)
Ancestry (Community Size)
AfghanAfricanAlaska NativeAlbanianAleutAmericanApacheArabArapahoArgentineanArmenianAssyrian / Chaldean / SyriacAustralianAustrianBangladeshiBarbadianBasqueBelgianBelizeanBhutaneseBlackfeetBolivianBrazilianBritishBritish West IndianBulgarianBurmeseCajunCambodianCanadianCape VerdeanCelticCentral AmericanCentral American IndianCherokeeCheyenneChickasawChileanChineseChippewaChoctawColombianComancheCosta RicanCreeCreekCroatianCubanCzechCzechoslovakianDanishDelawareDominicanDutchDutch West IndianEastern EuropeanEcuadorianEgyptianEnglishEstonianEthiopianEuropeanFijianFilipinoFinnishFrenchFrench American IndianFrench CanadianGermanGerman RussianGhanaianGreekGuamanian / ChamorroGuatemalanGuyaneseHaitianHonduranHopiHungarianIcelanderIndian (Asian)IndonesianInupiatIranianIraqiIrishIroquoisIsraeliItalianJamaicanJapaneseJordanianKenyanKoreanLaotianLatvianLebaneseLiberianLithuanianLuxembourgerMacedonianMalaysianMalteseMenomineeMexicanMexican American IndianMongolianMoroccanNative HawaiianNavajoNew ZealanderNicaraguanNigerianNorthern EuropeanNorwegianOkinawanOsagePaiutePakistaniPalestinianPanamanianParaguayanPennsylvania GermanPeruvianPimaPolishPortuguesePotawatomiPuebloPuerto RicanPuget Sound SalishRomanianRussianSalvadoranSamoanScandinavianScotch-IrishScottishSeminoleSenegaleseSerbianShoshoneSierra LeoneanSiouxSlavicSlovakSloveneSomaliSouth AfricanSouth AmericanSouth American IndianSoviet UnionSpaniardSpanishSpanish AmericanSpanish American IndianSri LankanSubsaharan AfricanSudaneseSwedishSwissSyrianThaiTlingit-HaidaTohono O'OdhamTonganTrinidadian and TobagonianTurkishU.S. Virgin IslanderUgandanUkrainianUruguayanUteVenezuelanVietnameseWelshWest IndianYaquiYugoslavianYumanYup'ikZimbabwean
Ancestry (Percentage)
AfghanAfricanAlaska NativeAlbanianAleutAmericanApacheArabArapahoArgentineanArmenianAssyrian / Chaldean / SyriacAustralianAustrianBangladeshiBarbadianBasqueBelgianBelizeanBhutaneseBlackfeetBolivianBrazilianBritishBritish West IndianBulgarianBurmeseCajunCambodianCanadianCape VerdeanCelticCentral AmericanCentral American IndianCherokeeCheyenneChickasawChileanChineseChippewaChoctawColombianComancheCosta RicanCreeCreekCroatianCubanCzechCzechoslovakianDanishDelawareDominicanDutchDutch West IndianEastern EuropeanEcuadorianEgyptianEnglishEstonianEthiopianEuropeanFijianFilipinoFinnishFrenchFrench American IndianFrench CanadianGermanGerman RussianGhanaianGreekGuamanian / ChamorroGuatemalanGuyaneseHaitianHonduranHopiHungarianIcelanderIndian (Asian)IndonesianInupiatIranianIraqiIrishIroquoisIsraeliItalianJamaicanJapaneseJordanianKenyanKoreanLaotianLatvianLebaneseLiberianLithuanianLuxembourgerMacedonianMalaysianMalteseMenomineeMexicanMexican American IndianMongolianMoroccanNative HawaiianNavajoNew ZealanderNicaraguanNigerianNorthern EuropeanNorwegianOkinawanOsagePaiutePakistaniPalestinianPanamanianParaguayanPennsylvania GermanPeruvianPimaPolishPortuguesePotawatomiPuebloPuerto RicanPuget Sound SalishRomanianRussianSalvadoranSamoanScandinavianScotch-IrishScottishSeminoleSenegaleseSerbianShoshoneSierra LeoneanSiouxSlavicSlovakSloveneSomaliSouth AfricanSouth AmericanSouth American IndianSoviet UnionSpaniardSpanishSpanish AmericanSpanish American IndianSri LankanSubsaharan AfricanSudaneseSwedishSwissSyrianThaiTlingit-HaidaTohono O'OdhamTonganTrinidadian and TobagonianTurkishU.S. Virgin IslanderUgandanUkrainianUruguayanUteVenezuelanVietnameseWelshWest IndianYaquiYugoslavianYumanYup'ikZimbabwean
Immigrant Origin (Total)
AfghanistanAfricaAlbaniaArgentinaArmeniaAsiaAustraliaAustriaBahamasBangladeshBarbadosBelarusBelgiumBelizeBoliviaBosnia and HerzegovinaBrazilBulgariaBurma / MyanmarCambodiaCameroonCanadaCaribbeanCentral AmericaChileChinaColombiaCosta RicaCroatiaCubaCzechoslovakiaDenmarkDominican RepublicEastern AfricaEastern AsiaEastern EuropeEcuadorEgyptEl SalvadorEnglandEritreaEthiopiaEuropeFijiFranceGermanyGhanaGreeceGuatemalaGuyanaHaitiHondurasHong KongHungaryIndiaIndonesiaIranIraqIrelandIsraelItalyJamaicaJapanJordanKazakhstanKenyaKoreaLaosLatin AmericaLatviaLebanonLiberiaLithuaniaMalaysiaMexicoMicronesiaMiddle AfricaMoldovaMoroccoNepalNetherlandsNicaraguaNigeriaNorth MacedoniaNorthern AfricaNorthern EuropeNorwayOceaniaPakistanPanamaPeruPhilippinesPolandPortugalRomaniaRussiaSaudi ArabiaScotlandSenegalSerbiaSierra LeoneSingaporeSomaliaSouth AfricaSouth AmericaSouth Central AsiaSouth Eastern AsiaSouthern EuropeSpainSri LankaSudanSwedenSwitzerlandSyriaTaiwanThailandTrinidad and TobagoTurkeyUgandaUkraineUruguayUzbekistanVenezuelaVietnamWest IndiesWestern AfricaWestern AsiaWestern EuropeYemenZaireZimbabwe
Immigrant Origin (Percentage)
AfghanistanAfricaAlbaniaArgentinaArmeniaAsiaAustraliaAustriaBahamasBangladeshBarbadosBelarusBelgiumBelizeBoliviaBosnia and HerzegovinaBrazilBulgariaBurma / MyanmarCambodiaCameroonCanadaCaribbeanCentral AmericaChileChinaColombiaCosta RicaCroatiaCubaCzechoslovakiaDenmarkDominican RepublicEastern AfricaEastern AsiaEastern EuropeEcuadorEgyptEl SalvadorEnglandEritreaEthiopiaEuropeFijiFranceGermanyGhanaGreeceGuatemalaGuyanaHaitiHondurasHong KongHungaryIndiaIndonesiaIranIraqIrelandIsraelItalyJamaicaJapanJordanKazakhstanKenyaKoreaLaosLatin AmericaLatviaLebanonLiberiaLithuaniaMalaysiaMexicoMicronesiaMiddle AfricaMoldovaMoroccoNepalNetherlandsNicaraguaNigeriaNorth MacedoniaNorthern AfricaNorthern EuropeNorwayOceaniaPakistanPanamaPeruPhilippinesPolandPortugalRomaniaRussiaSaudi ArabiaScotlandSenegalSerbiaSierra LeoneSingaporeSomaliaSouth AfricaSouth AmericaSouth Central AsiaSouth Eastern AsiaSouthern EuropeSpainSri LankaSudanSwedenSwitzerlandSyriaTaiwanThailandTrinidad and TobagoTurkeyUgandaUkraineUruguayUzbekistanVenezuelaVietnamWest IndiesWestern AfricaWestern AsiaWestern EuropeYemenZaireZimbabwe
Income
Income (Families)
Income (Households)
Poverty
Poverty (Families)
Unemployment
Employment Occupations
Employment Industries
Employer Class
Commute Time
Commute Means
School Enrollment
Education by Degree Field
Occupancy
Finances
Physical Characteristics
Las Vegas
Compare Zip Codes
Comparison Subject

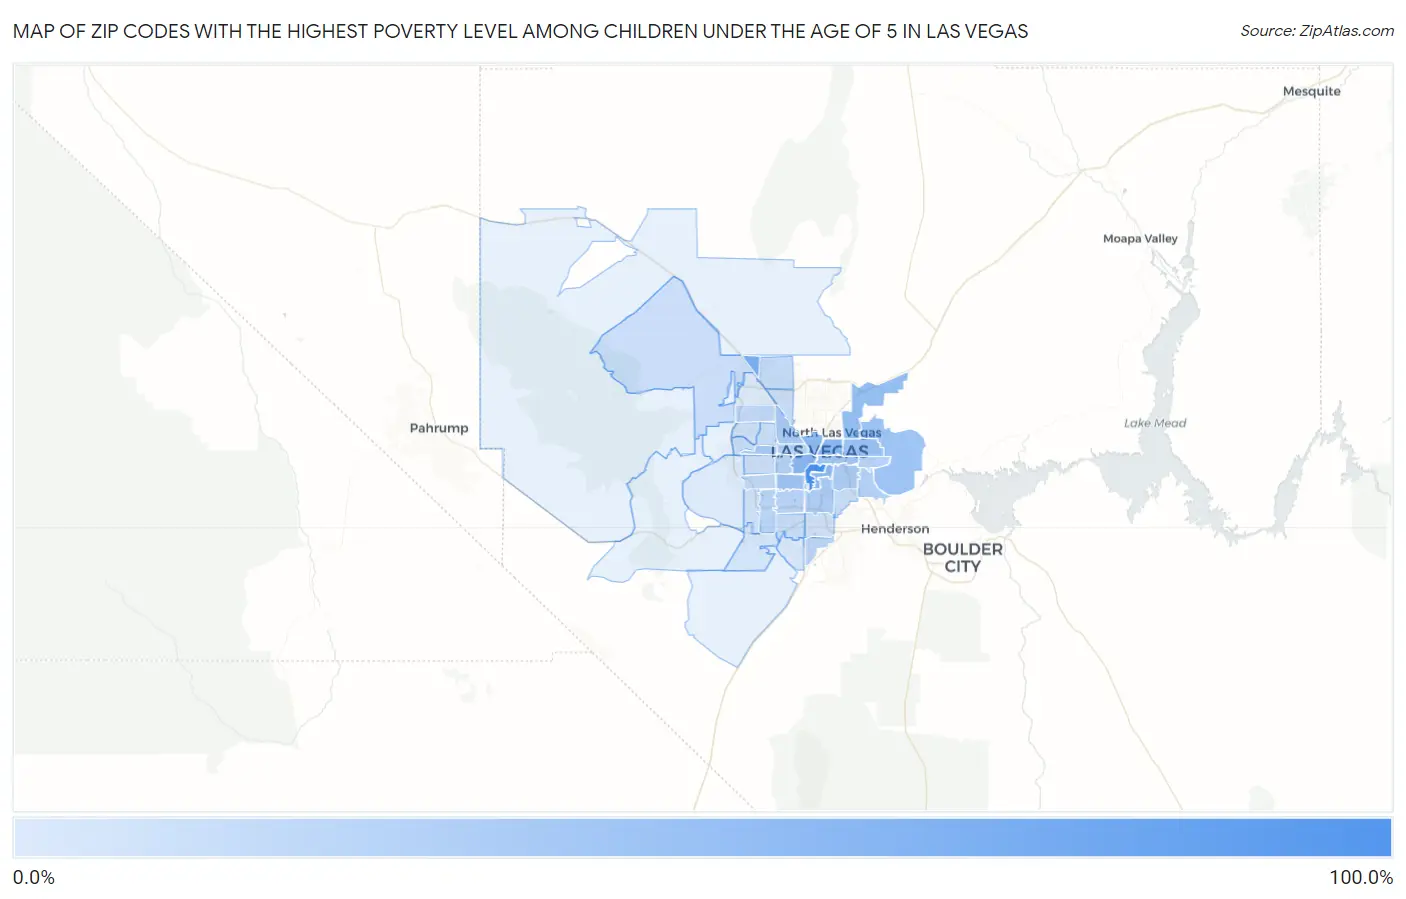
Map of Zip Codes with the Highest Poverty Level Among Children Under the Age of 5 in Las Vegas

0.0%
100.0%
Zip Codes with the Highest Poverty Level Among Children Under the Age of 5 in Las Vegas Map

Zip Codes with the Highest Poverty Level Among Children Under the Age of 5 in Las Vegas, NV

Zip Code Child Poverty vs State vs National
1.8910987.5%18.2%(+69.3)#418.1%(+69.4)#667
2.8914351.9%18.2%(+33.7)#818.1%(+33.9)#2,347
3.8910243.8%18.2%(+25.6)#918.1%(+25.7)#3,365
4.8910142.7%18.2%(+24.5)#1018.1%(+24.6)#3,535
5.8916942.2%18.2%(+24.0)#1118.1%(+24.1)#3,628
6.8910641.6%18.2%(+23.4)#1318.1%(+23.5)#3,734
7.8911538.6%18.2%(+20.4)#1718.1%(+20.5)#4,287
8.8911034.6%18.2%(+16.4)#1918.1%(+16.5)#5,168
9.8915633.8%18.2%(+15.5)#2018.1%(+15.7)#5,358
10.8910333.2%18.2%(+15.0)#2118.1%(+15.1)#5,549
11.8910430.9%18.2%(+12.7)#2218.1%(+12.8)#6,124
12.8910828.1%18.2%(+9.89)#2418.1%(+10.0)#6,948
13.8914527.3%18.2%(+9.12)#2518.1%(+9.26)#7,197
14.8912126.8%18.2%(+8.58)#2618.1%(+8.73)#7,370
15.8911925.7%18.2%(+7.52)#2718.1%(+7.67)#7,730
16.8914622.3%18.2%(+4.10)#3318.1%(+4.25)#9,043
17.8912222.2%18.2%(+4.00)#3418.1%(+4.15)#9,113
18.8914221.0%18.2%(+2.74)#3818.1%(+2.89)#9,616
19.8911320.8%18.2%(+2.62)#3918.1%(+2.77)#9,658
20.8911820.8%18.2%(+2.57)#4018.1%(+2.72)#9,688
21.8910720.1%18.2%(+1.86)#4218.1%(+2.01)#9,987
22.8918319.1%18.2%(+0.937)#4518.1%(+1.09)#10,438
23.8912916.3%18.2%(-1.88)#5318.1%(-1.73)#11,740
24.8914715.9%18.2%(-2.32)#5418.1%(-2.17)#11,973
25.8913114.4%18.2%(-3.79)#5918.1%(-3.64)#12,771
26.8913914.4%18.2%(-3.85)#6018.1%(-3.70)#12,799
27.8914414.3%18.2%(-3.96)#6218.1%(-3.81)#12,908
28.8912013.3%18.2%(-4.95)#6518.1%(-4.80)#13,482
29.8912812.1%18.2%(-6.09)#6918.1%(-5.94)#14,136
30.8913012.0%18.2%(-6.25)#7018.1%(-6.10)#14,239
31.8911711.8%18.2%(-6.44)#7118.1%(-6.29)#14,348
32.8916611.7%18.2%(-6.47)#7218.1%(-6.32)#14,376
33.8913410.8%18.2%(-7.37)#7318.1%(-7.22)#14,930
34.891239.9%18.2%(-8.36)#7418.1%(-8.21)#15,507
35.891489.8%18.2%(-8.46)#7618.1%(-8.31)#15,566
36.891788.7%18.2%(-9.48)#8318.1%(-9.33)#16,245
37.891415.9%18.2%(-12.3)#9618.1%(-12.1)#18,120
38.891494.5%18.2%(-13.8)#9918.1%(-13.6)#19,150
39.891354.4%18.2%(-13.8)#10018.1%(-13.6)#19,170

Common Questions

What are the Top 10 Zip Codes with the Highest Poverty Level Among Children Under the Age of 5 in Las Vegas, NV?
Top 10 Zip Codes with the Highest Poverty Level Among Children Under the Age of 5 in Las Vegas, NV are:
#1
87.5%
#2
51.9%
#3
43.8%
#4
42.7%
#5
42.2%
#6
41.6%
#7
38.6%
#8
34.6%
#9
33.8%
#10
33.2%
What zip code has the Highest Poverty Level Among Children Under the Age of 5 in Las Vegas, NV?
89109 has the Highest Poverty Level Among Children Under the Age of 5 in Las Vegas, NV with 87.5%.
What is the Poverty Level Among Children Under the Age of 5 in Las Vegas, NV?
Poverty Level Among Children Under the Age of 5 in Las Vegas is 24.1%.
What is the Poverty Level Among Children Under the Age of 5 in Nevada?
Poverty Level Among Children Under the Age of 5 in Nevada is 18.2%.
What is the Poverty Level Among Children Under the Age of 5 in the United States?
Poverty Level Among Children Under the Age of 5 in the United States is 18.1%.