Thedford, NE Map & Demographics
Thedford Map
Thedford Overview
$38,947
PER CAPITA INCOME
$72,321
AVG FAMILY INCOME
$71,174
AVG HOUSEHOLD INCOME
42.8%
WAGE / INCOME GAP [ % ]
57.2¢/ $1
WAGE / INCOME GAP [ $ ]
0.22
INEQUALITY / GINI INDEX
198
TOTAL POPULATION
90
MALE POPULATION
108
FEMALE POPULATION
83.33
MALES / 100 FEMALES
120.00
FEMALES / 100 MALES
31.2
MEDIAN AGE
1.8
AVG FAMILY SIZE
1.6
AVG HOUSEHOLD SIZE
148
LABOR FORCE [ PEOPLE ]
79.1%
PERCENT IN LABOR FORCE
2.0%
UNEMPLOYMENT RATE
Thedford Zip Codes
Thedford Area Codes
Income in Thedford
Income Overview in Thedford
Per Capita Income in Thedford is $38,947, while median incomes of families and households are $72,321 and $71,174 respectively.
| Characteristic | Number | Measure |
| Per Capita Income | 198 | $38,947 |
| Median Family Income | 84 | $72,321 |
| Mean Family Income | 84 | $79,574 |
| Median Household Income | 121 | $71,174 |
| Mean Household Income | 121 | $70,074 |
| Income Deficit | 84 | $0 |
| Wage / Income Gap (%) | 198 | 42.79% |
| Wage / Income Gap ($) | 198 | 57.21¢ per $1 |
| Gini / Inequality Index | 198 | 0.22 |
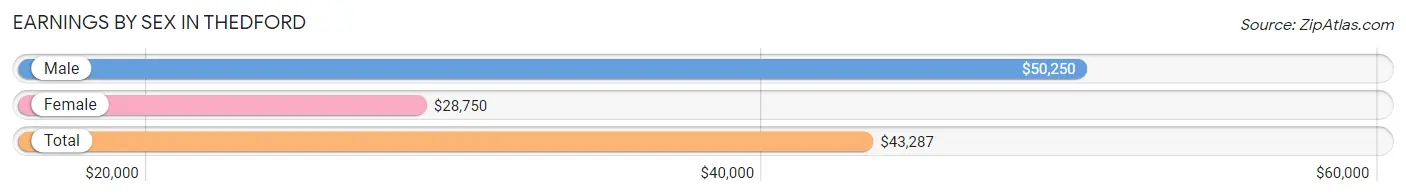
Earnings by Sex in Thedford
Average Earnings in Thedford are $43,287, $50,250 for men and $28,750 for women, a difference of 42.8%.
| Sex | Number | Average Earnings |
| Male | 79 (52.3%) | $50,250 |
| Female | 72 (47.7%) | $28,750 |
| Total | 151 (100.0%) | $43,287 |
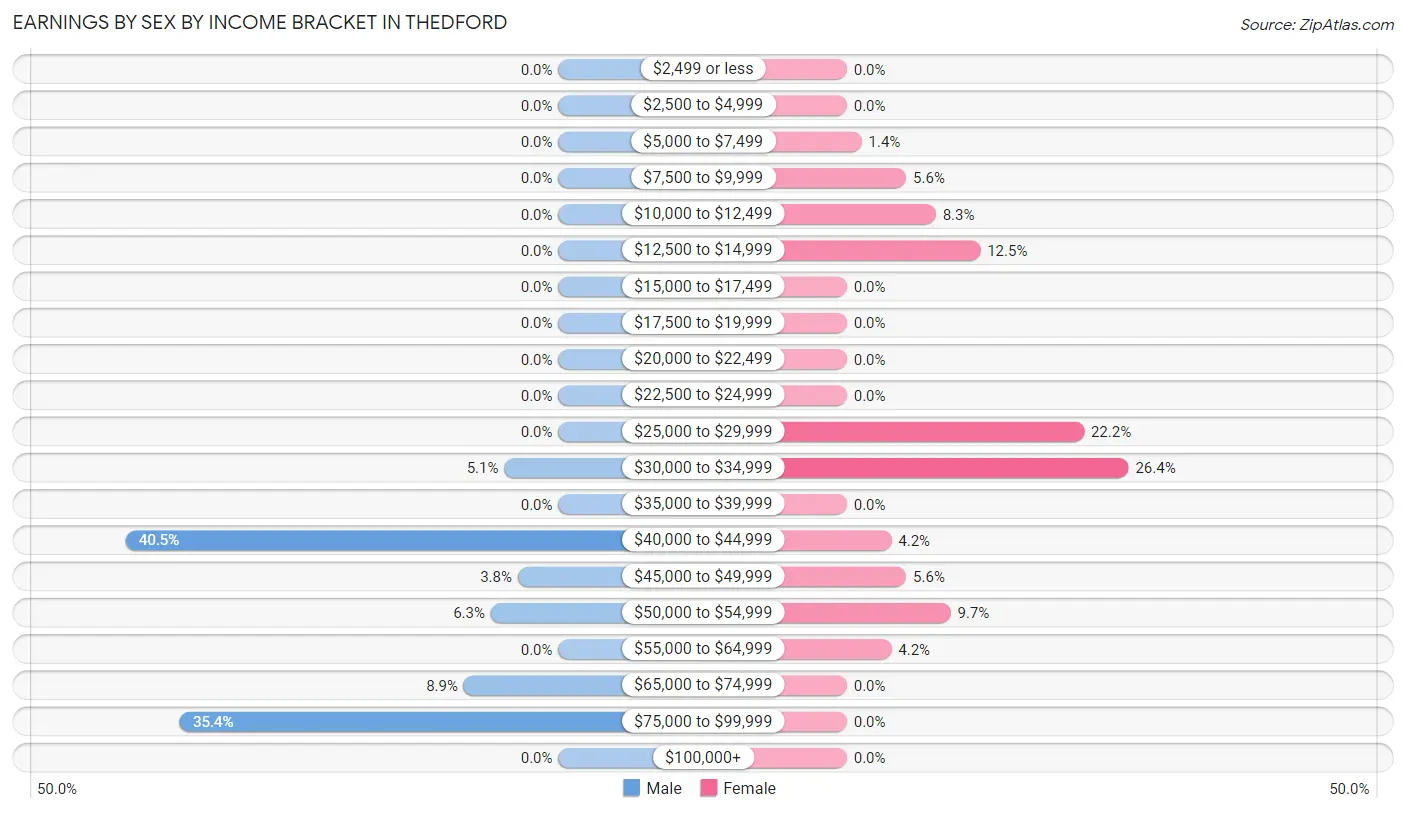
Earnings by Sex by Income Bracket in Thedford
The most common earnings brackets in Thedford are $40,000 to $44,999 for men (32 | 40.5%) and $30,000 to $34,999 for women (19 | 26.4%).
| Income | Male | Female |
| $2,499 or less | 0 (0.0%) | 0 (0.0%) |
| $2,500 to $4,999 | 0 (0.0%) | 0 (0.0%) |
| $5,000 to $7,499 | 0 (0.0%) | 1 (1.4%) |
| $7,500 to $9,999 | 0 (0.0%) | 4 (5.6%) |
| $10,000 to $12,499 | 0 (0.0%) | 6 (8.3%) |
| $12,500 to $14,999 | 0 (0.0%) | 9 (12.5%) |
| $15,000 to $17,499 | 0 (0.0%) | 0 (0.0%) |
| $17,500 to $19,999 | 0 (0.0%) | 0 (0.0%) |
| $20,000 to $22,499 | 0 (0.0%) | 0 (0.0%) |
| $22,500 to $24,999 | 0 (0.0%) | 0 (0.0%) |
| $25,000 to $29,999 | 0 (0.0%) | 16 (22.2%) |
| $30,000 to $34,999 | 4 (5.1%) | 19 (26.4%) |
| $35,000 to $39,999 | 0 (0.0%) | 0 (0.0%) |
| $40,000 to $44,999 | 32 (40.5%) | 3 (4.2%) |
| $45,000 to $49,999 | 3 (3.8%) | 4 (5.6%) |
| $50,000 to $54,999 | 5 (6.3%) | 7 (9.7%) |
| $55,000 to $64,999 | 0 (0.0%) | 3 (4.2%) |
| $65,000 to $74,999 | 7 (8.9%) | 0 (0.0%) |
| $75,000 to $99,999 | 28 (35.4%) | 0 (0.0%) |
| $100,000+ | 0 (0.0%) | 0 (0.0%) |
| Total | 79 (100.0%) | 72 (100.0%) |
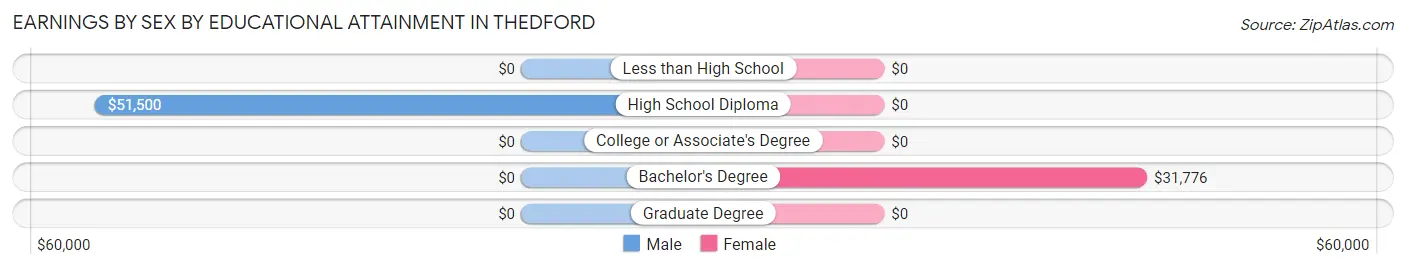
Earnings by Sex by Educational Attainment in Thedford
Average earnings in Thedford are $50,250 for men and $30,066 for women, a difference of 40.2%. Men with an educational attainment of high school diploma enjoy the highest average annual earnings of $51,500, while those with high school diploma education earn the least with $51,500. Women with an educational attainment of bachelor's degree earn the most with the average annual earnings of $31,776, while those with bachelor's degree education have the smallest earnings of $31,776.
| Educational Attainment | Male Income | Female Income |
| Less than High School | - | - |
| High School Diploma | $51,500 | $0 |
| College or Associate's Degree | - | - |
| Bachelor's Degree | - | - |
| Graduate Degree | - | - |
| Total | $50,250 | $30,066 |
Family Income in Thedford
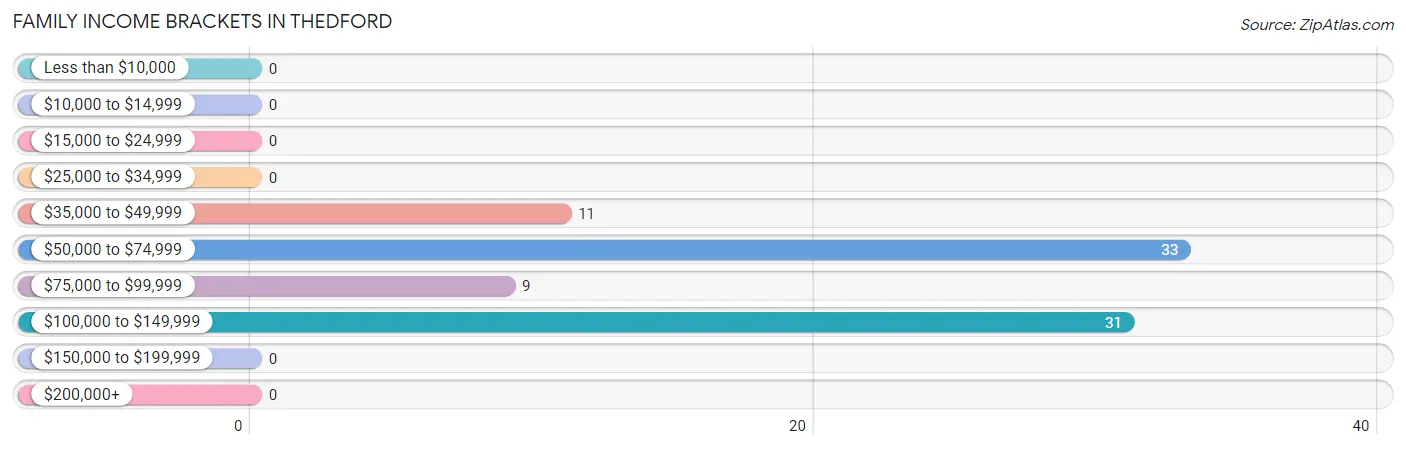
Family Income Brackets in Thedford
According to the Thedford family income data, there are 33 families falling into the $50,000 to $74,999 income range, which is the most common income bracket and makes up 39.3% of all families.
| Income Bracket | # Families | % Families |
| Less than $10,000 | 0 | 0.0% |
| $10,000 to $14,999 | 0 | 0.0% |
| $15,000 to $24,999 | 0 | 0.0% |
| $25,000 to $34,999 | 0 | 0.0% |
| $35,000 to $49,999 | 11 | 13.1% |
| $50,000 to $74,999 | 33 | 39.3% |
| $75,000 to $99,999 | 9 | 10.7% |
| $100,000 to $149,999 | 31 | 36.9% |
| $150,000 to $199,999 | 0 | 0.0% |
| $200,000+ | 0 | 0.0% |
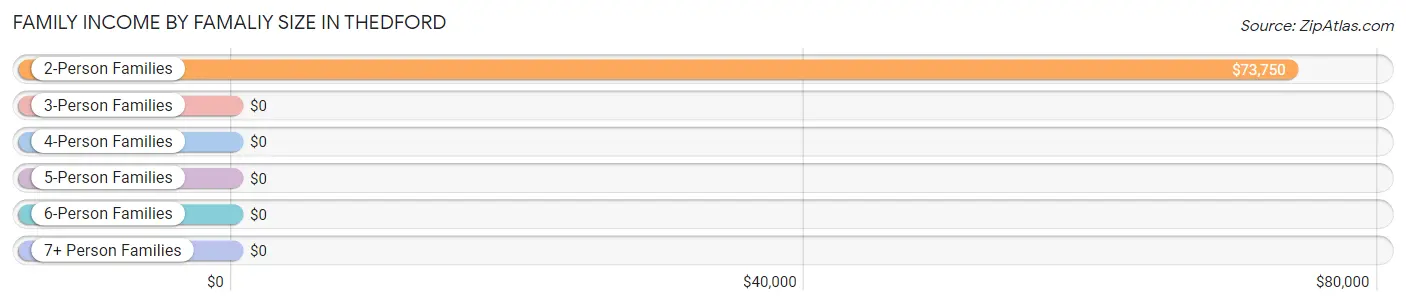
Family Income by Famaliy Size in Thedford
2-person families (80 | 95.2%) account for the highest median family income in Thedford with $73,750 per family, while 2-person families (80 | 95.2%) have the highest median income of $36,875 per family member.
| Income Bracket | # Families | Median Income |
| 2-Person Families | 80 (95.2%) | $73,750 |
| 3-Person Families | 4 (4.8%) | $0 |
| 4-Person Families | 0 (0.0%) | $0 |
| 5-Person Families | 0 (0.0%) | $0 |
| 6-Person Families | 0 (0.0%) | $0 |
| 7+ Person Families | 0 (0.0%) | $0 |
| Total | 84 (100.0%) | $72,321 |
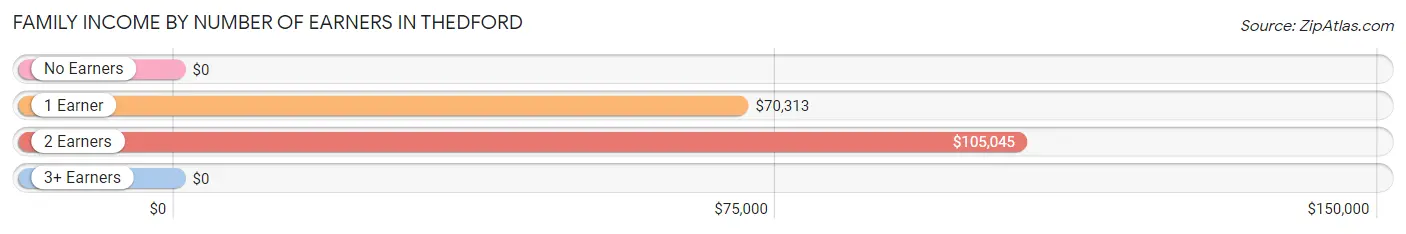
Family Income by Number of Earners in Thedford
| Number of Earners | # Families | Median Income |
| No Earners | 10 (11.9%) | $0 |
| 1 Earner | 13 (15.5%) | $70,313 |
| 2 Earners | 61 (72.6%) | $105,045 |
| 3+ Earners | 0 (0.0%) | $0 |
| Total | 84 (100.0%) | $72,321 |
Household Income in Thedford
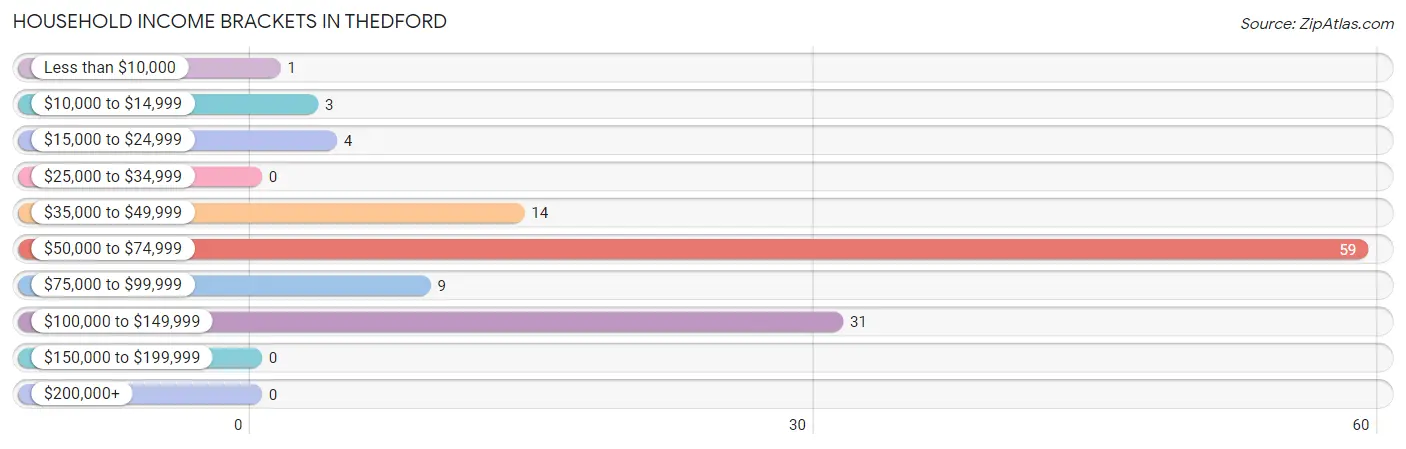
Household Income Brackets in Thedford
With 59 households falling in the category, the $50,000 to $74,999 income range is the most frequent in Thedford, accounting for 48.8% of all households.
| Income Bracket | # Households | % Households |
| Less than $10,000 | 1 | 0.8% |
| $10,000 to $14,999 | 3 | 2.5% |
| $15,000 to $24,999 | 4 | 3.3% |
| $25,000 to $34,999 | 0 | 0.0% |
| $35,000 to $49,999 | 14 | 11.6% |
| $50,000 to $74,999 | 59 | 48.8% |
| $75,000 to $99,999 | 9 | 7.4% |
| $100,000 to $149,999 | 31 | 25.6% |
| $150,000 to $199,999 | 0 | 0.0% |
| $200,000+ | 0 | 0.0% |
Household Income by Householder Age in Thedford
The median household income in Thedford is $71,174, with the highest median household income of $71,458 found in the 25 to 44 years age bracket for the primary householder. A total of 76 households (62.8%) fall into this category. Meanwhile, the 15 to 24 years age bracket for the primary householder has the lowest median household income of $0, with 1 households (0.8%) in this group.
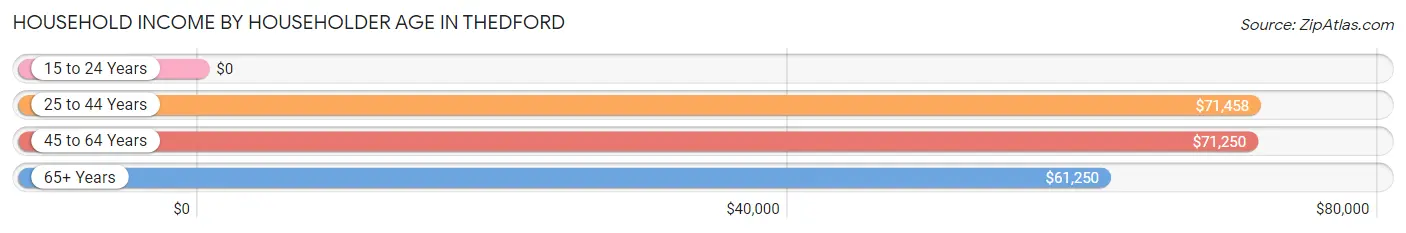
| Income Bracket | # Households | Median Income |
| 15 to 24 Years | 1 (0.8%) | $0 |
| 25 to 44 Years | 76 (62.8%) | $71,458 |
| 45 to 64 Years | 16 (13.2%) | $71,250 |
| 65+ Years | 28 (23.1%) | $61,250 |
| Total | 121 (100.0%) | $71,174 |
Poverty in Thedford
Income Below Poverty by Sex and Age in Thedford
With 2.2% poverty level for males and 7.4% for females among the residents of Thedford, 18 to 24 year old males and 18 to 24 year old females are the most vulnerable to poverty, with 2 males (100.0%) and 1 females (100.0%) in their respective age groups living below the poverty level.
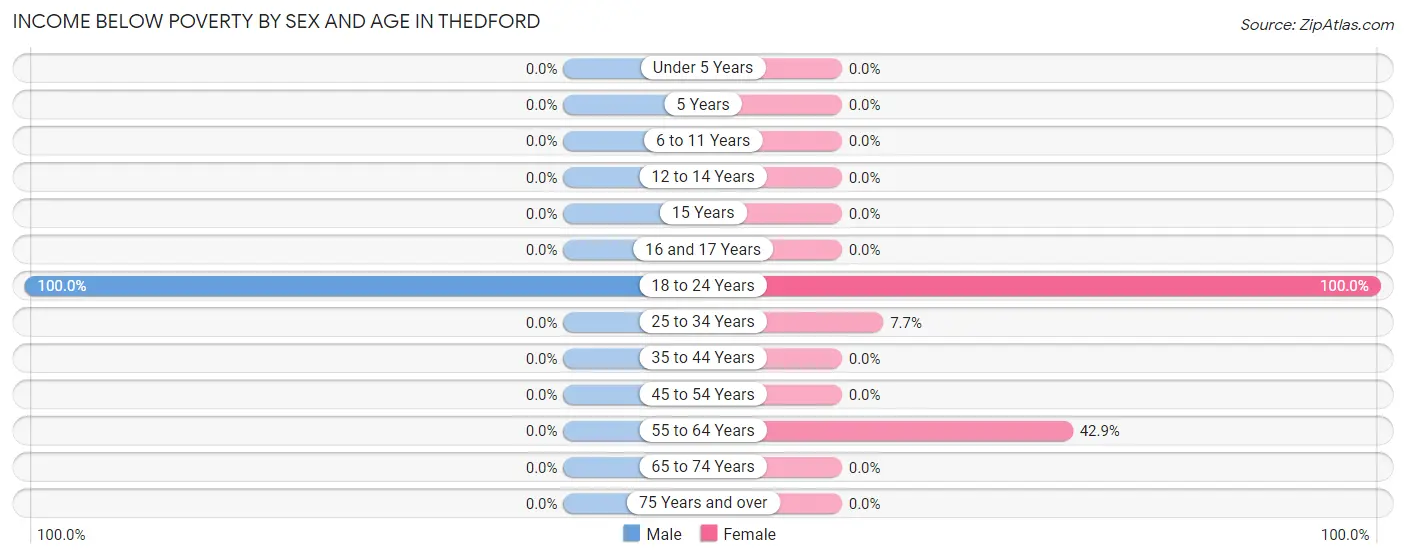
| Age Bracket | Male | Female |
| Under 5 Years | 0 (0.0%) | 0 (0.0%) |
| 5 Years | 0 (0.0%) | 0 (0.0%) |
| 6 to 11 Years | 0 (0.0%) | 0 (0.0%) |
| 12 to 14 Years | 0 (0.0%) | 0 (0.0%) |
| 15 Years | 0 (0.0%) | 0 (0.0%) |
| 16 and 17 Years | 0 (0.0%) | 0 (0.0%) |
| 18 to 24 Years | 2 (100.0%) | 1 (100.0%) |
| 25 to 34 Years | 0 (0.0%) | 4 (7.7%) |
| 35 to 44 Years | 0 (0.0%) | 0 (0.0%) |
| 45 to 54 Years | 0 (0.0%) | 0 (0.0%) |
| 55 to 64 Years | 0 (0.0%) | 3 (42.9%) |
| 65 to 74 Years | 0 (0.0%) | 0 (0.0%) |
| 75 Years and over | 0 (0.0%) | 0 (0.0%) |
| Total | 2 (2.2%) | 8 (7.4%) |
Income Above Poverty by Sex and Age in Thedford
According to the poverty statistics in Thedford, males aged 25 to 34 years and females aged 6 to 11 years are the age groups that are most secure financially, with 100.0% of males and 100.0% of females in these age groups living above the poverty line.
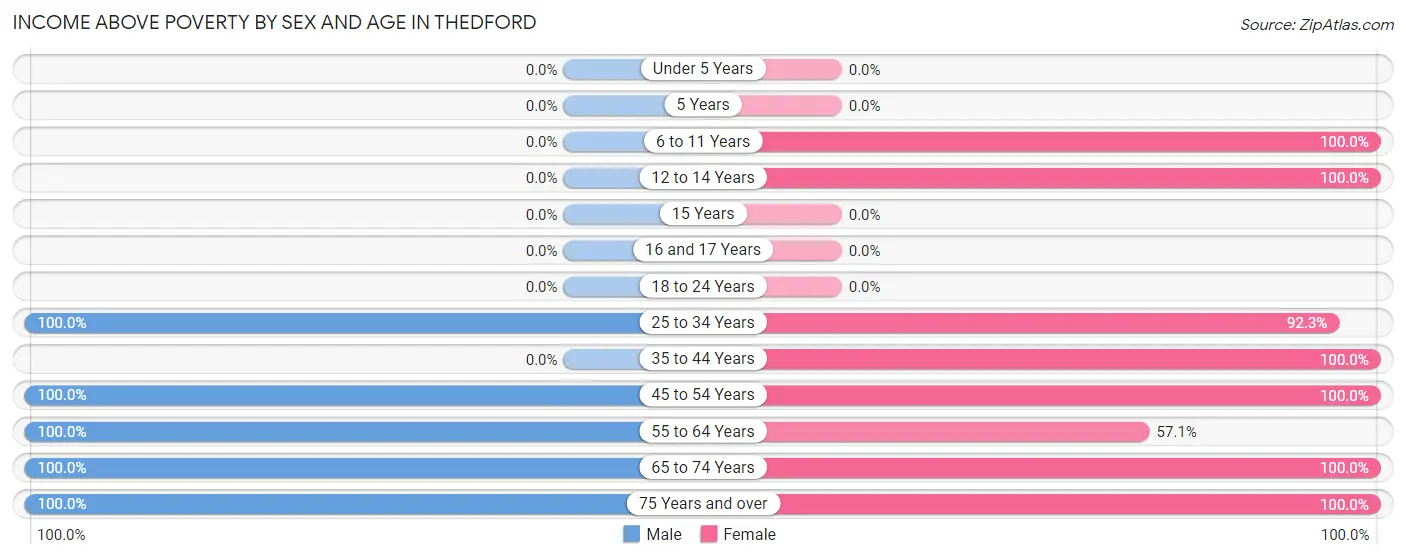
| Age Bracket | Male | Female |
| Under 5 Years | 0 (0.0%) | 0 (0.0%) |
| 5 Years | 0 (0.0%) | 0 (0.0%) |
| 6 to 11 Years | 0 (0.0%) | 5 (100.0%) |
| 12 to 14 Years | 0 (0.0%) | 6 (100.0%) |
| 15 Years | 0 (0.0%) | 0 (0.0%) |
| 16 and 17 Years | 0 (0.0%) | 0 (0.0%) |
| 18 to 24 Years | 0 (0.0%) | 0 (0.0%) |
| 25 to 34 Years | 59 (100.0%) | 48 (92.3%) |
| 35 to 44 Years | 0 (0.0%) | 7 (100.0%) |
| 45 to 54 Years | 3 (100.0%) | 7 (100.0%) |
| 55 to 64 Years | 4 (100.0%) | 4 (57.1%) |
| 65 to 74 Years | 17 (100.0%) | 14 (100.0%) |
| 75 Years and over | 5 (100.0%) | 9 (100.0%) |
| Total | 88 (97.8%) | 100 (92.6%) |
Income Below Poverty Among Married-Couple Families in Thedford
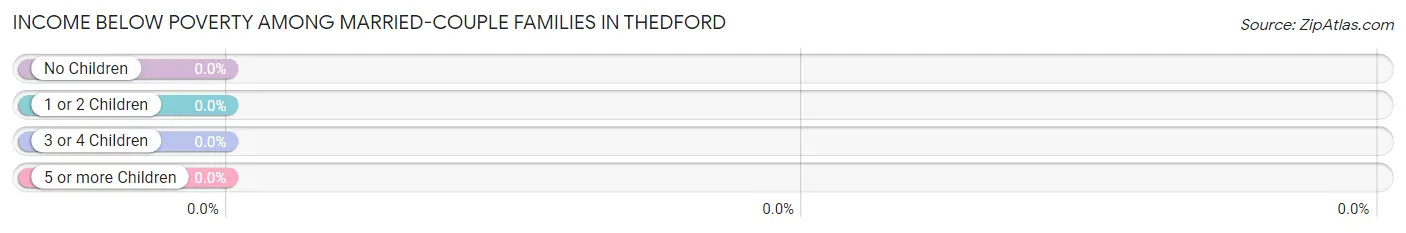
| Children | Above Poverty | Below Poverty |
| No Children | 74 (100.0%) | 0 (0.0%) |
| 1 or 2 Children | 0 (0.0%) | 0 (0.0%) |
| 3 or 4 Children | 0 (0.0%) | 0 (0.0%) |
| 5 or more Children | 0 (0.0%) | 0 (0.0%) |
| Total | 74 (100.0%) | 0 (0.0%) |
Income Below Poverty Among Single-Parent Households in Thedford
| Children | Single Father | Single Mother |
| No Children | 0 (0.0%) | 0 (0.0%) |
| 1 or 2 Children | 0 (0.0%) | 0 (0.0%) |
| 3 or 4 Children | 0 (0.0%) | 0 (0.0%) |
| 5 or more Children | 0 (0.0%) | 0 (0.0%) |
| Total | 0 (0.0%) | 0 (0.0%) |
Income Below Poverty Among Married-Couple vs Single-Parent Households in Thedford
| Children | Married-Couple Families | Single-Parent Households |
| No Children | 0 (0.0%) | 0 (0.0%) |
| 1 or 2 Children | 0 (0.0%) | 0 (0.0%) |
| 3 or 4 Children | 0 (0.0%) | 0 (0.0%) |
| 5 or more Children | 0 (0.0%) | 0 (0.0%) |
| Total | 0 (0.0%) | 0 (0.0%) |
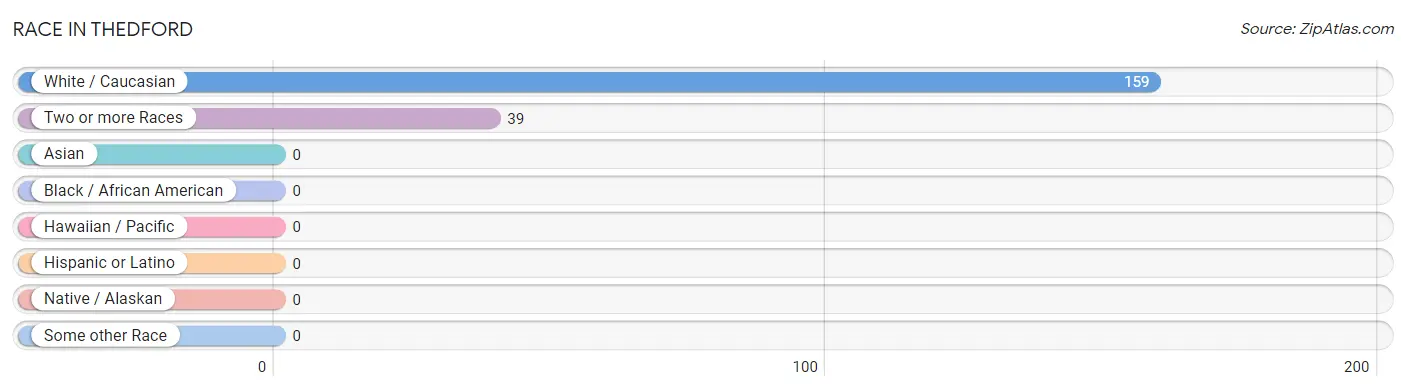
Race in Thedford
The most populous races in Thedford are White / Caucasian (159 | 80.3%), and Two or more Races (39 | 19.7%).
| Race | # Population | % Population |
| Asian | 0 | 0.0% |
| Black / African American | 0 | 0.0% |
| Hawaiian / Pacific | 0 | 0.0% |
| Hispanic or Latino | 0 | 0.0% |
| Native / Alaskan | 0 | 0.0% |
| White / Caucasian | 159 | 80.3% |
| Two or more Races | 39 | 19.7% |
| Some other Race | 0 | 0.0% |
| Total | 198 | 100.0% |
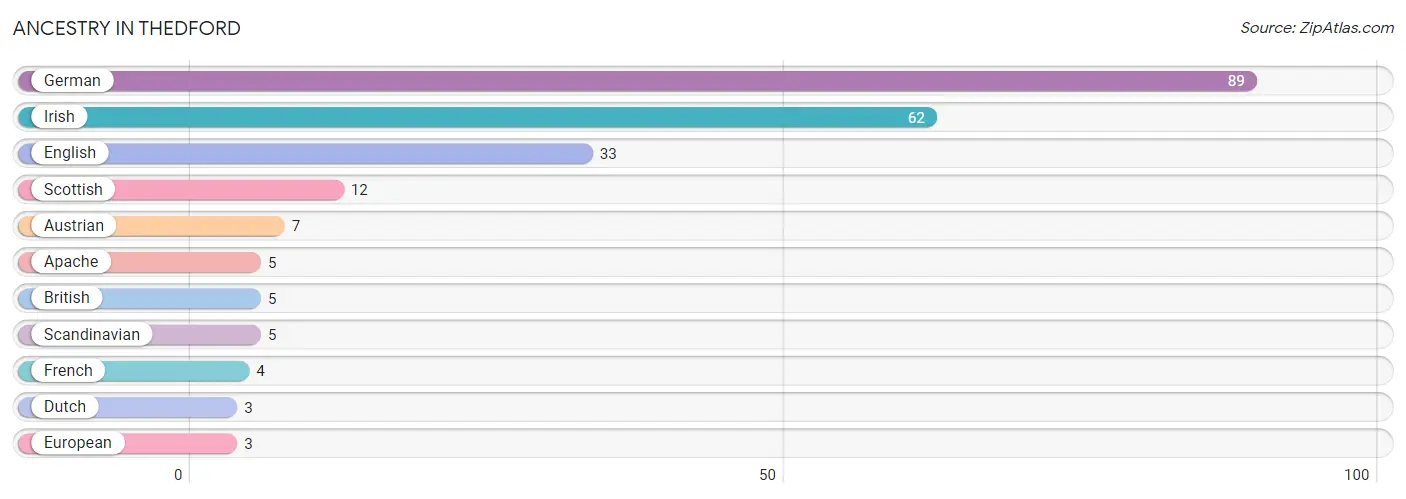
Ancestry in Thedford
The most populous ancestries reported in Thedford are German (89 | 45.0%), Irish (62 | 31.3%), English (33 | 16.7%), Scottish (12 | 6.1%), and Austrian (7 | 3.5%), together accounting for 102.5% of all Thedford residents.
| Ancestry | # Population | % Population |
| Apache | 5 | 2.5% |
| Austrian | 7 | 3.5% |
| British | 5 | 2.5% |
| Dutch | 3 | 1.5% |
| English | 33 | 16.7% |
| European | 3 | 1.5% |
| French | 4 | 2.0% |
| German | 89 | 45.0% |
| Irish | 62 | 31.3% |
| Scandinavian | 5 | 2.5% |
| Scottish | 12 | 6.1% | View All 11 Rows |
Immigrants in Thedford

| Immigration Origin | # Population | % Population | View All 0 Rows |
Sex and Age in Thedford
Sex and Age in Thedford
The most populous age groups in Thedford are 30 to 34 Years (56 | 62.2%) for men and 25 to 29 Years (30 | 27.8%) for women.
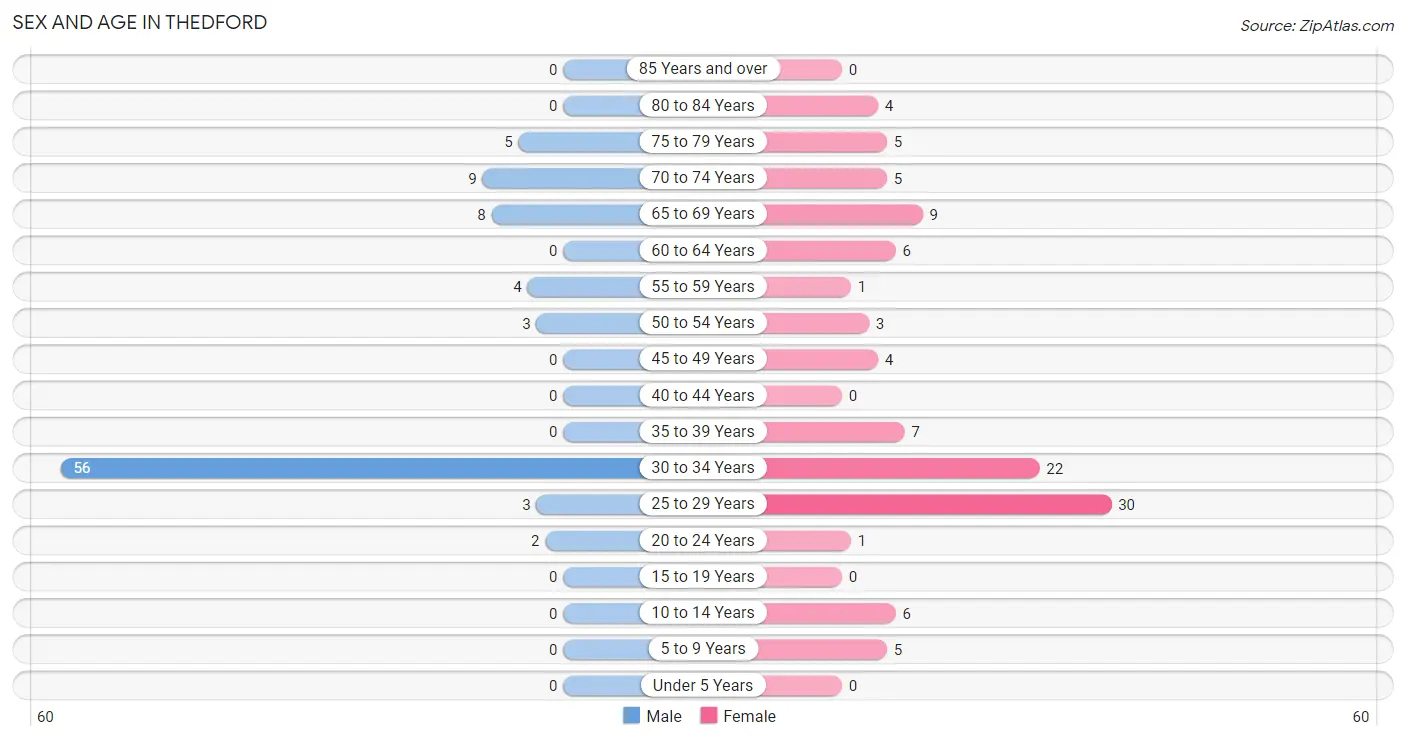
| Age Bracket | Male | Female |
| Under 5 Years | 0 (0.0%) | 0 (0.0%) |
| 5 to 9 Years | 0 (0.0%) | 5 (4.6%) |
| 10 to 14 Years | 0 (0.0%) | 6 (5.6%) |
| 15 to 19 Years | 0 (0.0%) | 0 (0.0%) |
| 20 to 24 Years | 2 (2.2%) | 1 (0.9%) |
| 25 to 29 Years | 3 (3.3%) | 30 (27.8%) |
| 30 to 34 Years | 56 (62.2%) | 22 (20.4%) |
| 35 to 39 Years | 0 (0.0%) | 7 (6.5%) |
| 40 to 44 Years | 0 (0.0%) | 0 (0.0%) |
| 45 to 49 Years | 0 (0.0%) | 4 (3.7%) |
| 50 to 54 Years | 3 (3.3%) | 3 (2.8%) |
| 55 to 59 Years | 4 (4.4%) | 1 (0.9%) |
| 60 to 64 Years | 0 (0.0%) | 6 (5.6%) |
| 65 to 69 Years | 8 (8.9%) | 9 (8.3%) |
| 70 to 74 Years | 9 (10.0%) | 5 (4.6%) |
| 75 to 79 Years | 5 (5.6%) | 5 (4.6%) |
| 80 to 84 Years | 0 (0.0%) | 4 (3.7%) |
| 85 Years and over | 0 (0.0%) | 0 (0.0%) |
| Total | 90 (100.0%) | 108 (100.0%) |
Families and Households in Thedford
Median Family Size in Thedford
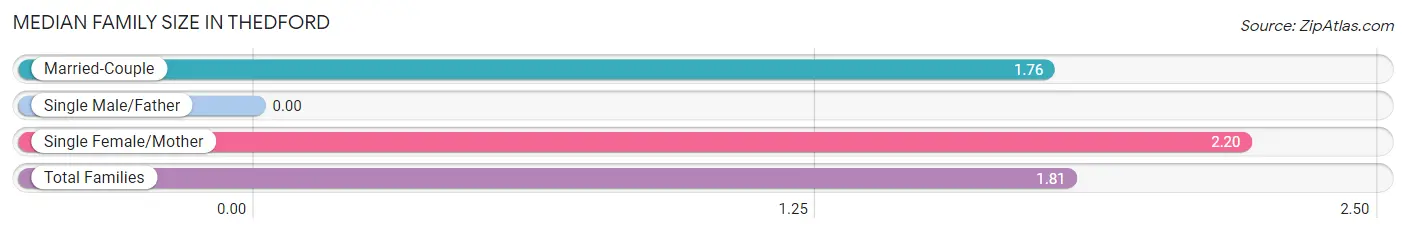
| Family Type | # Families | Family Size |
| Married-Couple | 74 (88.1%) | 1.76 |
| Single Male/Father | 0 (0.0%) | - |
| Single Female/Mother | 10 (11.9%) | 2.20 |
| Total Families | 84 (100.0%) | 1.81 |
Median Household Size in Thedford
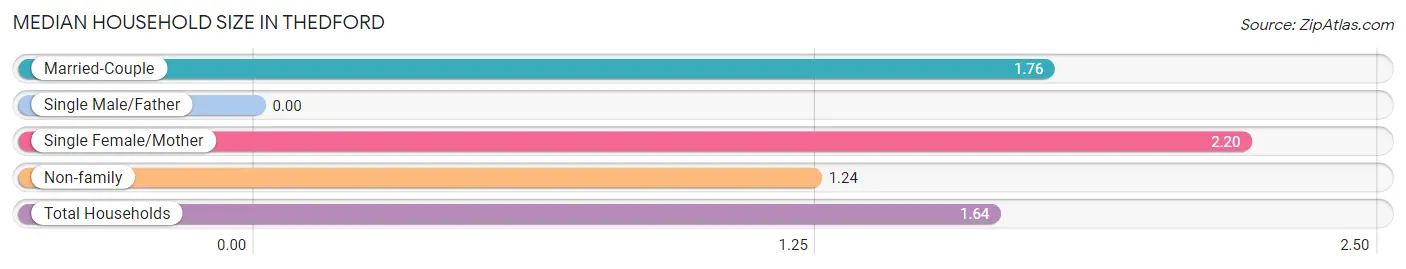
| Household Type | # Households | Household Size |
| Married-Couple | 74 (61.2%) | 1.76 |
| Single Male/Father | 0 (0.0%) | - |
| Single Female/Mother | 10 (8.3%) | 2.20 |
| Non-family | 37 (30.6%) | 1.24 |
| Total Households | 121 (100.0%) | 1.64 |
Household Size by Marriage Status in Thedford
Out of a total of 121 households in Thedford, 84 (69.4%) are family households, while 37 (30.6%) are nonfamily households. The most numerous type of family households are 2-person households, comprising 80, and the most common type of nonfamily households are 1-person households, comprising 25.
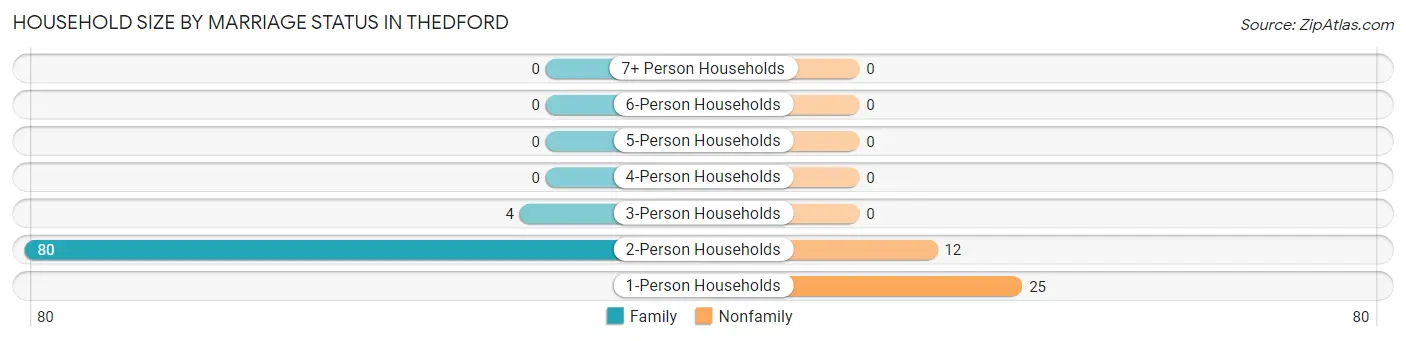
| Household Size | Family Households | Nonfamily Households |
| 1-Person Households | - | 25 (20.7%) |
| 2-Person Households | 80 (66.1%) | 12 (9.9%) |
| 3-Person Households | 4 (3.3%) | 0 (0.0%) |
| 4-Person Households | 0 (0.0%) | 0 (0.0%) |
| 5-Person Households | 0 (0.0%) | 0 (0.0%) |
| 6-Person Households | 0 (0.0%) | 0 (0.0%) |
| 7+ Person Households | 0 (0.0%) | 0 (0.0%) |
| Total | 84 (69.4%) | 37 (30.6%) |
Female Fertility in Thedford
Fertility by Age in Thedford
| Age Bracket | Women with Births | Births / 1,000 Women |
| 15 to 19 years | 0 (0.0%) | 0.0 |
| 20 to 34 years | 0 (0.0%) | 0.0 |
| 35 to 50 years | 0 (0.0%) | 0.0 |
| Total | 0 (0.0%) | 0.0 |
Fertility by Age by Marriage Status in Thedford
| Age Bracket | Married | Unmarried |
| 15 to 19 years | 0 (0.0%) | 0 (0.0%) |
| 20 to 34 years | 0 (0.0%) | 0 (0.0%) |
| 35 to 50 years | 0 (0.0%) | 0 (0.0%) |
| Total | 0 (0.0%) | 0 (0.0%) |
Fertility by Education in Thedford
| Educational Attainment | Women with Births | Births / 1,000 Women |
| Less than High School | 0 (0.0%) | 0.0 |
| High School Diploma | 0 (0.0%) | 0.0 |
| College or Associate's Degree | 0 (0.0%) | 0.0 |
| Bachelor's Degree | 0 (0.0%) | 0.0 |
| Graduate Degree | 0 (0.0%) | 0.0 |
| Total | 0 (0.0%) | 0.0 |
Fertility by Education by Marriage Status in Thedford
| Educational Attainment | Married | Unmarried |
| Less than High School | 0 (0.0%) | 0 (0.0%) |
| High School Diploma | 0 (0.0%) | 0 (0.0%) |
| College or Associate's Degree | 0 (0.0%) | 0 (0.0%) |
| Bachelor's Degree | 0 (0.0%) | 0 (0.0%) |
| Graduate Degree | 0 (0.0%) | 0 (0.0%) |
| Total | 0 (0.0%) | 0 (0.0%) |
Employment Characteristics in Thedford
Employment by Class of Employer in Thedford
Among the 145 employed individuals in Thedford, private company employees (88 | 60.7%), not-for-profit organizations (30 | 20.7%), and local government employees (17 | 11.7%) make up the most common classes of employment.
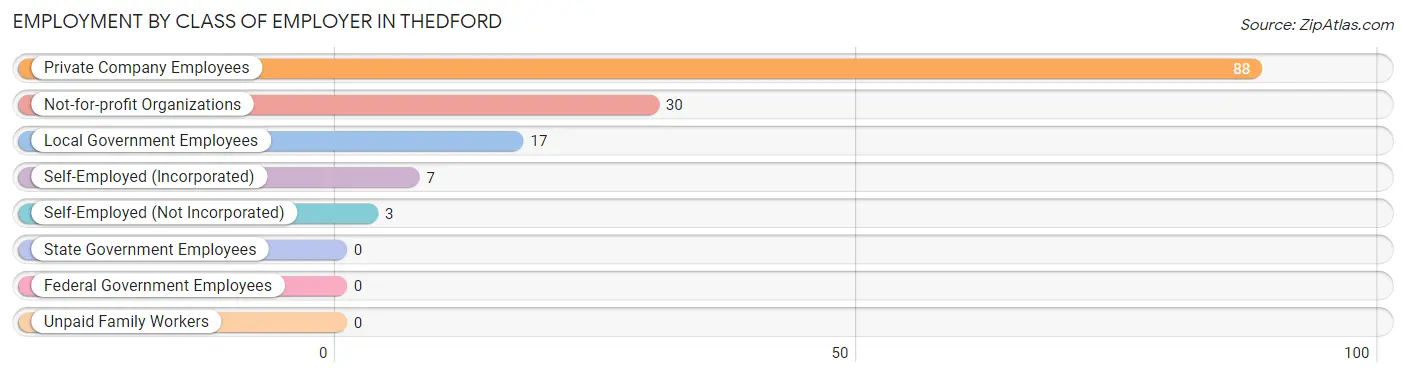
| Employer Class | # Employees | % Employees |
| Private Company Employees | 88 | 60.7% |
| Self-Employed (Incorporated) | 7 | 4.8% |
| Self-Employed (Not Incorporated) | 3 | 2.1% |
| Not-for-profit Organizations | 30 | 20.7% |
| Local Government Employees | 17 | 11.7% |
| State Government Employees | 0 | 0.0% |
| Federal Government Employees | 0 | 0.0% |
| Unpaid Family Workers | 0 | 0.0% |
| Total | 145 | 100.0% |
Employment Status by Age in Thedford
According to the labor force statistics for Thedford, out of the total population over 16 years of age (187), 79.1% or 148 individuals are in the labor force, with 2.0% or 3 of them unemployed. The age group with the highest labor force participation rate is 30 to 34 years, with 100.0% or 78 individuals in the labor force. Within the labor force, the 65 to 74 years age range has the highest percentage of unemployed individuals, with 17.6% or 3 of them being unemployed.
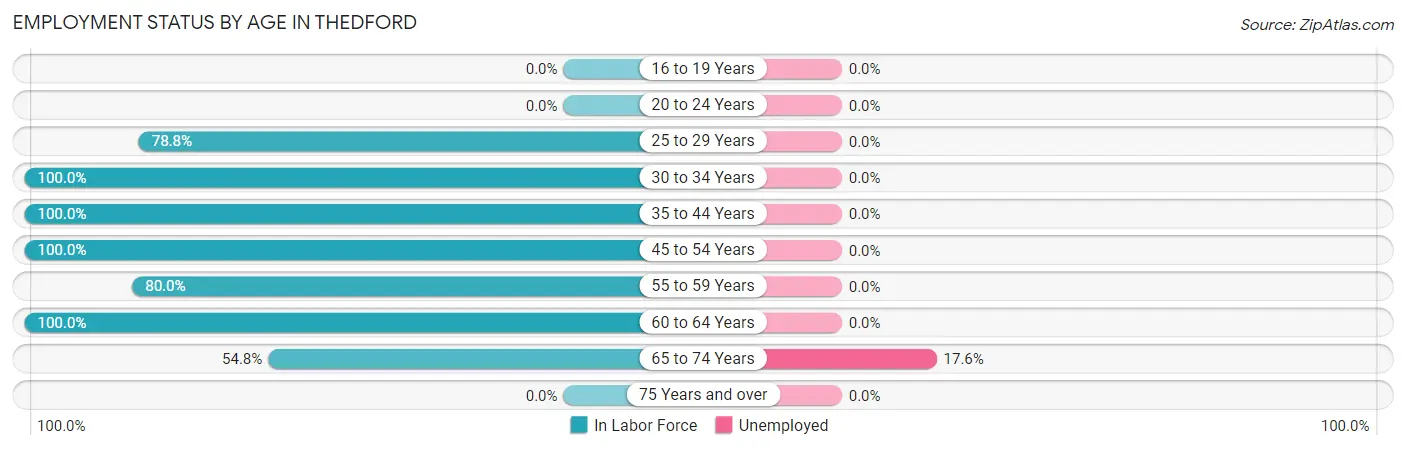
| Age Bracket | In Labor Force | Unemployed |
| 16 to 19 Years | 0 (0.0%) | 0 (0.0%) |
| 20 to 24 Years | 0 (0.0%) | 0 (0.0%) |
| 25 to 29 Years | 26 (78.8%) | 0 (0.0%) |
| 30 to 34 Years | 78 (100.0%) | 0 (0.0%) |
| 35 to 44 Years | 7 (100.0%) | 0 (0.0%) |
| 45 to 54 Years | 10 (100.0%) | 0 (0.0%) |
| 55 to 59 Years | 4 (80.0%) | 0 (0.0%) |
| 60 to 64 Years | 6 (100.0%) | 0 (0.0%) |
| 65 to 74 Years | 17 (54.8%) | 3 (17.6%) |
| 75 Years and over | 0 (0.0%) | 0 (0.0%) |
| Total | 148 (79.1%) | 3 (2.0%) |
Employment Status by Educational Attainment in Thedford
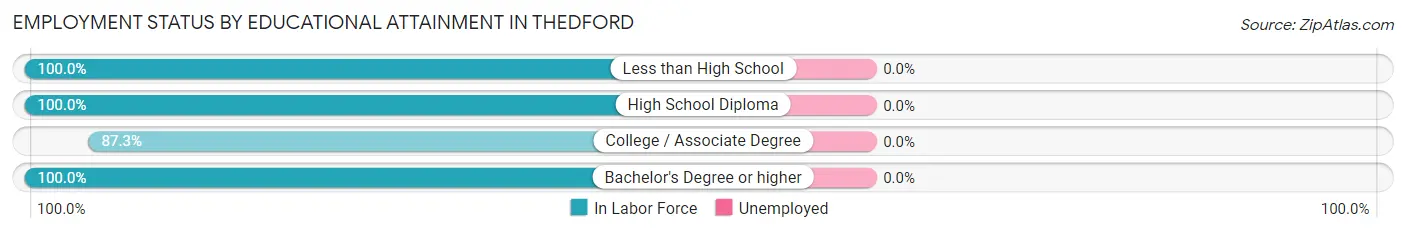
| Educational Attainment | In Labor Force | Unemployed |
| Less than High School | 14 (100.0%) | 0 (0.0%) |
| High School Diploma | 26 (100.0%) | 0 (0.0%) |
| College / Associate Degree | 55 (87.3%) | 0 (0.0%) |
| Bachelor's Degree or higher | 36 (100.0%) | 0 (0.0%) |
| Total | 131 (94.2%) | 0 (0.0%) |
Employment Occupations by Sex in Thedford
Management, Business, Science and Arts Occupations
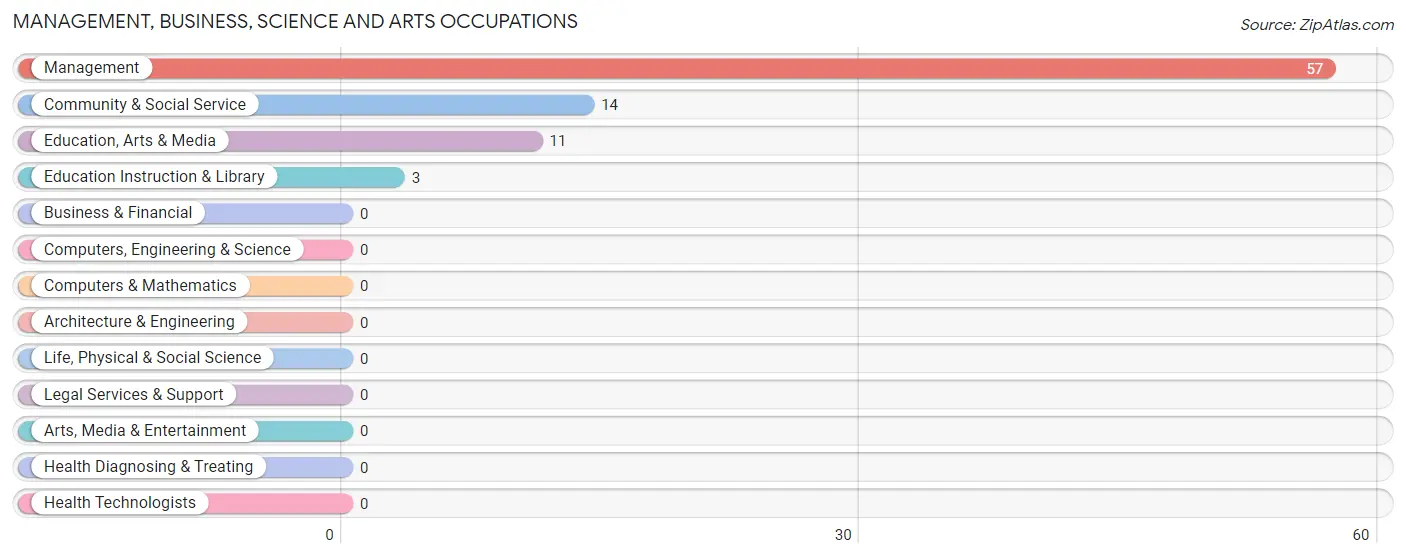
The most common Management, Business, Science and Arts occupations in Thedford are Management (57 | 39.3%), Community & Social Service (14 | 9.7%), Education, Arts & Media (11 | 7.6%), and Education Instruction & Library (3 | 2.1%).
Management, Business, Science and Arts Occupations by Sex
Within the Management, Business, Science and Arts occupations in Thedford, the most male-oriented occupations are Education Instruction & Library (100.0%), Community & Social Service (57.1%), and Education, Arts & Media (45.5%), while the most female-oriented occupations are Management (57.9%), Education, Arts & Media (54.5%), and Community & Social Service (42.9%).
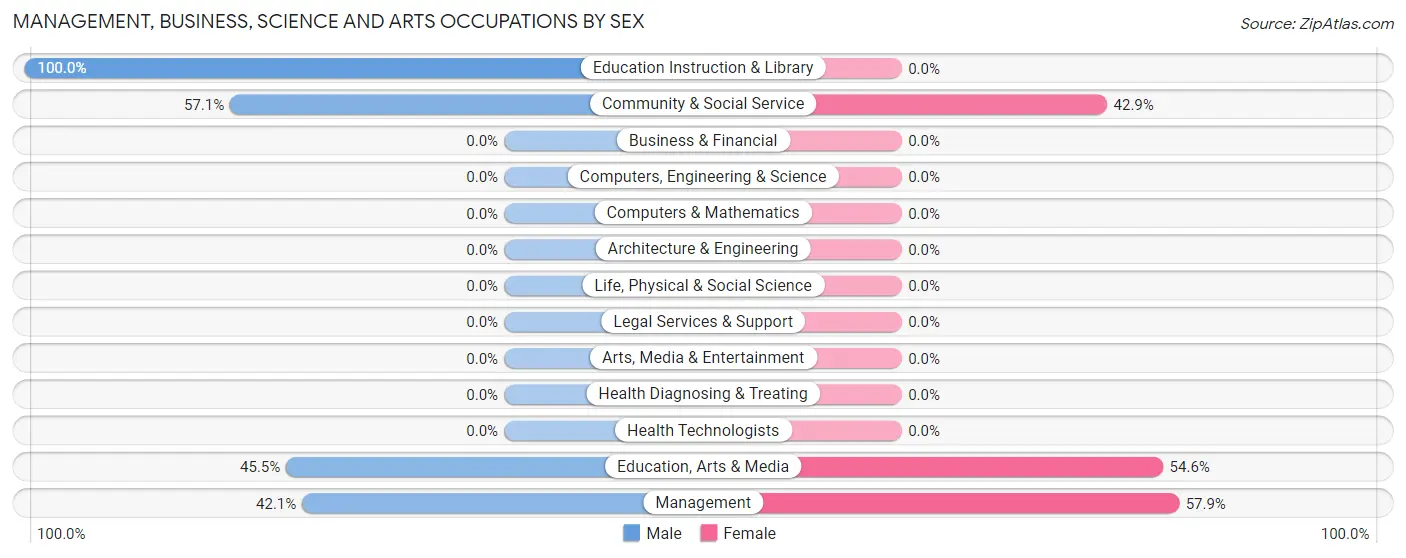
| Occupation | Male | Female |
| Management | 24 (42.1%) | 33 (57.9%) |
| Business & Financial | 0 (0.0%) | 0 (0.0%) |
| Computers, Engineering & Science | 0 (0.0%) | 0 (0.0%) |
| Computers & Mathematics | 0 (0.0%) | 0 (0.0%) |
| Architecture & Engineering | 0 (0.0%) | 0 (0.0%) |
| Life, Physical & Social Science | 0 (0.0%) | 0 (0.0%) |
| Community & Social Service | 8 (57.1%) | 6 (42.9%) |
| Education, Arts & Media | 5 (45.5%) | 6 (54.5%) |
| Legal Services & Support | 0 (0.0%) | 0 (0.0%) |
| Education Instruction & Library | 3 (100.0%) | 0 (0.0%) |
| Arts, Media & Entertainment | 0 (0.0%) | 0 (0.0%) |
| Health Diagnosing & Treating | 0 (0.0%) | 0 (0.0%) |
| Health Technologists | 0 (0.0%) | 0 (0.0%) |
| Total (Category) | 32 (45.1%) | 39 (54.9%) |
| Total (Overall) | 74 (51.0%) | 71 (49.0%) |
Services Occupations
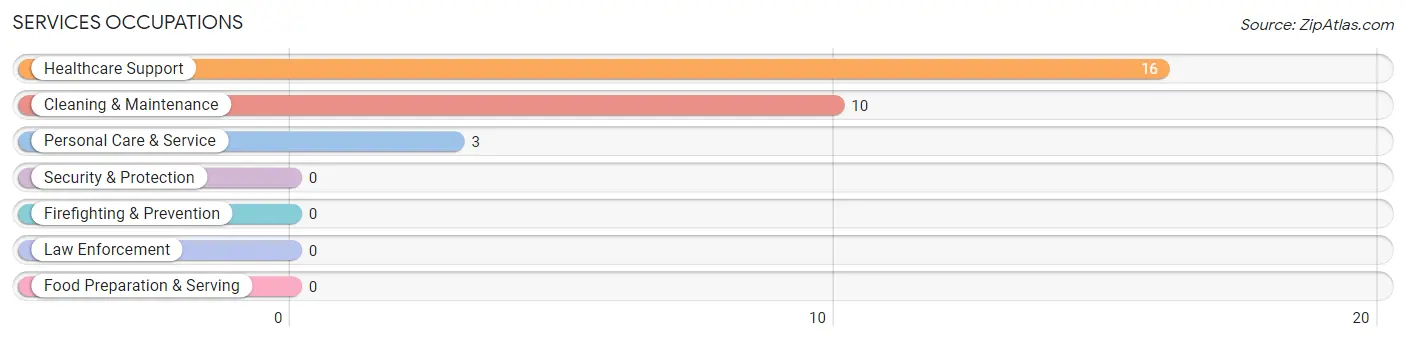
The most common Services occupations in Thedford are Healthcare Support (16 | 11.0%), Cleaning & Maintenance (10 | 6.9%), and Personal Care & Service (3 | 2.1%).
Services Occupations by Sex
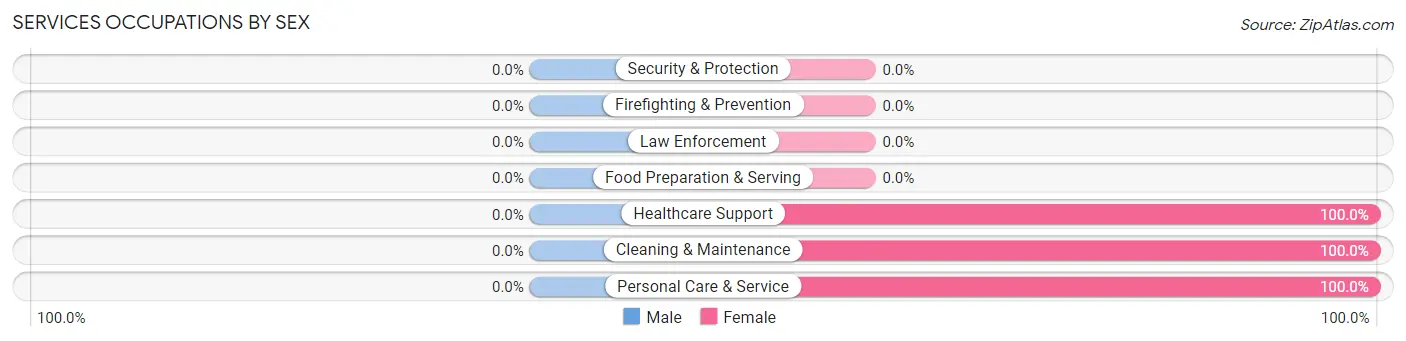
| Occupation | Male | Female |
| Healthcare Support | 0 (0.0%) | 16 (100.0%) |
| Security & Protection | 0 (0.0%) | 0 (0.0%) |
| Firefighting & Prevention | 0 (0.0%) | 0 (0.0%) |
| Law Enforcement | 0 (0.0%) | 0 (0.0%) |
| Food Preparation & Serving | 0 (0.0%) | 0 (0.0%) |
| Cleaning & Maintenance | 0 (0.0%) | 10 (100.0%) |
| Personal Care & Service | 0 (0.0%) | 3 (100.0%) |
| Total (Category) | 0 (0.0%) | 29 (100.0%) |
| Total (Overall) | 74 (51.0%) | 71 (49.0%) |
Sales and Office Occupations
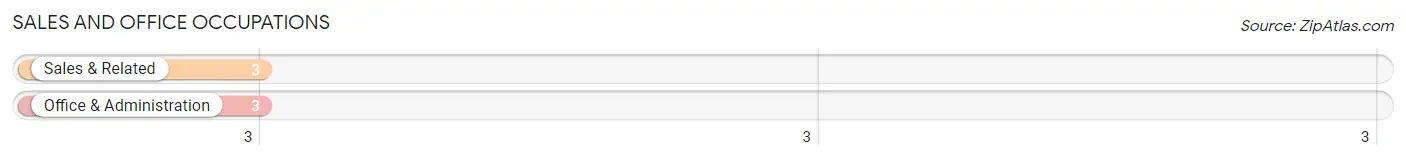
The most common Sales and Office occupations in Thedford are Sales & Related (3 | 2.1%), and Office & Administration (3 | 2.1%).
Sales and Office Occupations by Sex
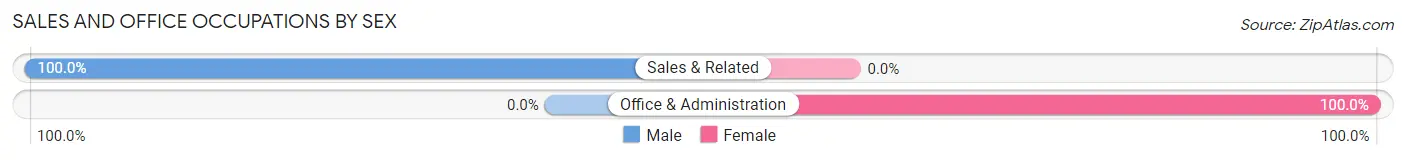
| Occupation | Male | Female |
| Sales & Related | 3 (100.0%) | 0 (0.0%) |
| Office & Administration | 0 (0.0%) | 3 (100.0%) |
| Total (Category) | 3 (50.0%) | 3 (50.0%) |
| Total (Overall) | 74 (51.0%) | 71 (49.0%) |
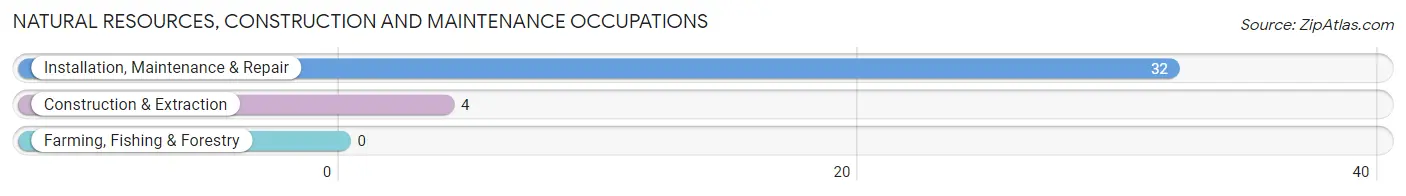
Natural Resources, Construction and Maintenance Occupations
The most common Natural Resources, Construction and Maintenance occupations in Thedford are Installation, Maintenance & Repair (32 | 22.1%), and Construction & Extraction (4 | 2.8%).
Natural Resources, Construction and Maintenance Occupations by Sex
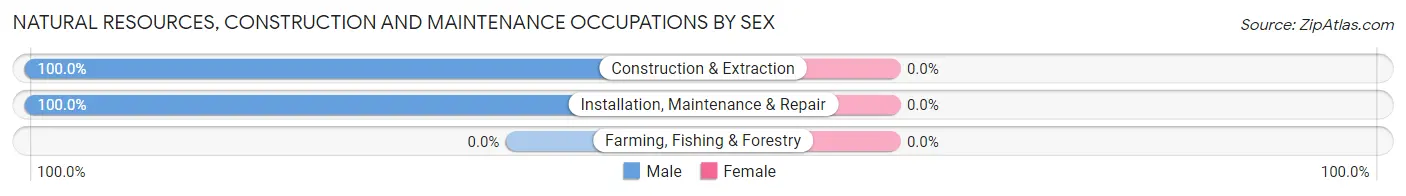
| Occupation | Male | Female |
| Farming, Fishing & Forestry | 0 (0.0%) | 0 (0.0%) |
| Construction & Extraction | 4 (100.0%) | 0 (0.0%) |
| Installation, Maintenance & Repair | 32 (100.0%) | 0 (0.0%) |
| Total (Category) | 36 (100.0%) | 0 (0.0%) |
| Total (Overall) | 74 (51.0%) | 71 (49.0%) |
Production, Transportation and Moving Occupations
The most common Production, Transportation and Moving occupations in Thedford are , and Production (3 | 2.1%).
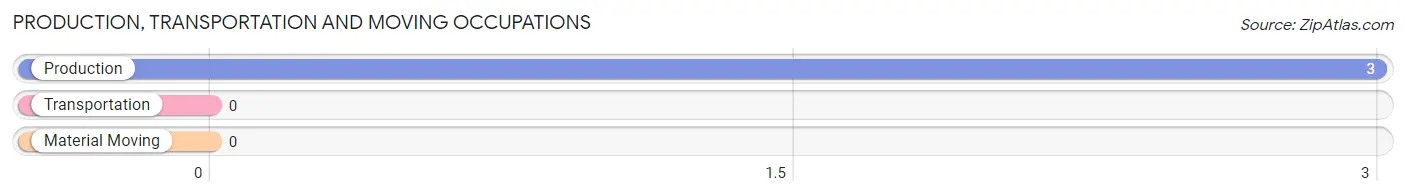
Production, Transportation and Moving Occupations by Sex
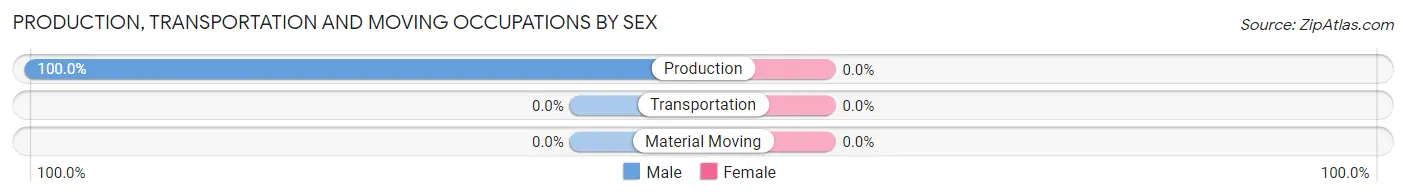
| Occupation | Male | Female |
| Production | 3 (100.0%) | 0 (0.0%) |
| Transportation | 0 (0.0%) | 0 (0.0%) |
| Material Moving | 0 (0.0%) | 0 (0.0%) |
| Total (Category) | 3 (100.0%) | 0 (0.0%) |
| Total (Overall) | 74 (51.0%) | 71 (49.0%) |
Employment Industries by Sex in Thedford
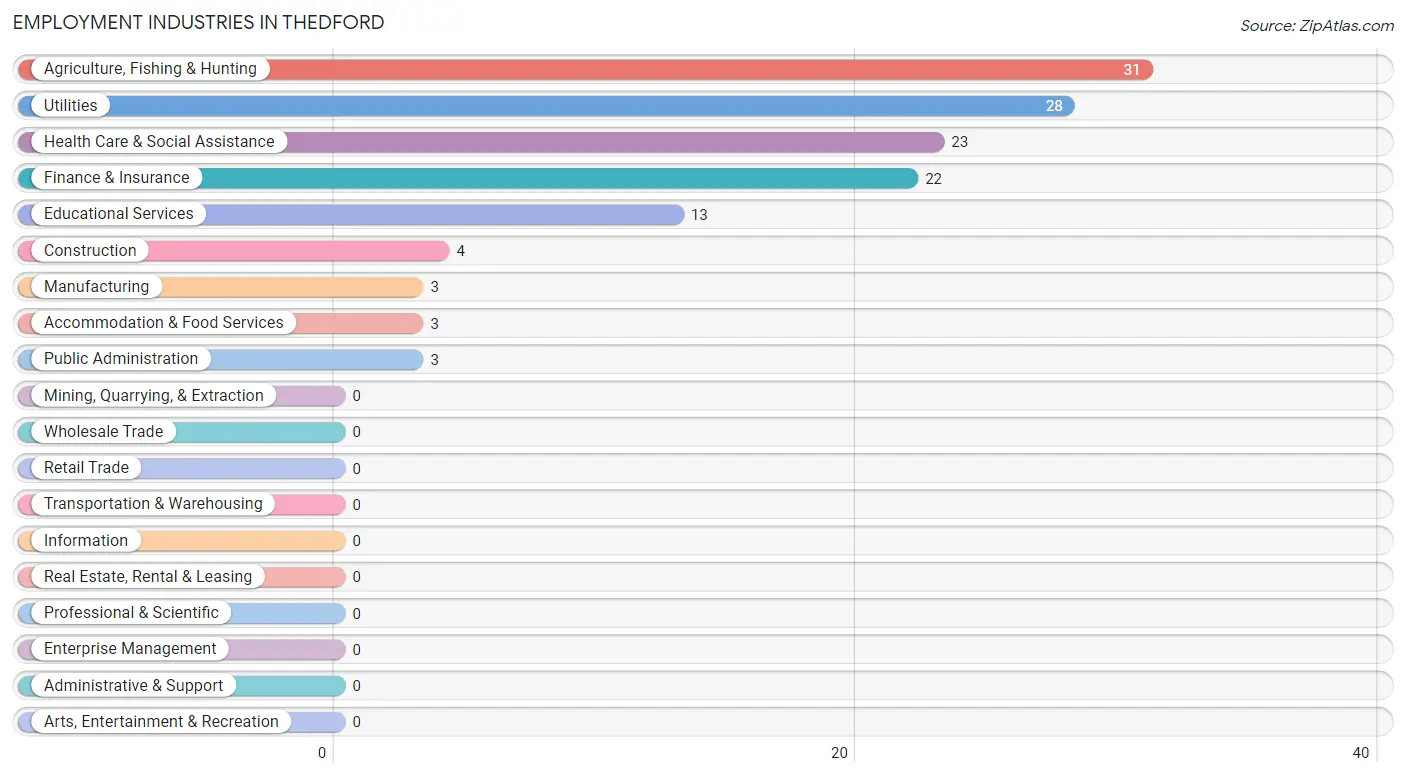
Employment Industries in Thedford
The major employment industries in Thedford include Agriculture, Fishing & Hunting (31 | 21.4%), Utilities (28 | 19.3%), Health Care & Social Assistance (23 | 15.9%), Finance & Insurance (22 | 15.2%), and Educational Services (13 | 9.0%).
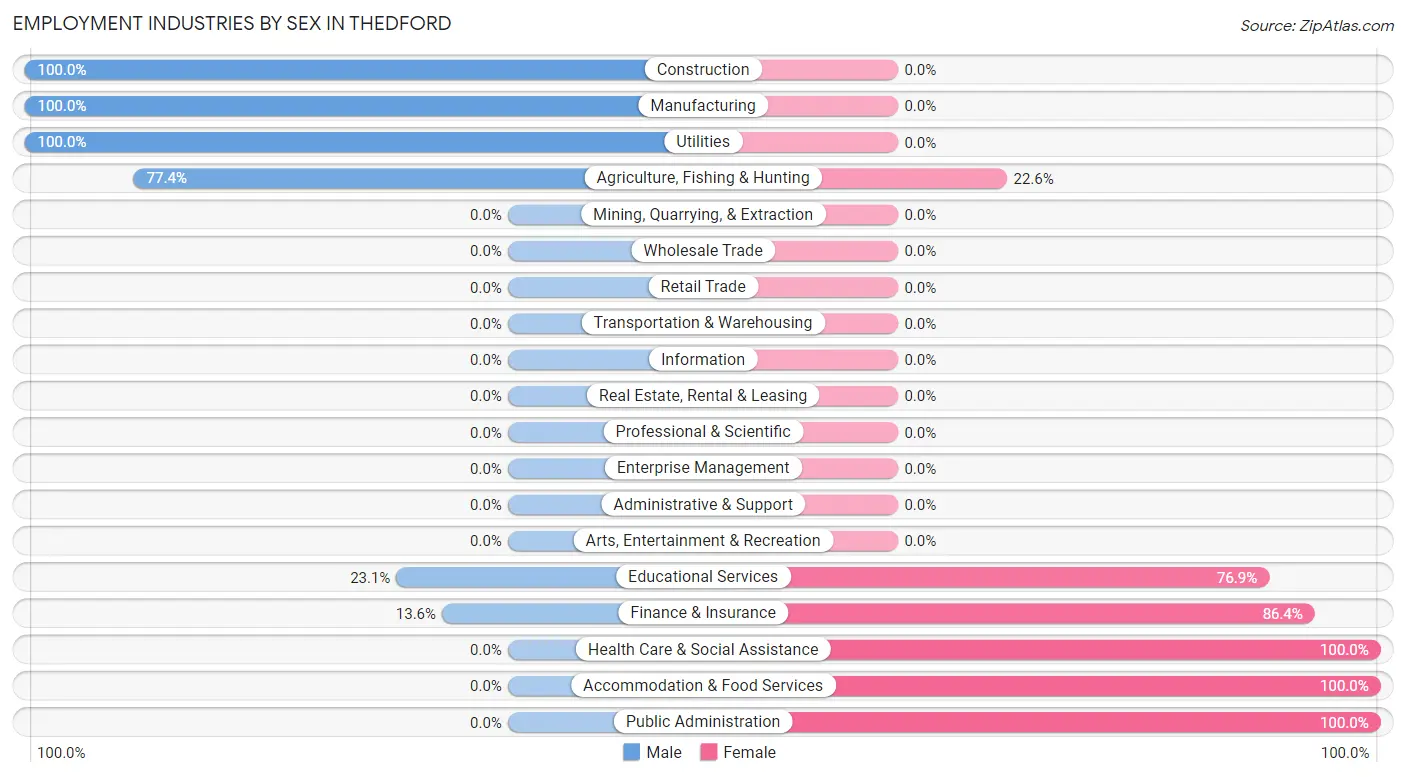
Employment Industries by Sex in Thedford
The Thedford industries that see more men than women are Construction (100.0%), Manufacturing (100.0%), and Utilities (100.0%), whereas the industries that tend to have a higher number of women are Health Care & Social Assistance (100.0%), Accommodation & Food Services (100.0%), and Public Administration (100.0%).
| Industry | Male | Female |
| Agriculture, Fishing & Hunting | 24 (77.4%) | 7 (22.6%) |
| Mining, Quarrying, & Extraction | 0 (0.0%) | 0 (0.0%) |
| Construction | 4 (100.0%) | 0 (0.0%) |
| Manufacturing | 3 (100.0%) | 0 (0.0%) |
| Wholesale Trade | 0 (0.0%) | 0 (0.0%) |
| Retail Trade | 0 (0.0%) | 0 (0.0%) |
| Transportation & Warehousing | 0 (0.0%) | 0 (0.0%) |
| Utilities | 28 (100.0%) | 0 (0.0%) |
| Information | 0 (0.0%) | 0 (0.0%) |
| Finance & Insurance | 3 (13.6%) | 19 (86.4%) |
| Real Estate, Rental & Leasing | 0 (0.0%) | 0 (0.0%) |
| Professional & Scientific | 0 (0.0%) | 0 (0.0%) |
| Enterprise Management | 0 (0.0%) | 0 (0.0%) |
| Administrative & Support | 0 (0.0%) | 0 (0.0%) |
| Educational Services | 3 (23.1%) | 10 (76.9%) |
| Health Care & Social Assistance | 0 (0.0%) | 23 (100.0%) |
| Arts, Entertainment & Recreation | 0 (0.0%) | 0 (0.0%) |
| Accommodation & Food Services | 0 (0.0%) | 3 (100.0%) |
| Public Administration | 0 (0.0%) | 3 (100.0%) |
| Total | 74 (51.0%) | 71 (49.0%) |
Education in Thedford
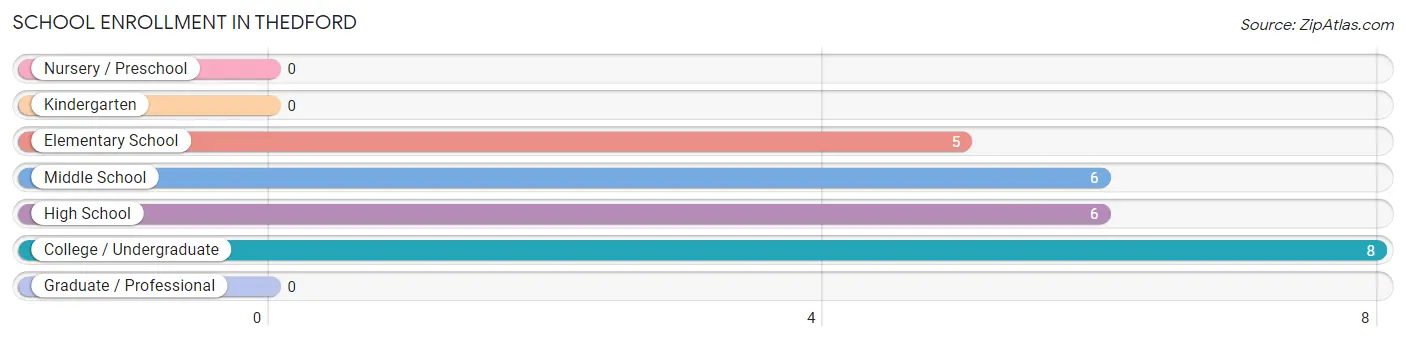
School Enrollment in Thedford
The most common levels of schooling among the 25 students in Thedford are college / undergraduate (8 | 32.0%), middle school (6 | 24.0%), and high school (6 | 24.0%).
| School Level | # Students | % Students |
| Nursery / Preschool | 0 | 0.0% |
| Kindergarten | 0 | 0.0% |
| Elementary School | 5 | 20.0% |
| Middle School | 6 | 24.0% |
| High School | 6 | 24.0% |
| College / Undergraduate | 8 | 32.0% |
| Graduate / Professional | 0 | 0.0% |
| Total | 25 | 100.0% |
School Enrollment by Age by Funding Source in Thedford
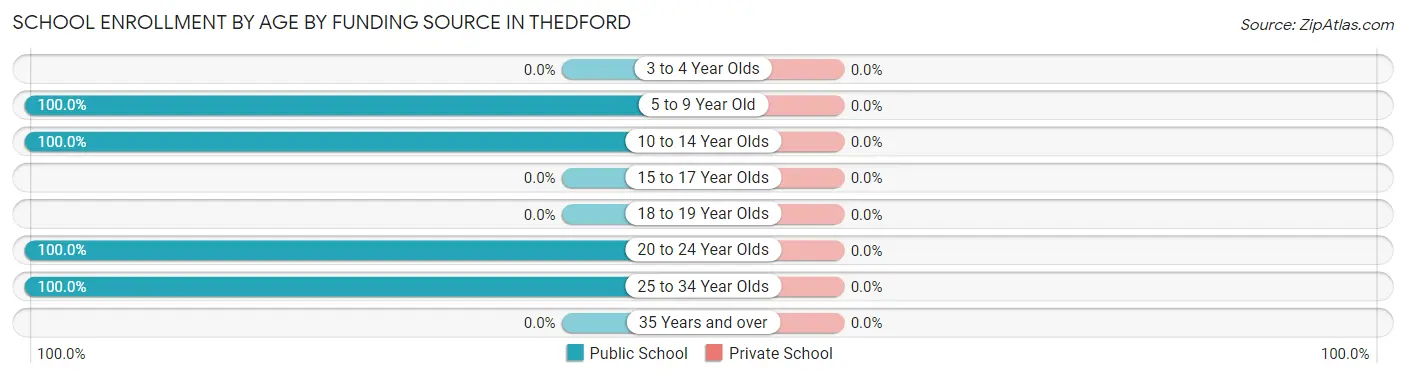
| Age Bracket | Public School | Private School |
| 3 to 4 Year Olds | 0 (0.0%) | 0 (0.0%) |
| 5 to 9 Year Old | 5 (100.0%) | 0 (0.0%) |
| 10 to 14 Year Olds | 6 (100.0%) | 0 (0.0%) |
| 15 to 17 Year Olds | 0 (0.0%) | 0 (0.0%) |
| 18 to 19 Year Olds | 0 (0.0%) | 0 (0.0%) |
| 20 to 24 Year Olds | 1 (100.0%) | 0 (0.0%) |
| 25 to 34 Year Olds | 13 (100.0%) | 0 (0.0%) |
| 35 Years and over | 0 (0.0%) | 0 (0.0%) |
| Total | 25 (100.0%) | 0 (0.0%) |
Educational Attainment by Field of Study in Thedford
Business (26 | 40.0%), bio, nature & agricultural (23 | 35.4%), education (9 | 13.9%), social sciences (4 | 6.1%), and arts & humanities (3 | 4.6%) are the most common fields of study among 65 individuals in Thedford who have obtained a bachelor's degree or higher.
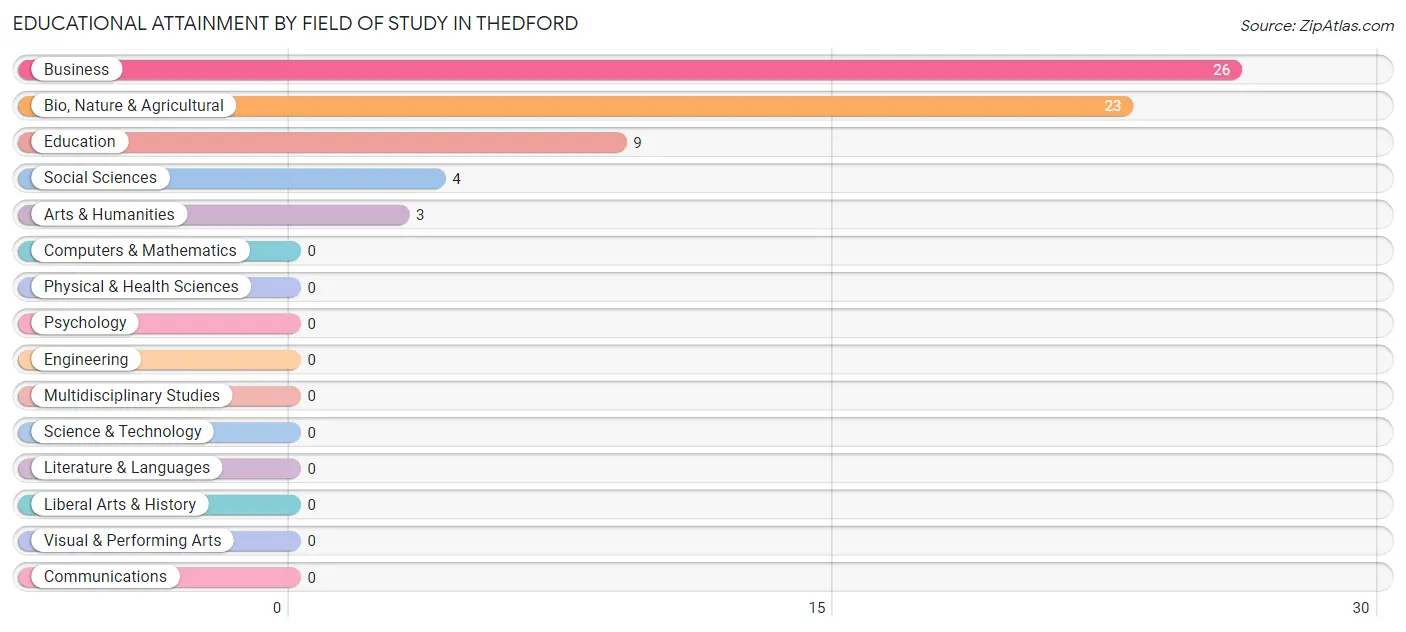
| Field of Study | # Graduates | % Graduates |
| Computers & Mathematics | 0 | 0.0% |
| Bio, Nature & Agricultural | 23 | 35.4% |
| Physical & Health Sciences | 0 | 0.0% |
| Psychology | 0 | 0.0% |
| Social Sciences | 4 | 6.1% |
| Engineering | 0 | 0.0% |
| Multidisciplinary Studies | 0 | 0.0% |
| Science & Technology | 0 | 0.0% |
| Business | 26 | 40.0% |
| Education | 9 | 13.9% |
| Literature & Languages | 0 | 0.0% |
| Liberal Arts & History | 0 | 0.0% |
| Visual & Performing Arts | 0 | 0.0% |
| Communications | 0 | 0.0% |
| Arts & Humanities | 3 | 4.6% |
| Total | 65 | 100.0% |
Transportation & Commute in Thedford
Vehicle Availability by Sex in Thedford
The most prevalent vehicle ownership categories in Thedford are males with 3 vehicles (63, accounting for 85.1%) and females with 3 vehicles (48, making up 88.7%).
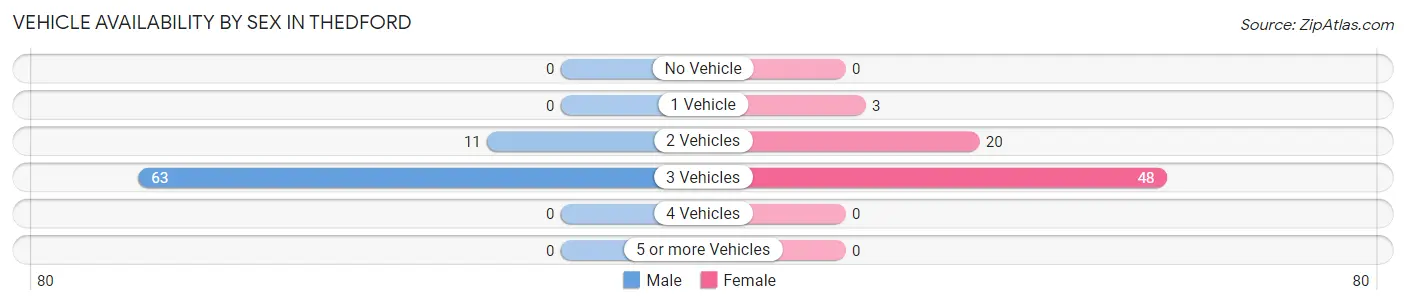
| Vehicles Available | Male | Female |
| No Vehicle | 0 (0.0%) | 0 (0.0%) |
| 1 Vehicle | 0 (0.0%) | 3 (4.2%) |
| 2 Vehicles | 11 (14.9%) | 20 (28.2%) |
| 3 Vehicles | 63 (85.1%) | 48 (67.6%) |
| 4 Vehicles | 0 (0.0%) | 0 (0.0%) |
| 5 or more Vehicles | 0 (0.0%) | 0 (0.0%) |
| Total | 74 (100.0%) | 71 (100.0%) |
Commute Time in Thedford
The most frequently occuring commute durations in Thedford are less than 5 minutes (45 commuters, 31.7%), 5 to 9 minutes (44 commuters, 31.0%), and 10 to 14 minutes (27 commuters, 19.0%).
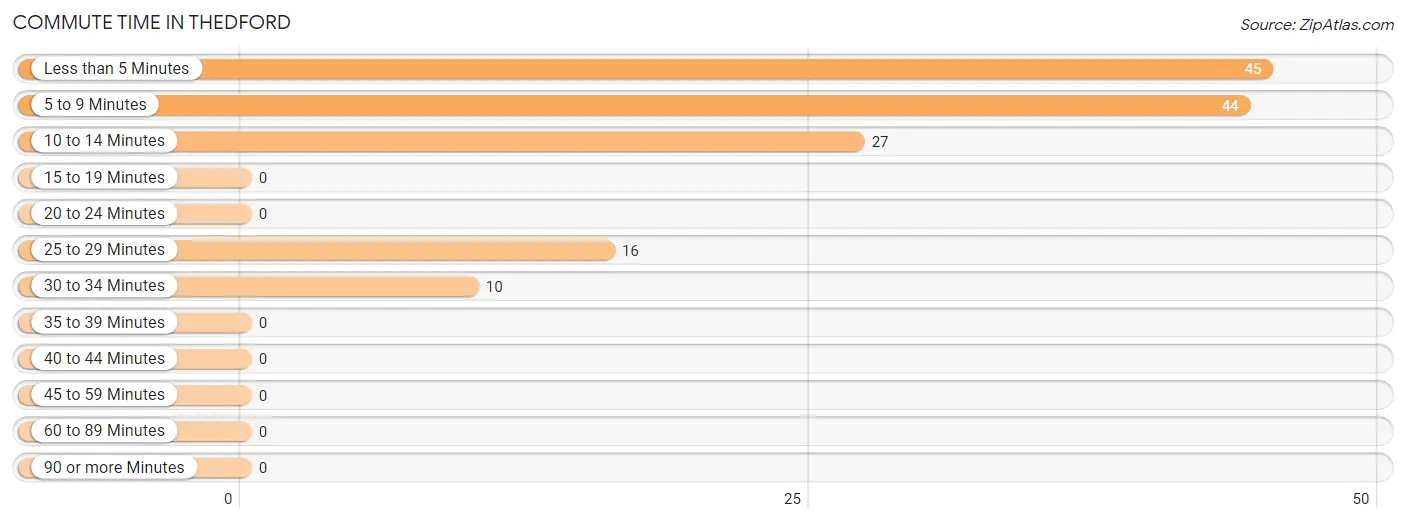
| Commute Time | # Commuters | % Commuters |
| Less than 5 Minutes | 45 | 31.7% |
| 5 to 9 Minutes | 44 | 31.0% |
| 10 to 14 Minutes | 27 | 19.0% |
| 15 to 19 Minutes | 0 | 0.0% |
| 20 to 24 Minutes | 0 | 0.0% |
| 25 to 29 Minutes | 16 | 11.3% |
| 30 to 34 Minutes | 10 | 7.0% |
| 35 to 39 Minutes | 0 | 0.0% |
| 40 to 44 Minutes | 0 | 0.0% |
| 45 to 59 Minutes | 0 | 0.0% |
| 60 to 89 Minutes | 0 | 0.0% |
| 90 or more Minutes | 0 | 0.0% |
Commute Time by Sex in Thedford
The most common commute times in Thedford are 5 to 9 minutes (32 commuters, 43.2%) for males and less than 5 minutes (30 commuters, 44.1%) for females.
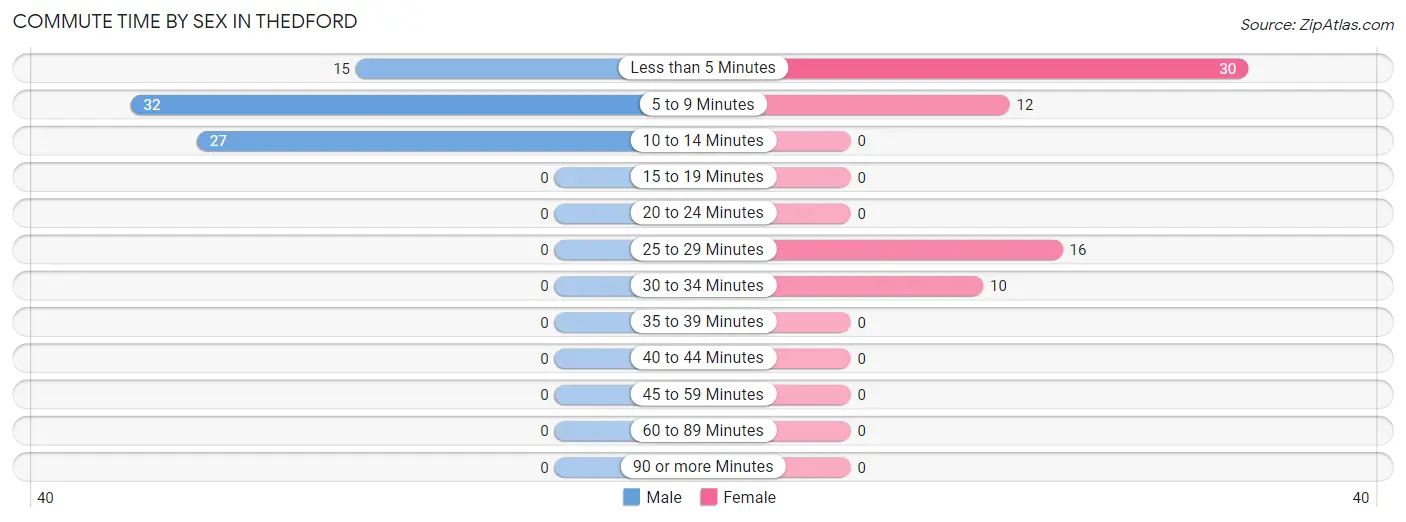
| Commute Time | Male | Female |
| Less than 5 Minutes | 15 (20.3%) | 30 (44.1%) |
| 5 to 9 Minutes | 32 (43.2%) | 12 (17.6%) |
| 10 to 14 Minutes | 27 (36.5%) | 0 (0.0%) |
| 15 to 19 Minutes | 0 (0.0%) | 0 (0.0%) |
| 20 to 24 Minutes | 0 (0.0%) | 0 (0.0%) |
| 25 to 29 Minutes | 0 (0.0%) | 16 (23.5%) |
| 30 to 34 Minutes | 0 (0.0%) | 10 (14.7%) |
| 35 to 39 Minutes | 0 (0.0%) | 0 (0.0%) |
| 40 to 44 Minutes | 0 (0.0%) | 0 (0.0%) |
| 45 to 59 Minutes | 0 (0.0%) | 0 (0.0%) |
| 60 to 89 Minutes | 0 (0.0%) | 0 (0.0%) |
| 90 or more Minutes | 0 (0.0%) | 0 (0.0%) |
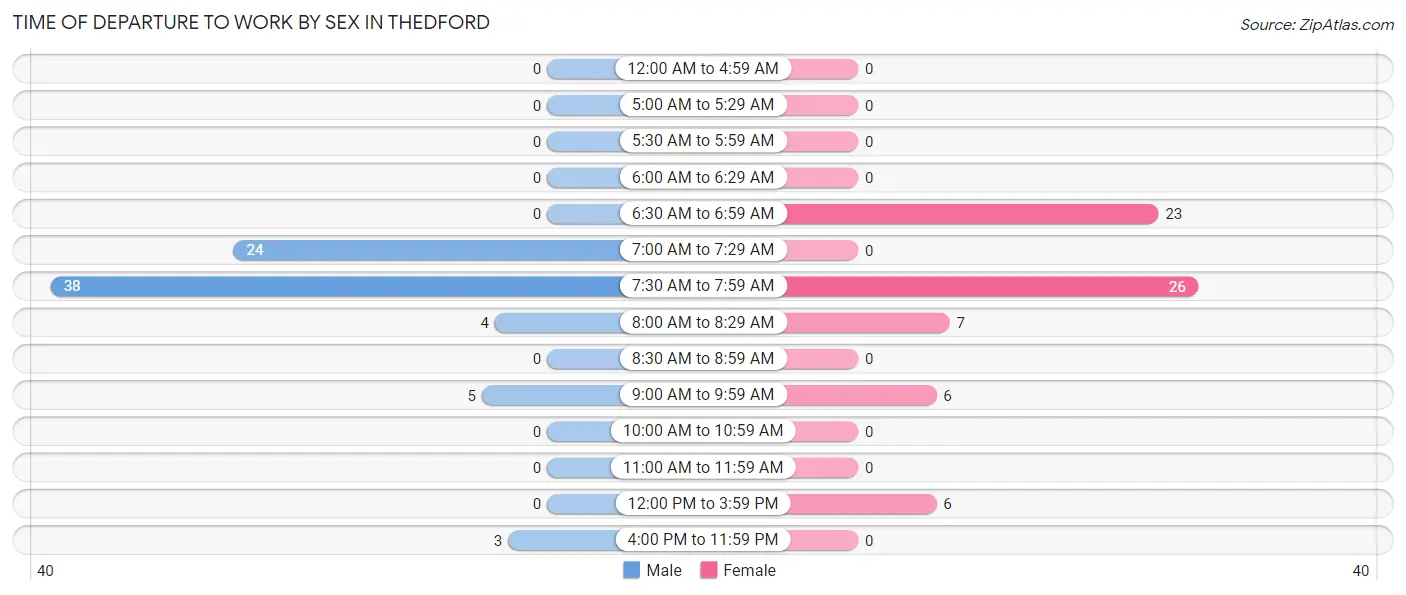
Time of Departure to Work by Sex in Thedford
The most frequent times of departure to work in Thedford are 7:30 AM to 7:59 AM (38, 51.3%) for males and 7:30 AM to 7:59 AM (26, 38.2%) for females.
| Time of Departure | Male | Female |
| 12:00 AM to 4:59 AM | 0 (0.0%) | 0 (0.0%) |
| 5:00 AM to 5:29 AM | 0 (0.0%) | 0 (0.0%) |
| 5:30 AM to 5:59 AM | 0 (0.0%) | 0 (0.0%) |
| 6:00 AM to 6:29 AM | 0 (0.0%) | 0 (0.0%) |
| 6:30 AM to 6:59 AM | 0 (0.0%) | 23 (33.8%) |
| 7:00 AM to 7:29 AM | 24 (32.4%) | 0 (0.0%) |
| 7:30 AM to 7:59 AM | 38 (51.3%) | 26 (38.2%) |
| 8:00 AM to 8:29 AM | 4 (5.4%) | 7 (10.3%) |
| 8:30 AM to 8:59 AM | 0 (0.0%) | 0 (0.0%) |
| 9:00 AM to 9:59 AM | 5 (6.8%) | 6 (8.8%) |
| 10:00 AM to 10:59 AM | 0 (0.0%) | 0 (0.0%) |
| 11:00 AM to 11:59 AM | 0 (0.0%) | 0 (0.0%) |
| 12:00 PM to 3:59 PM | 0 (0.0%) | 6 (8.8%) |
| 4:00 PM to 11:59 PM | 3 (4.1%) | 0 (0.0%) |
| Total | 74 (100.0%) | 68 (100.0%) |
Housing Occupancy in Thedford
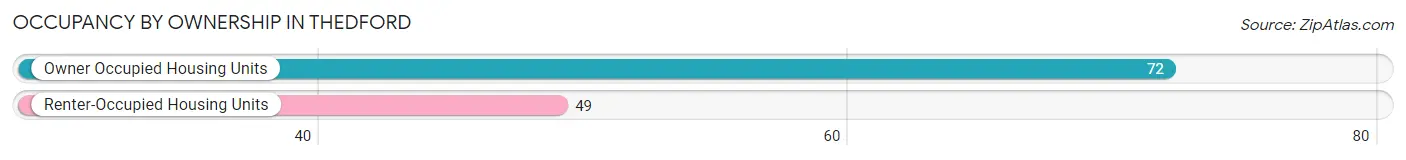
Occupancy by Ownership in Thedford
Of the total 121 dwellings in Thedford, owner-occupied units account for 72 (59.5%), while renter-occupied units make up 49 (40.5%).
| Occupancy | # Housing Units | % Housing Units |
| Owner Occupied Housing Units | 72 | 59.5% |
| Renter-Occupied Housing Units | 49 | 40.5% |
| Total Occupied Housing Units | 121 | 100.0% |
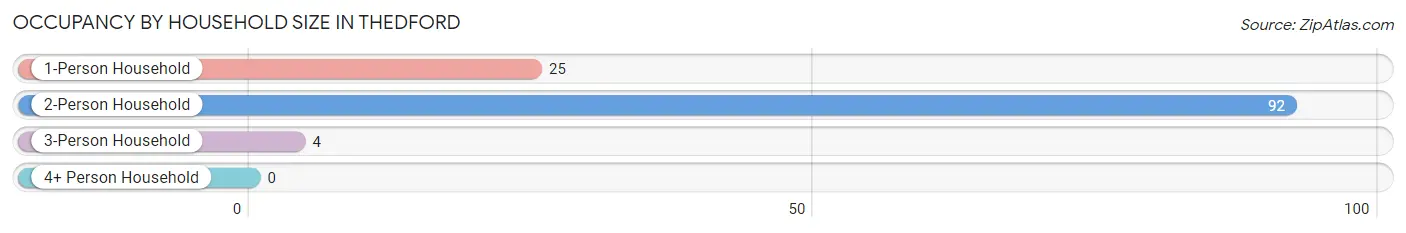
Occupancy by Household Size in Thedford
| Household Size | # Housing Units | % Housing Units |
| 1-Person Household | 25 | 20.7% |
| 2-Person Household | 92 | 76.0% |
| 3-Person Household | 4 | 3.3% |
| 4+ Person Household | 0 | 0.0% |
| Total Housing Units | 121 | 100.0% |
Occupancy by Ownership by Household Size in Thedford
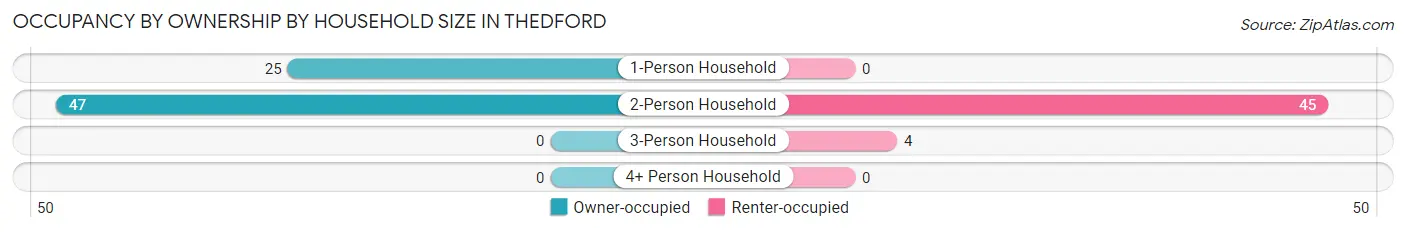
| Household Size | Owner-occupied | Renter-occupied |
| 1-Person Household | 25 (100.0%) | 0 (0.0%) |
| 2-Person Household | 47 (51.1%) | 45 (48.9%) |
| 3-Person Household | 0 (0.0%) | 4 (100.0%) |
| 4+ Person Household | 0 (0.0%) | 0 (0.0%) |
| Total Housing Units | 72 (59.5%) | 49 (40.5%) |
Occupancy by Educational Attainment in Thedford
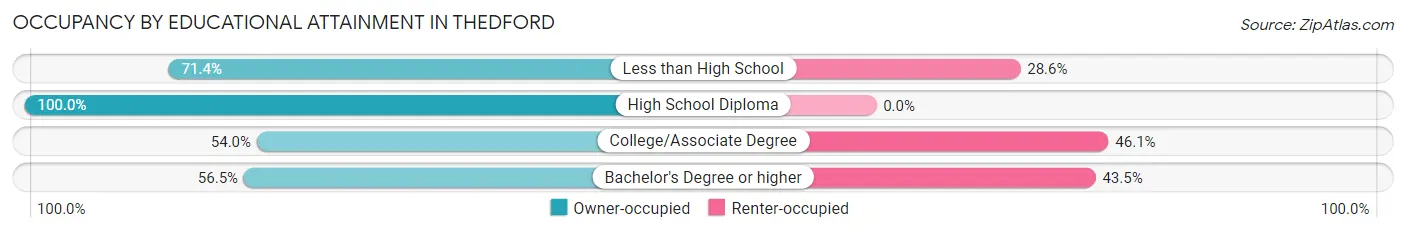
| Household Size | Owner-occupied | Renter-occupied |
| Less than High School | 10 (71.4%) | 4 (28.6%) |
| High School Diploma | 8 (100.0%) | 0 (0.0%) |
| College/Associate Degree | 41 (53.9%) | 35 (46.1%) |
| Bachelor's Degree or higher | 13 (56.5%) | 10 (43.5%) |
Occupancy by Age of Householder in Thedford
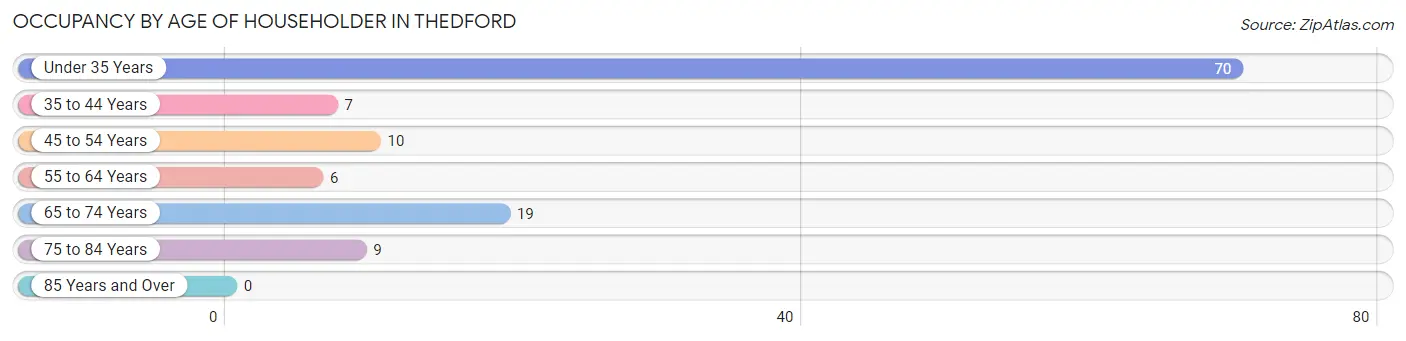
| Age Bracket | # Households | % Households |
| Under 35 Years | 70 | 57.9% |
| 35 to 44 Years | 7 | 5.8% |
| 45 to 54 Years | 10 | 8.3% |
| 55 to 64 Years | 6 | 5.0% |
| 65 to 74 Years | 19 | 15.7% |
| 75 to 84 Years | 9 | 7.4% |
| 85 Years and Over | 0 | 0.0% |
| Total | 121 | 100.0% |
Housing Finances in Thedford
Median Income by Occupancy in Thedford
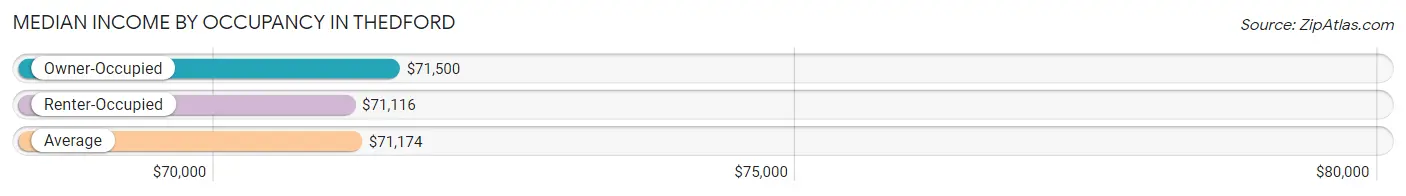
| Occupancy Type | # Households | Median Income |
| Owner-Occupied | 72 (59.5%) | $71,500 |
| Renter-Occupied | 49 (40.5%) | $71,116 |
| Average | 121 (100.0%) | $71,174 |
Occupancy by Householder Income Bracket in Thedford
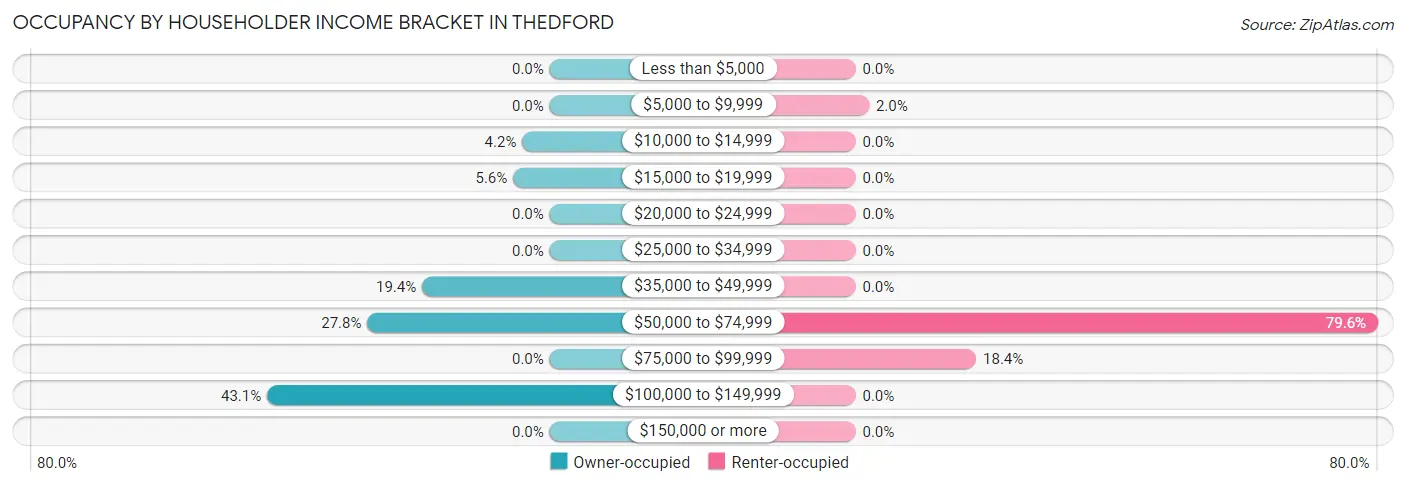
| Income Bracket | Owner-occupied | Renter-occupied |
| Less than $5,000 | 0 (0.0%) | 0 (0.0%) |
| $5,000 to $9,999 | 0 (0.0%) | 1 (2.0%) |
| $10,000 to $14,999 | 3 (4.2%) | 0 (0.0%) |
| $15,000 to $19,999 | 4 (5.6%) | 0 (0.0%) |
| $20,000 to $24,999 | 0 (0.0%) | 0 (0.0%) |
| $25,000 to $34,999 | 0 (0.0%) | 0 (0.0%) |
| $35,000 to $49,999 | 14 (19.4%) | 0 (0.0%) |
| $50,000 to $74,999 | 20 (27.8%) | 39 (79.6%) |
| $75,000 to $99,999 | 0 (0.0%) | 9 (18.4%) |
| $100,000 to $149,999 | 31 (43.1%) | 0 (0.0%) |
| $150,000 or more | 0 (0.0%) | 0 (0.0%) |
| Total | 72 (100.0%) | 49 (100.0%) |
Monthly Housing Cost Tiers in Thedford
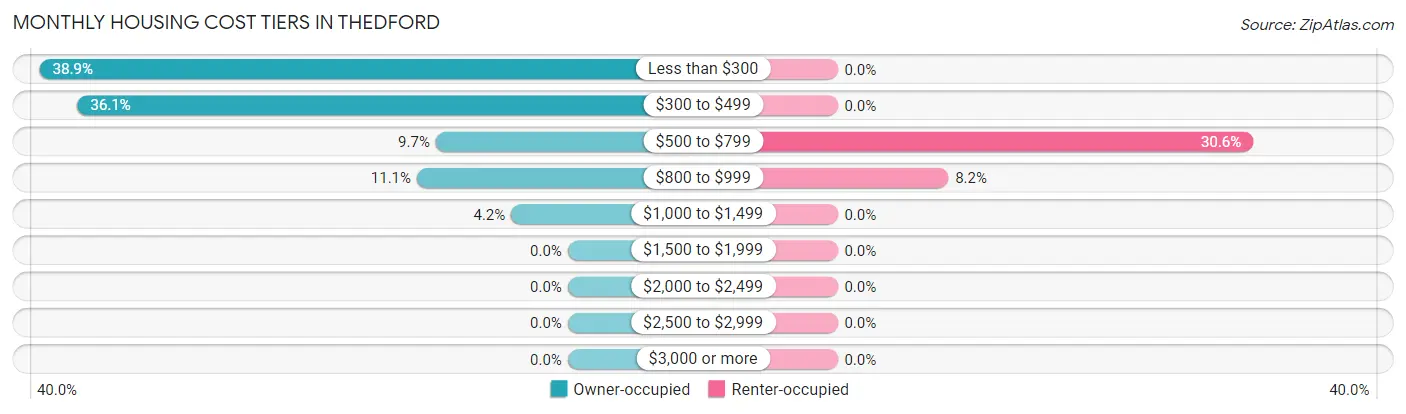
| Monthly Cost | Owner-occupied | Renter-occupied |
| Less than $300 | 28 (38.9%) | 0 (0.0%) |
| $300 to $499 | 26 (36.1%) | 0 (0.0%) |
| $500 to $799 | 7 (9.7%) | 15 (30.6%) |
| $800 to $999 | 8 (11.1%) | 4 (8.2%) |
| $1,000 to $1,499 | 3 (4.2%) | 0 (0.0%) |
| $1,500 to $1,999 | 0 (0.0%) | 0 (0.0%) |
| $2,000 to $2,499 | 0 (0.0%) | 0 (0.0%) |
| $2,500 to $2,999 | 0 (0.0%) | 0 (0.0%) |
| $3,000 or more | 0 (0.0%) | 0 (0.0%) |
| Total | 72 (100.0%) | 49 (100.0%) |
Physical Housing Characteristics in Thedford
Housing Structures in Thedford
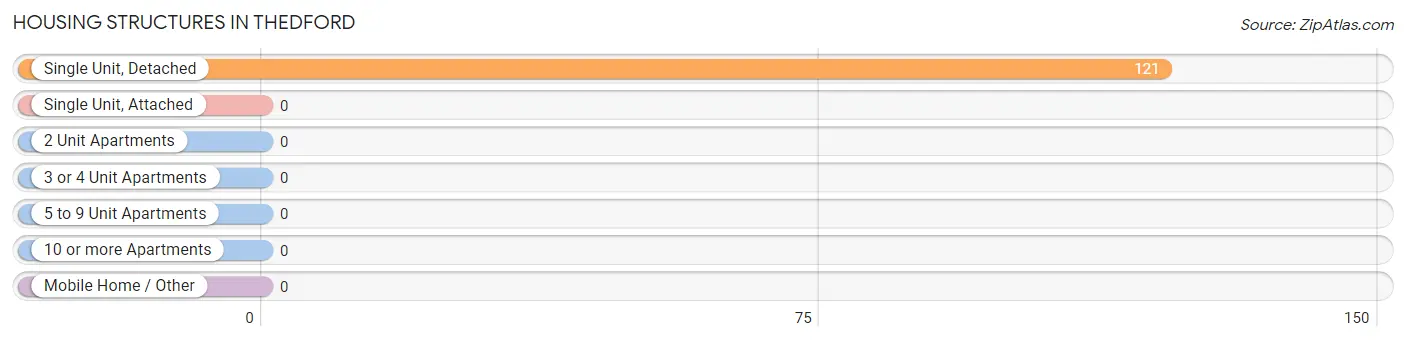
| Structure Type | # Housing Units | % Housing Units |
| Single Unit, Detached | 121 | 100.0% |
| Single Unit, Attached | 0 | 0.0% |
| 2 Unit Apartments | 0 | 0.0% |
| 3 or 4 Unit Apartments | 0 | 0.0% |
| 5 to 9 Unit Apartments | 0 | 0.0% |
| 10 or more Apartments | 0 | 0.0% |
| Mobile Home / Other | 0 | 0.0% |
| Total | 121 | 100.0% |
Housing Structures by Occupancy in Thedford
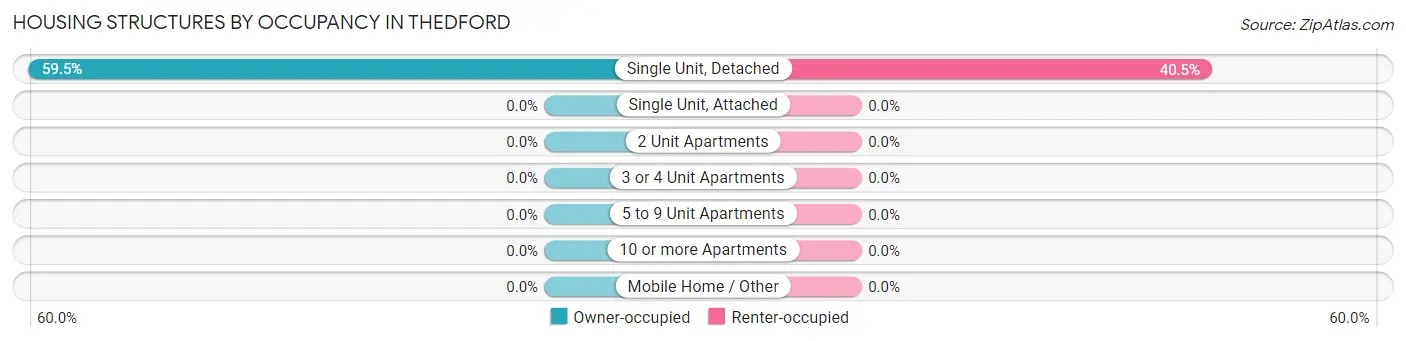
| Structure Type | Owner-occupied | Renter-occupied |
| Single Unit, Detached | 72 (59.5%) | 49 (40.5%) |
| Single Unit, Attached | 0 (0.0%) | 0 (0.0%) |
| 2 Unit Apartments | 0 (0.0%) | 0 (0.0%) |
| 3 or 4 Unit Apartments | 0 (0.0%) | 0 (0.0%) |
| 5 to 9 Unit Apartments | 0 (0.0%) | 0 (0.0%) |
| 10 or more Apartments | 0 (0.0%) | 0 (0.0%) |
| Mobile Home / Other | 0 (0.0%) | 0 (0.0%) |
| Total | 72 (59.5%) | 49 (40.5%) |
Housing Structures by Number of Rooms in Thedford
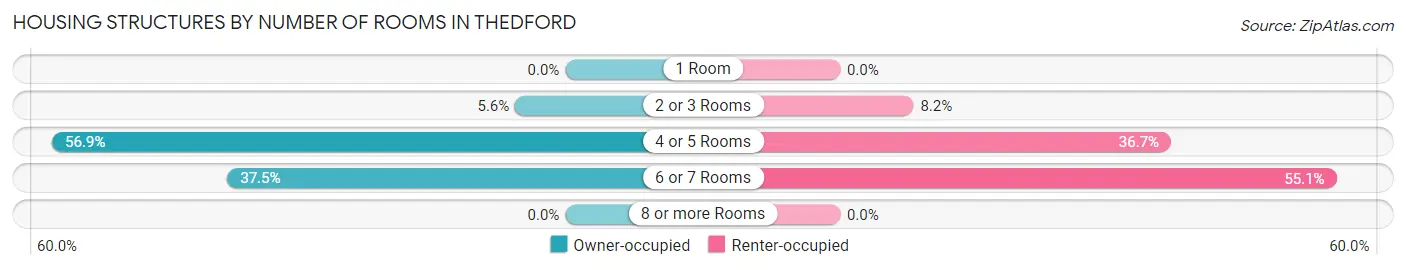
| Number of Rooms | Owner-occupied | Renter-occupied |
| 1 Room | 0 (0.0%) | 0 (0.0%) |
| 2 or 3 Rooms | 4 (5.6%) | 4 (8.2%) |
| 4 or 5 Rooms | 41 (56.9%) | 18 (36.7%) |
| 6 or 7 Rooms | 27 (37.5%) | 27 (55.1%) |
| 8 or more Rooms | 0 (0.0%) | 0 (0.0%) |
| Total | 72 (100.0%) | 49 (100.0%) |
Housing Structure by Heating Type in Thedford
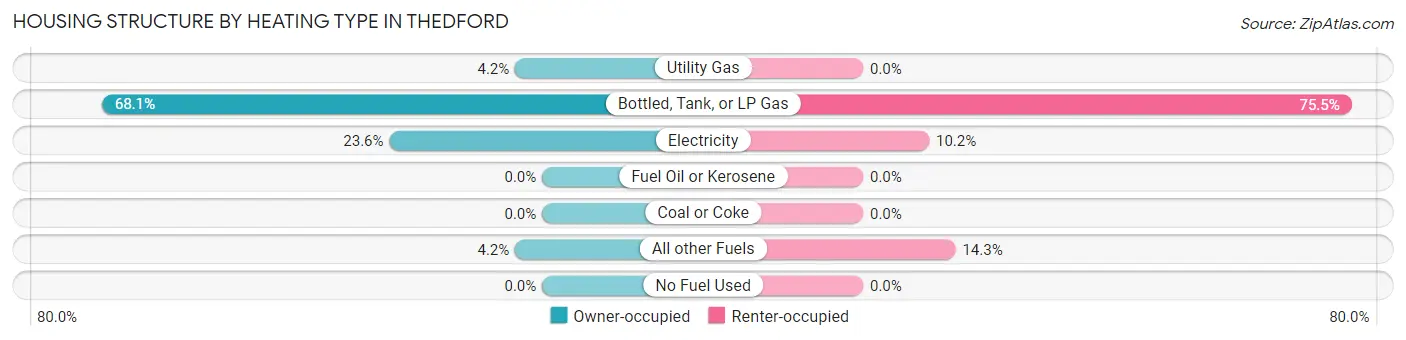
| Heating Type | Owner-occupied | Renter-occupied |
| Utility Gas | 3 (4.2%) | 0 (0.0%) |
| Bottled, Tank, or LP Gas | 49 (68.1%) | 37 (75.5%) |
| Electricity | 17 (23.6%) | 5 (10.2%) |
| Fuel Oil or Kerosene | 0 (0.0%) | 0 (0.0%) |
| Coal or Coke | 0 (0.0%) | 0 (0.0%) |
| All other Fuels | 3 (4.2%) | 7 (14.3%) |
| No Fuel Used | 0 (0.0%) | 0 (0.0%) |
| Total | 72 (100.0%) | 49 (100.0%) |
Household Vehicle Usage in Thedford
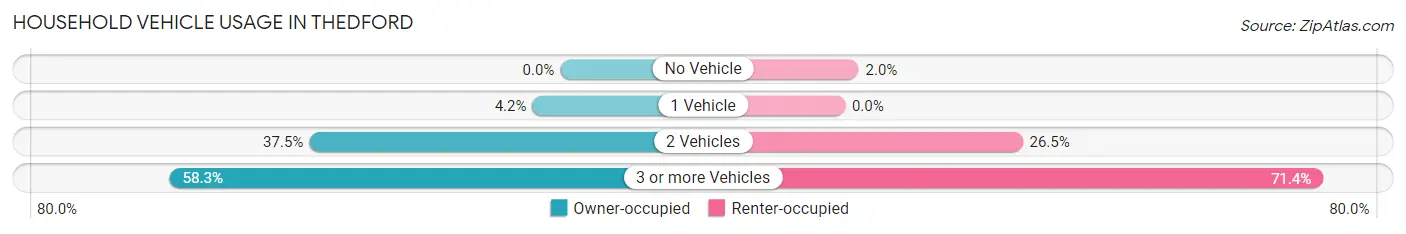
| Vehicles per Household | Owner-occupied | Renter-occupied |
| No Vehicle | 0 (0.0%) | 1 (2.0%) |
| 1 Vehicle | 3 (4.2%) | 0 (0.0%) |
| 2 Vehicles | 27 (37.5%) | 13 (26.5%) |
| 3 or more Vehicles | 42 (58.3%) | 35 (71.4%) |
| Total | 72 (100.0%) | 49 (100.0%) |
Real Estate & Mortgages in Thedford
Real Estate and Mortgage Overview in Thedford
| Characteristic | Without Mortgage | With Mortgage |
| Housing Units | 61 | 11 |
| Median Property Value | $67,000 | $120,800 |
| Median Household Income | $72,917 | $0 |
| Monthly Housing Costs | $368 | $0 |
| Real Estate Taxes | $732 | $0 |
Property Value by Mortgage Status in Thedford

| Property Value | Without Mortgage | With Mortgage |
| Less than $50,000 | 6 (9.8%) | 0 (0.0%) |
| $50,000 to $99,999 | 46 (75.4%) | 3 (27.3%) |
| $100,000 to $299,999 | 5 (8.2%) | 8 (72.7%) |
| $300,000 to $499,999 | 4 (6.6%) | 0 (0.0%) |
| $500,000 to $749,999 | 0 (0.0%) | 0 (0.0%) |
| $750,000 to $999,999 | 0 (0.0%) | 0 (0.0%) |
| $1,000,000 or more | 0 (0.0%) | 0 (0.0%) |
| Total | 61 (100.0%) | 11 (100.0%) |
Household Income by Mortgage Status in Thedford
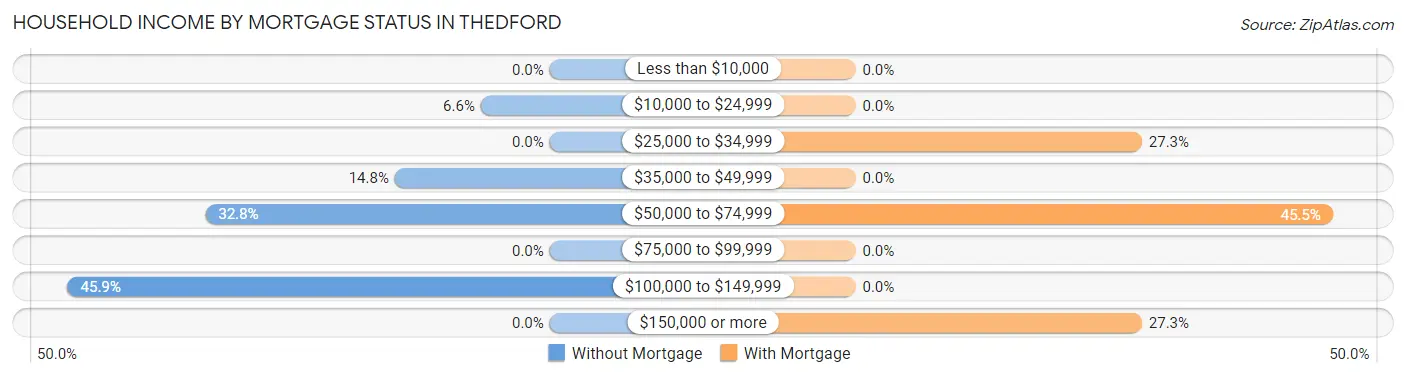
| Household Income | Without Mortgage | With Mortgage |
| Less than $10,000 | 0 (0.0%) | 0 (0.0%) |
| $10,000 to $24,999 | 4 (6.6%) | 0 (0.0%) |
| $25,000 to $34,999 | 0 (0.0%) | 3 (27.3%) |
| $35,000 to $49,999 | 9 (14.7%) | 0 (0.0%) |
| $50,000 to $74,999 | 20 (32.8%) | 5 (45.5%) |
| $75,000 to $99,999 | 0 (0.0%) | 0 (0.0%) |
| $100,000 to $149,999 | 28 (45.9%) | 0 (0.0%) |
| $150,000 or more | 0 (0.0%) | 3 (27.3%) |
| Total | 61 (100.0%) | 11 (100.0%) |
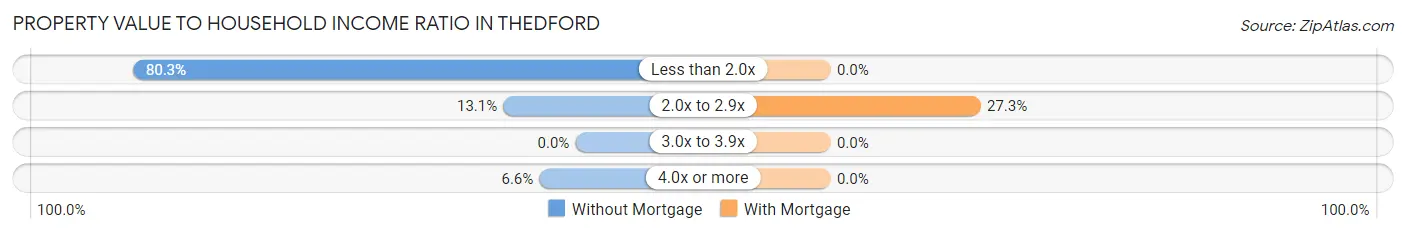
Property Value to Household Income Ratio in Thedford
| Value-to-Income Ratio | Without Mortgage | With Mortgage |
| Less than 2.0x | 49 (80.3%) | 0 (0.0%) |
| 2.0x to 2.9x | 8 (13.1%) | 3 (27.3%) |
| 3.0x to 3.9x | 0 (0.0%) | 0 (0.0%) |
| 4.0x or more | 4 (6.6%) | 0 (0.0%) |
| Total | 61 (100.0%) | 11 (100.0%) |
Real Estate Taxes by Mortgage Status in Thedford
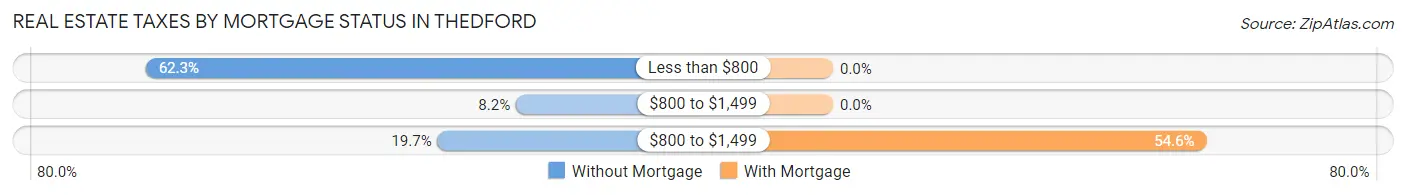
| Property Taxes | Without Mortgage | With Mortgage |
| Less than $800 | 38 (62.3%) | 0 (0.0%) |
| $800 to $1,499 | 5 (8.2%) | 0 (0.0%) |
| $800 to $1,499 | 12 (19.7%) | 6 (54.5%) |
| Total | 61 (100.0%) | 11 (100.0%) |
Health & Disability in Thedford
Health Insurance Coverage by Age in Thedford
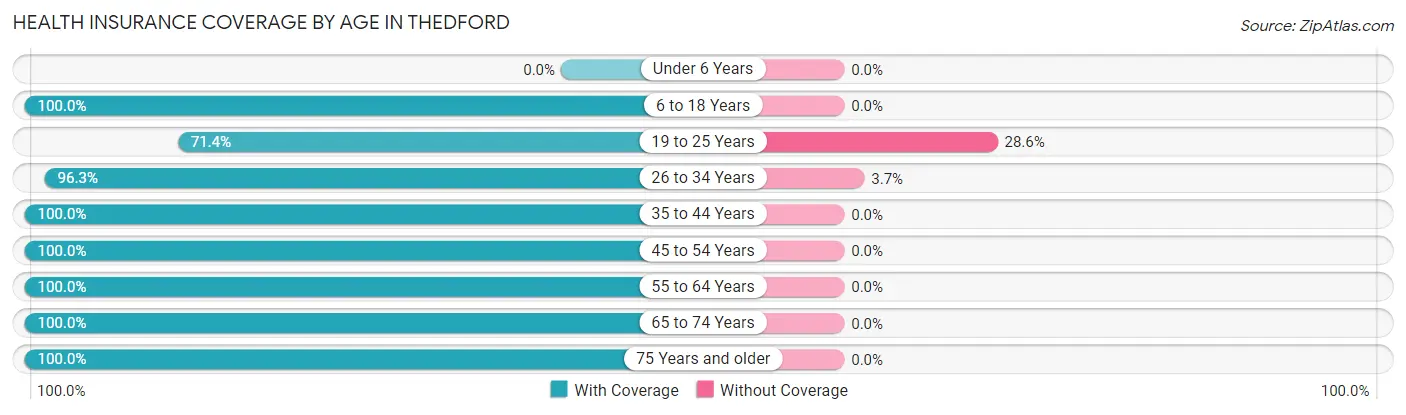
| Age Bracket | With Coverage | Without Coverage |
| Under 6 Years | 0 (0.0%) | 0 (0.0%) |
| 6 to 18 Years | 11 (100.0%) | 0 (0.0%) |
| 19 to 25 Years | 5 (71.4%) | 2 (28.6%) |
| 26 to 34 Years | 103 (96.3%) | 4 (3.7%) |
| 35 to 44 Years | 7 (100.0%) | 0 (0.0%) |
| 45 to 54 Years | 10 (100.0%) | 0 (0.0%) |
| 55 to 64 Years | 11 (100.0%) | 0 (0.0%) |
| 65 to 74 Years | 31 (100.0%) | 0 (0.0%) |
| 75 Years and older | 14 (100.0%) | 0 (0.0%) |
| Total | 192 (97.0%) | 6 (3.0%) |
Health Insurance Coverage by Citizenship Status in Thedford
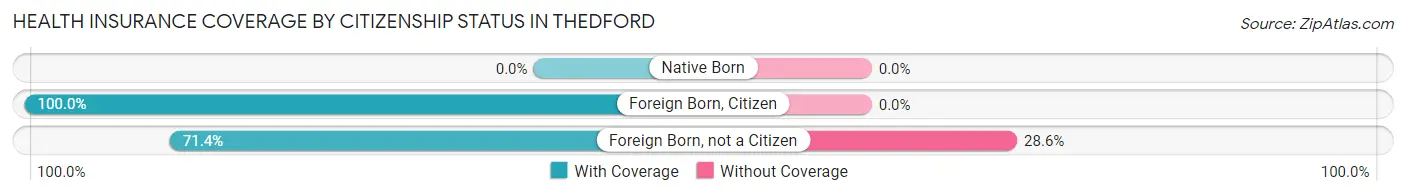
| Citizenship Status | With Coverage | Without Coverage |
| Native Born | 0 (0.0%) | 0 (0.0%) |
| Foreign Born, Citizen | 11 (100.0%) | 0 (0.0%) |
| Foreign Born, not a Citizen | 5 (71.4%) | 2 (28.6%) |
Health Insurance Coverage by Household Income in Thedford
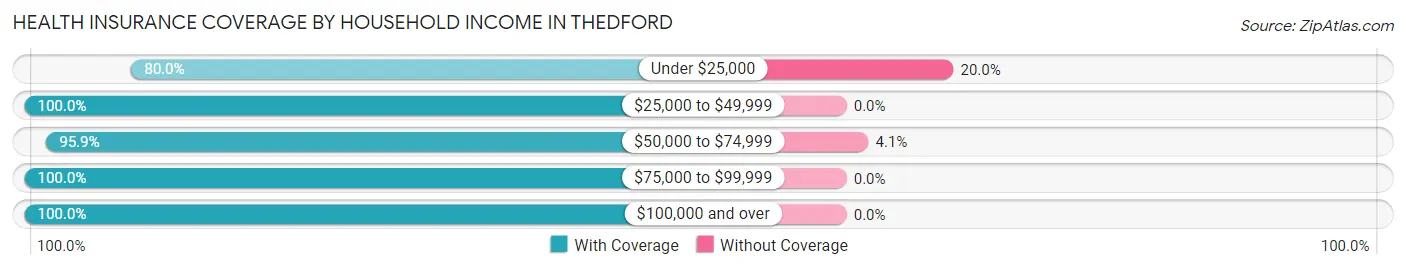
| Household Income | With Coverage | Without Coverage |
| Under $25,000 | 8 (80.0%) | 2 (20.0%) |
| $25,000 to $49,999 | 19 (100.0%) | 0 (0.0%) |
| $50,000 to $74,999 | 94 (95.9%) | 4 (4.1%) |
| $75,000 to $99,999 | 17 (100.0%) | 0 (0.0%) |
| $100,000 and over | 54 (100.0%) | 0 (0.0%) |
Public vs Private Health Insurance Coverage by Age in Thedford
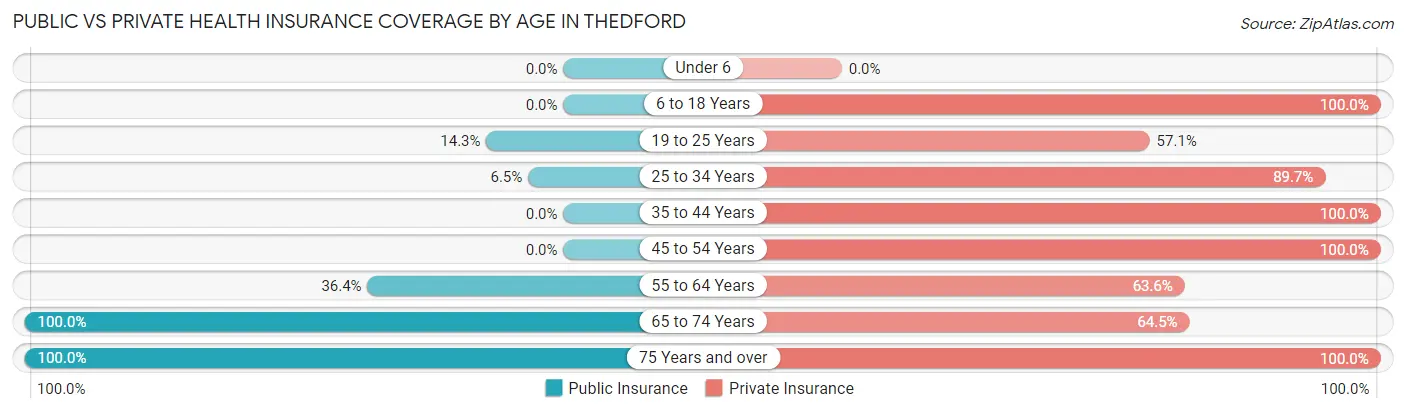
| Age Bracket | Public Insurance | Private Insurance |
| Under 6 | 0 (0.0%) | 0 (0.0%) |
| 6 to 18 Years | 0 (0.0%) | 11 (100.0%) |
| 19 to 25 Years | 1 (14.3%) | 4 (57.1%) |
| 25 to 34 Years | 7 (6.5%) | 96 (89.7%) |
| 35 to 44 Years | 0 (0.0%) | 7 (100.0%) |
| 45 to 54 Years | 0 (0.0%) | 10 (100.0%) |
| 55 to 64 Years | 4 (36.4%) | 7 (63.6%) |
| 65 to 74 Years | 31 (100.0%) | 20 (64.5%) |
| 75 Years and over | 14 (100.0%) | 14 (100.0%) |
| Total | 57 (28.8%) | 169 (85.4%) |
Disability Status by Sex by Age in Thedford
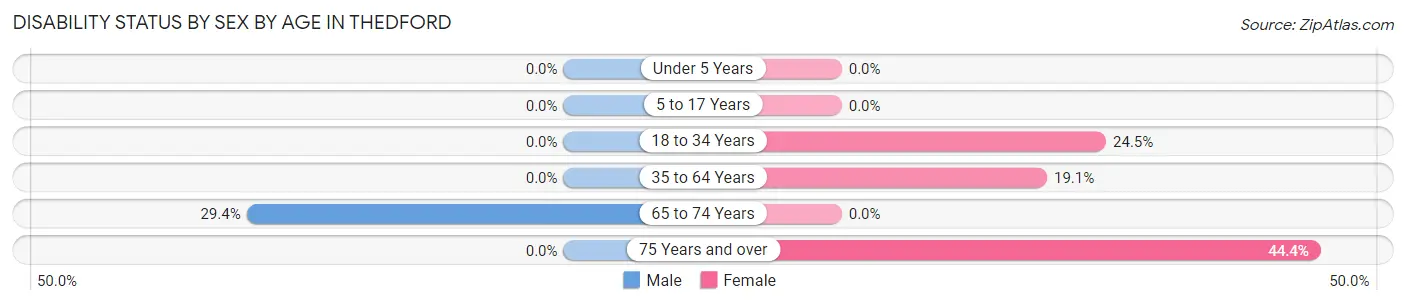
| Age Bracket | Male | Female |
| Under 5 Years | 0 (0.0%) | 0 (0.0%) |
| 5 to 17 Years | 0 (0.0%) | 0 (0.0%) |
| 18 to 34 Years | 0 (0.0%) | 13 (24.5%) |
| 35 to 64 Years | 0 (0.0%) | 4 (19.1%) |
| 65 to 74 Years | 5 (29.4%) | 0 (0.0%) |
| 75 Years and over | 0 (0.0%) | 4 (44.4%) |
Disability Class by Sex by Age in Thedford
Disability Class: Hearing Difficulty
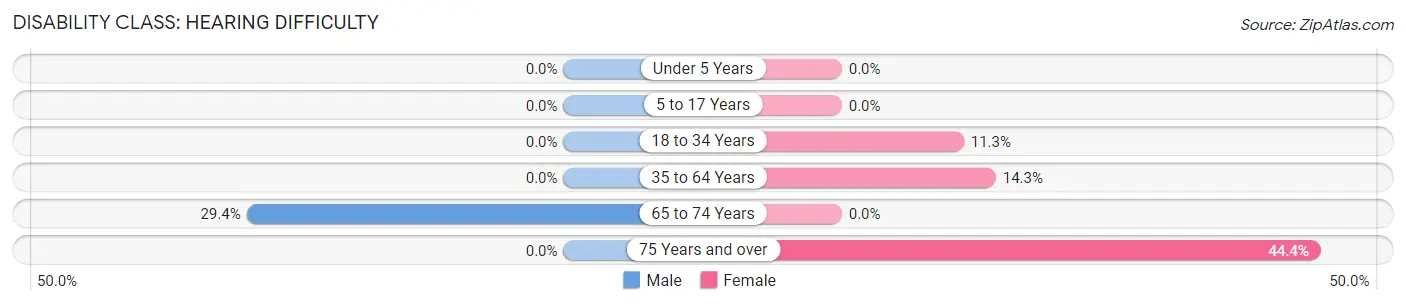
| Age Bracket | Male | Female |
| Under 5 Years | 0 (0.0%) | 0 (0.0%) |
| 5 to 17 Years | 0 (0.0%) | 0 (0.0%) |
| 18 to 34 Years | 0 (0.0%) | 6 (11.3%) |
| 35 to 64 Years | 0 (0.0%) | 3 (14.3%) |
| 65 to 74 Years | 5 (29.4%) | 0 (0.0%) |
| 75 Years and over | 0 (0.0%) | 4 (44.4%) |
Disability Class: Vision Difficulty
| Age Bracket | Male | Female |
| Under 5 Years | 0 (0.0%) | 0 (0.0%) |
| 5 to 17 Years | 0 (0.0%) | 0 (0.0%) |
| 18 to 34 Years | 0 (0.0%) | 0 (0.0%) |
| 35 to 64 Years | 0 (0.0%) | 0 (0.0%) |
| 65 to 74 Years | 0 (0.0%) | 0 (0.0%) |
| 75 Years and over | 0 (0.0%) | 0 (0.0%) |
Disability Class: Cognitive Difficulty
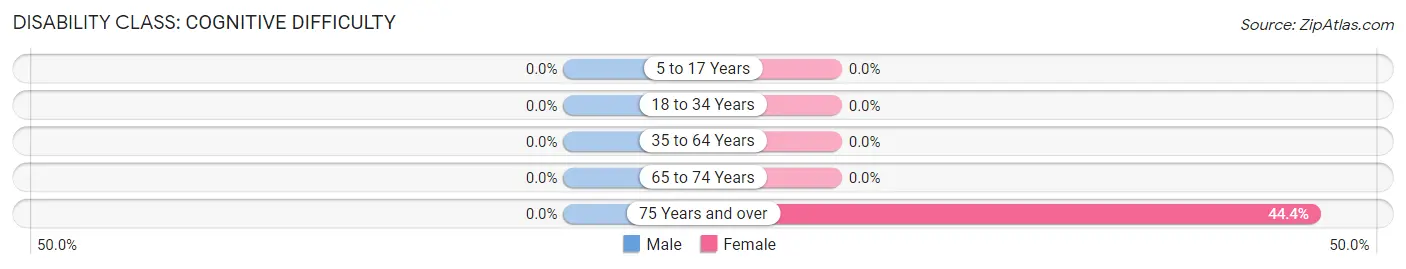
| Age Bracket | Male | Female |
| 5 to 17 Years | 0 (0.0%) | 0 (0.0%) |
| 18 to 34 Years | 0 (0.0%) | 0 (0.0%) |
| 35 to 64 Years | 0 (0.0%) | 0 (0.0%) |
| 65 to 74 Years | 0 (0.0%) | 0 (0.0%) |
| 75 Years and over | 0 (0.0%) | 4 (44.4%) |
Disability Class: Ambulatory Difficulty
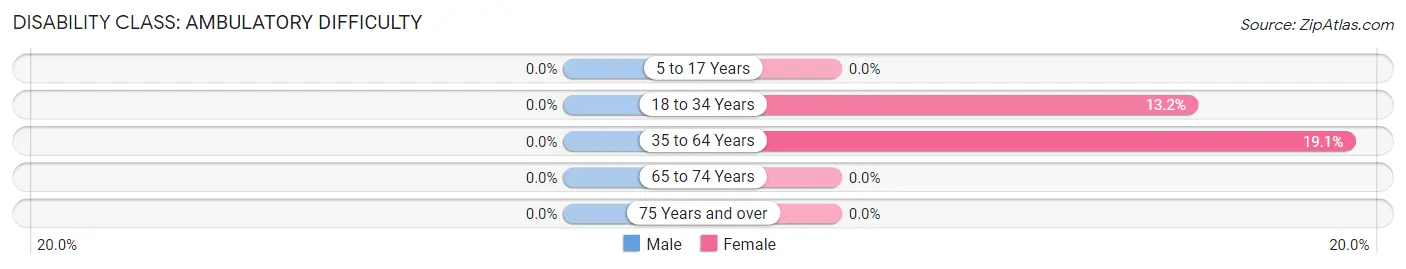
| Age Bracket | Male | Female |
| 5 to 17 Years | 0 (0.0%) | 0 (0.0%) |
| 18 to 34 Years | 0 (0.0%) | 7 (13.2%) |
| 35 to 64 Years | 0 (0.0%) | 4 (19.1%) |
| 65 to 74 Years | 0 (0.0%) | 0 (0.0%) |
| 75 Years and over | 0 (0.0%) | 0 (0.0%) |
Disability Class: Self-Care Difficulty
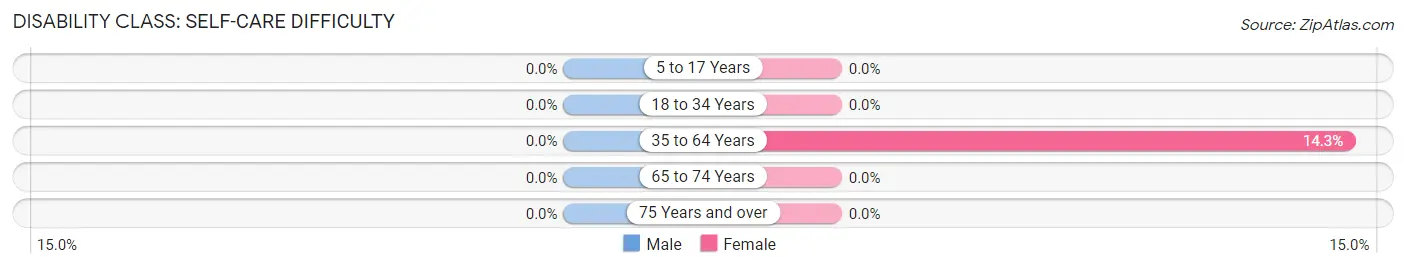
| Age Bracket | Male | Female |
| 5 to 17 Years | 0 (0.0%) | 0 (0.0%) |
| 18 to 34 Years | 0 (0.0%) | 0 (0.0%) |
| 35 to 64 Years | 0 (0.0%) | 3 (14.3%) |
| 65 to 74 Years | 0 (0.0%) | 0 (0.0%) |
| 75 Years and over | 0 (0.0%) | 0 (0.0%) |
Technology Access in Thedford
Computing Device Access in Thedford
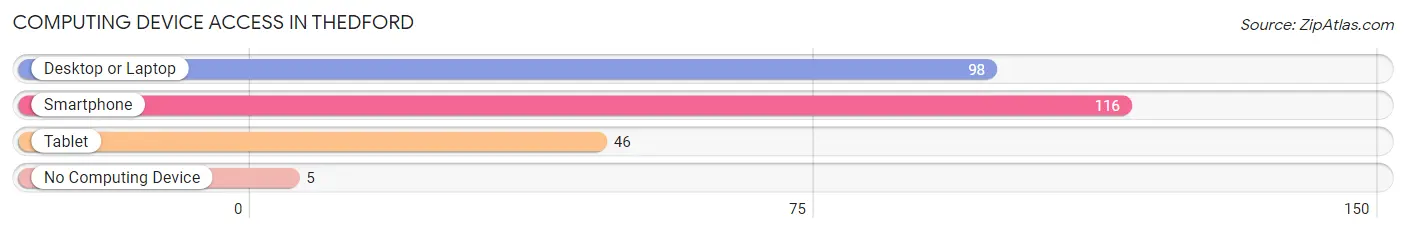
| Device Type | # Households | % Households |
| Desktop or Laptop | 98 | 81.0% |
| Smartphone | 116 | 95.9% |
| Tablet | 46 | 38.0% |
| No Computing Device | 5 | 4.1% |
| Total | 121 | 100.0% |
Internet Access in Thedford
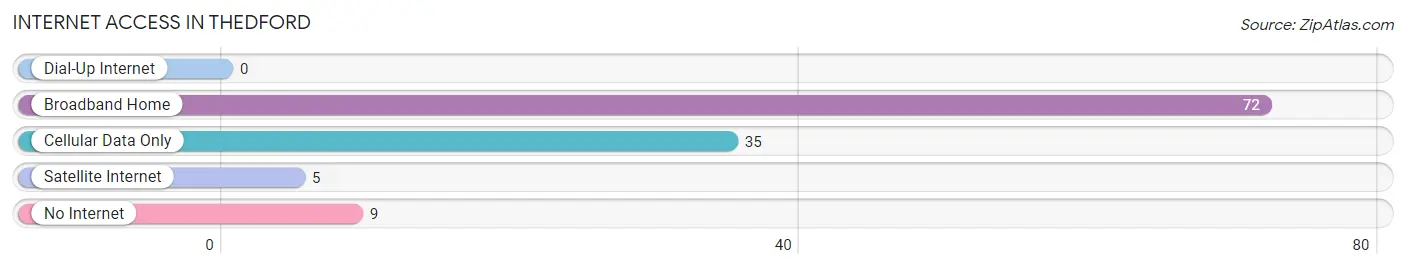
| Internet Type | # Households | % Households |
| Dial-Up Internet | 0 | 0.0% |
| Broadband Home | 72 | 59.5% |
| Cellular Data Only | 35 | 28.9% |
| Satellite Internet | 5 | 4.1% |
| No Internet | 9 | 7.4% |
| Total | 121 | 100.0% |
Thedford Summary
Thedford is a small town located in Thomas County, Nebraska. It is situated in the Sandhills region of the state, and is home to a population of just over 500 people. Thedford is a rural community, and is known for its agricultural and ranching heritage.
History
Thedford was founded in 1887 by a group of settlers from Iowa. The town was named after Thedford, Iowa, the hometown of the settlers. The town was originally a farming community, and the settlers grew wheat, corn, and other crops. The town also had a small sawmill, which provided lumber for the construction of homes and businesses.
In the early 1900s, Thedford began to experience a population boom. This was due to the arrival of the railroad, which allowed for the transportation of goods and people to and from the town. The railroad also allowed for the development of a local economy, and businesses such as a bank, a hotel, and a general store were established.
In the 1920s, Thedford began to experience a decline in population. This was due to the Great Depression, which caused many people to leave the area in search of work. The population of Thedford continued to decline until the 1950s, when the town began to experience a resurgence. This was due to the development of the nearby Sandhills region, which provided jobs and economic opportunities for the residents of Thedford.
Geography
Thedford is located in the Sandhills region of Nebraska. The town is situated in the northern part of Thomas County, and is bordered by the towns of Mullen and Halsey to the north, and the towns of Seneca and Tryon to the south. Thedford is located in the Central Plains region of the United States, and is characterized by flat terrain and rolling hills. The town is located at an elevation of 2,400 feet above sea level.
The climate in Thedford is semi-arid, with hot summers and cold winters. The average temperature in the summer is around 80 degrees Fahrenheit, and the average temperature in the winter is around 20 degrees Fahrenheit. The town receives an average of 16 inches of precipitation per year.
Economy
The economy of Thedford is largely based on agriculture and ranching. The town is home to several large farms and ranches, which produce a variety of crops and livestock. The town is also home to several small businesses, including a grocery store, a hardware store, and a restaurant.
Thedford is also home to a number of tourist attractions, including the Sandhills Museum and the Thedford Historical Society. These attractions draw visitors from all over the state and beyond, and provide an important source of income for the town.
Demographics
As of the 2010 census, Thedford had a population of 514 people. The racial makeup of the town was 97.3% White, 0.4% African American, 0.2% Native American, 0.2% Asian, 0.2% from other races, and 1.9% from two or more races. Hispanic or Latino of any race were 1.2% of the population.
The median income for a household in Thedford was $37,500, and the median income for a family was $41,250. The per capita income for the town was $17,845. About 11.2% of families and 13.2% of the population were below the poverty line, including 16.7% of those under age 18 and 8.3% of those age 65 or over.
Thedford is a small town with a rich history and a strong sense of community. The town is home to a diverse population, and is a great place to live and work. The town is also home to a number of tourist attractions, which draw visitors from all over the state and beyond. Thedford is a great place to call home.
Common Questions
What is Per Capita Income in Thedford?
Per Capita income in Thedford is $38,947.
What is the Median Family Income in Thedford?
Median Family Income in Thedford is $72,321.
What is the Median Household income in Thedford?
Median Household Income in Thedford is $71,174.
What is Income or Wage Gap in Thedford?
Income or Wage Gap in Thedford is 42.8%.
Women in Thedford earn 57.2 cents for every dollar earned by a man.
What is Inequality or Gini Index in Thedford?
Inequality or Gini Index in Thedford is 0.22.
What is the Total Population of Thedford?
Total Population of Thedford is 198.
What is the Total Male Population of Thedford?
Total Male Population of Thedford is 90.
What is the Total Female Population of Thedford?
Total Female Population of Thedford is 108.
What is the Ratio of Males per 100 Females in Thedford?
There are 83.33 Males per 100 Females in Thedford.
What is the Ratio of Females per 100 Males in Thedford?
There are 120.00 Females per 100 Males in Thedford.
What is the Median Population Age in Thedford?
Median Population Age in Thedford is 31.2 Years.
What is the Average Family Size in Thedford
Average Family Size in Thedford is 1.8 People.
What is the Average Household Size in Thedford
Average Household Size in Thedford is 1.6 People.
How Large is the Labor Force in Thedford?
There are 148 People in the Labor Forcein in Thedford.
What is the Percentage of People in the Labor Force in Thedford?
79.1% of People are in the Labor Force in Thedford.
What is the Unemployment Rate in Thedford?
Unemployment Rate in Thedford is 2.0%.