Morse Bluff, NE Map & Demographics
Morse Bluff Map
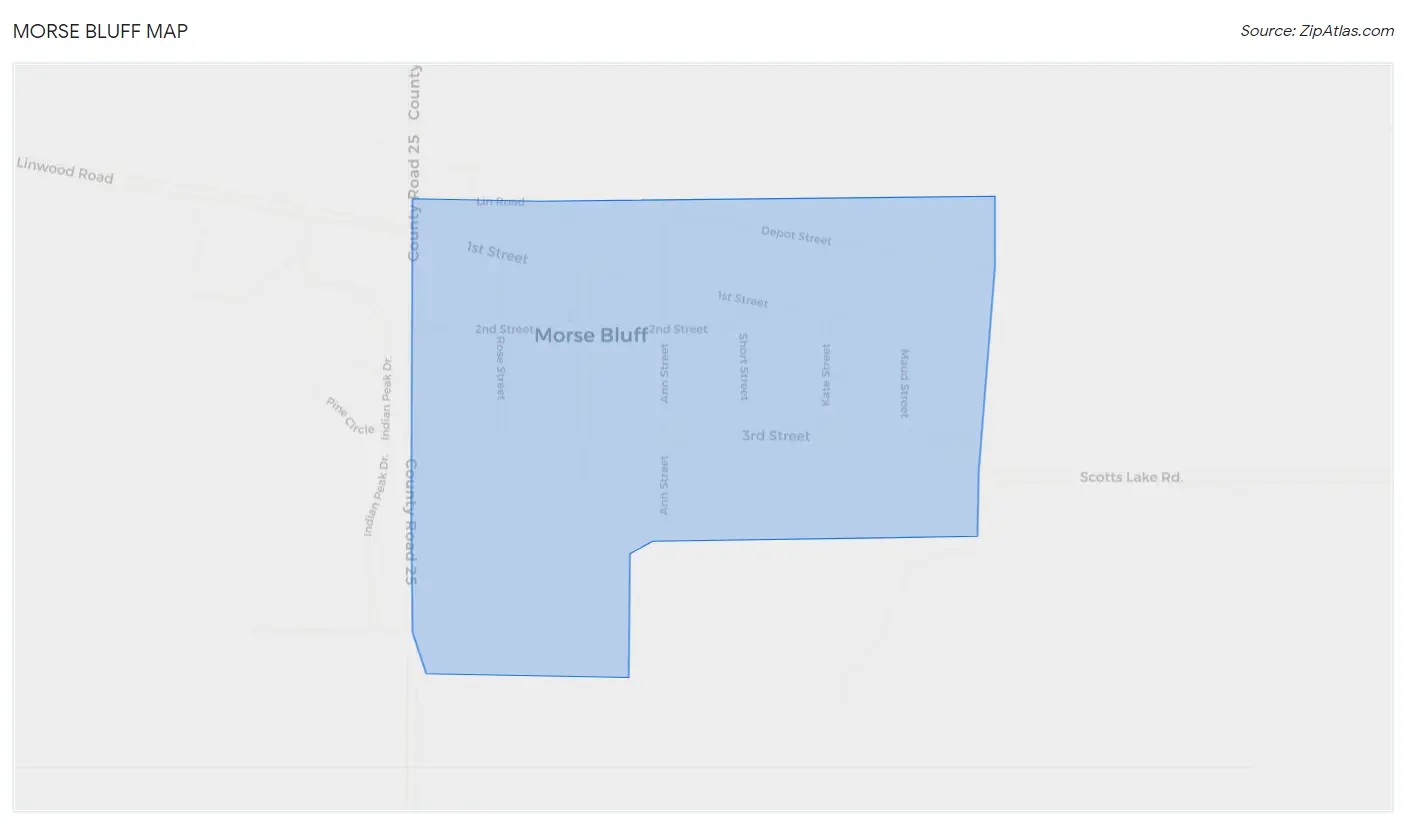
Morse Bluff Overview
$39,053
PER CAPITA INCOME
$98,750
AVG FAMILY INCOME
$70,000
AVG HOUSEHOLD INCOME
18.2%
WAGE / INCOME GAP [ % ]
81.8¢/ $1
WAGE / INCOME GAP [ $ ]
0.33
INEQUALITY / GINI INDEX
75
TOTAL POPULATION
38
MALE POPULATION
37
FEMALE POPULATION
102.70
MALES / 100 FEMALES
97.37
FEMALES / 100 MALES
53.1
MEDIAN AGE
2.5
AVG FAMILY SIZE
1.8
AVG HOUSEHOLD SIZE
42
LABOR FORCE [ PEOPLE ]
61.8%
PERCENT IN LABOR FORCE
Morse Bluff Zip Codes
Morse Bluff Area Codes
Income in Morse Bluff
Income Overview in Morse Bluff
Per Capita Income in Morse Bluff is $39,053, while median incomes of families and households are $98,750 and $70,000 respectively.
| Characteristic | Number | Measure |
| Per Capita Income | 75 | $39,053 |
| Median Family Income | 22 | $98,750 |
| Mean Family Income | 22 | $96,745 |
| Median Household Income | 42 | $70,000 |
| Mean Household Income | 42 | $72,836 |
| Income Deficit | 22 | $0 |
| Wage / Income Gap (%) | 75 | 18.18% |
| Wage / Income Gap ($) | 75 | 81.82¢ per $1 |
| Gini / Inequality Index | 75 | 0.33 |
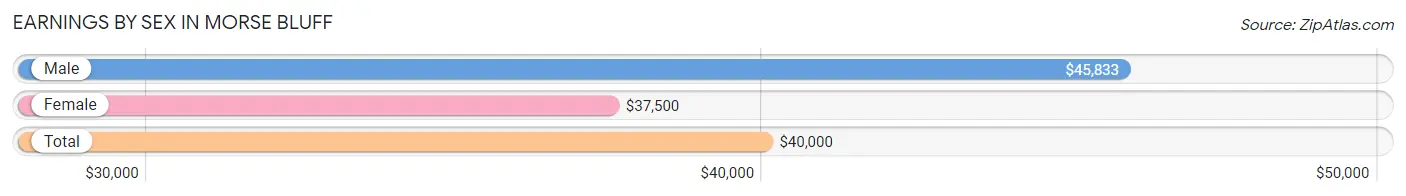
Earnings by Sex in Morse Bluff
Average Earnings in Morse Bluff are $40,000, $45,833 for men and $37,500 for women, a difference of 18.2%.
| Sex | Number | Average Earnings |
| Male | 20 (43.5%) | $45,833 |
| Female | 26 (56.5%) | $37,500 |
| Total | 46 (100.0%) | $40,000 |
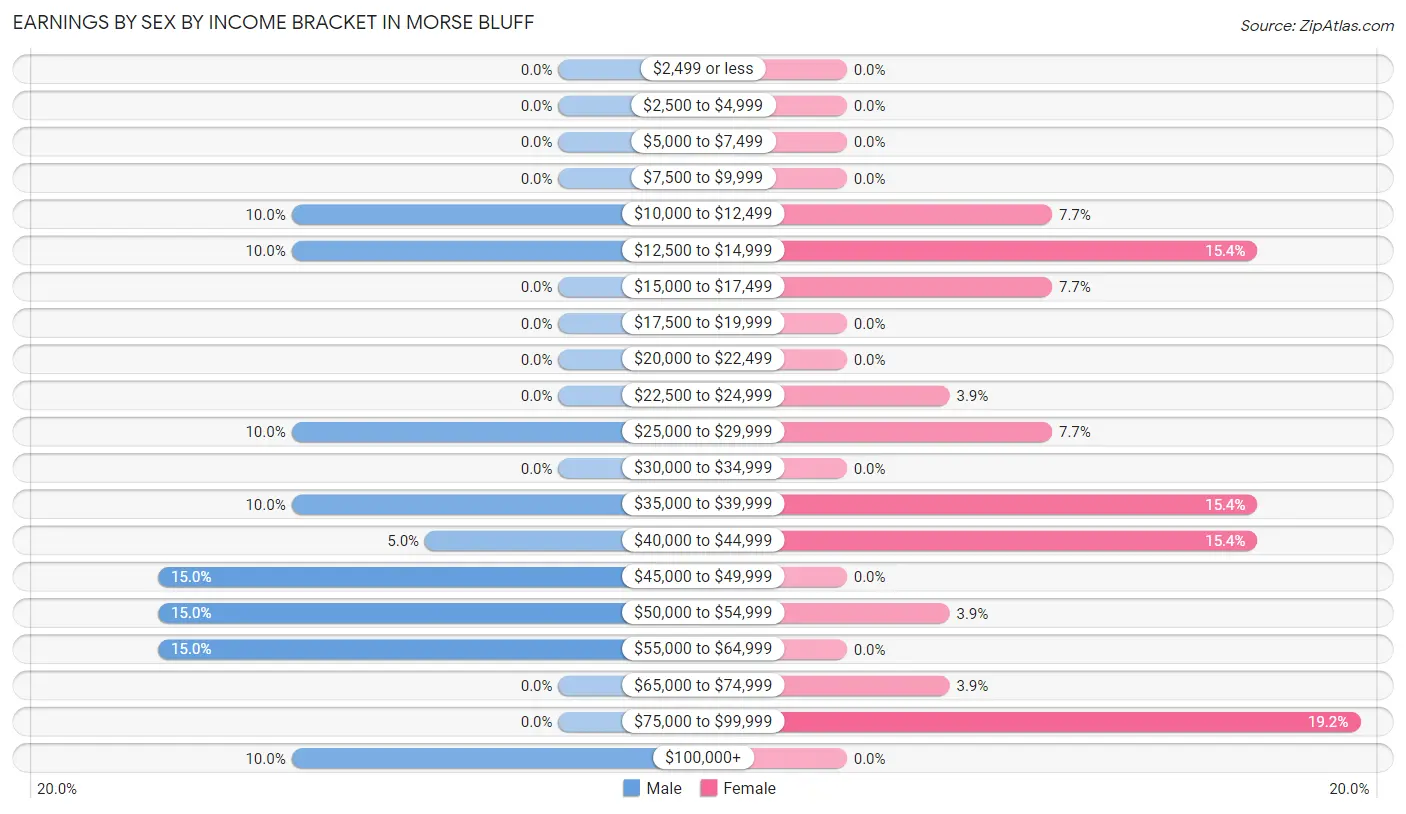
Earnings by Sex by Income Bracket in Morse Bluff
The most common earnings brackets in Morse Bluff are $45,000 to $49,999 for men (3 | 15.0%) and $75,000 to $99,999 for women (5 | 19.2%).
| Income | Male | Female |
| $2,499 or less | 0 (0.0%) | 0 (0.0%) |
| $2,500 to $4,999 | 0 (0.0%) | 0 (0.0%) |
| $5,000 to $7,499 | 0 (0.0%) | 0 (0.0%) |
| $7,500 to $9,999 | 0 (0.0%) | 0 (0.0%) |
| $10,000 to $12,499 | 2 (10.0%) | 2 (7.7%) |
| $12,500 to $14,999 | 2 (10.0%) | 4 (15.4%) |
| $15,000 to $17,499 | 0 (0.0%) | 2 (7.7%) |
| $17,500 to $19,999 | 0 (0.0%) | 0 (0.0%) |
| $20,000 to $22,499 | 0 (0.0%) | 0 (0.0%) |
| $22,500 to $24,999 | 0 (0.0%) | 1 (3.8%) |
| $25,000 to $29,999 | 2 (10.0%) | 2 (7.7%) |
| $30,000 to $34,999 | 0 (0.0%) | 0 (0.0%) |
| $35,000 to $39,999 | 2 (10.0%) | 4 (15.4%) |
| $40,000 to $44,999 | 1 (5.0%) | 4 (15.4%) |
| $45,000 to $49,999 | 3 (15.0%) | 0 (0.0%) |
| $50,000 to $54,999 | 3 (15.0%) | 1 (3.8%) |
| $55,000 to $64,999 | 3 (15.0%) | 0 (0.0%) |
| $65,000 to $74,999 | 0 (0.0%) | 1 (3.8%) |
| $75,000 to $99,999 | 0 (0.0%) | 5 (19.2%) |
| $100,000+ | 2 (10.0%) | 0 (0.0%) |
| Total | 20 (100.0%) | 26 (100.0%) |
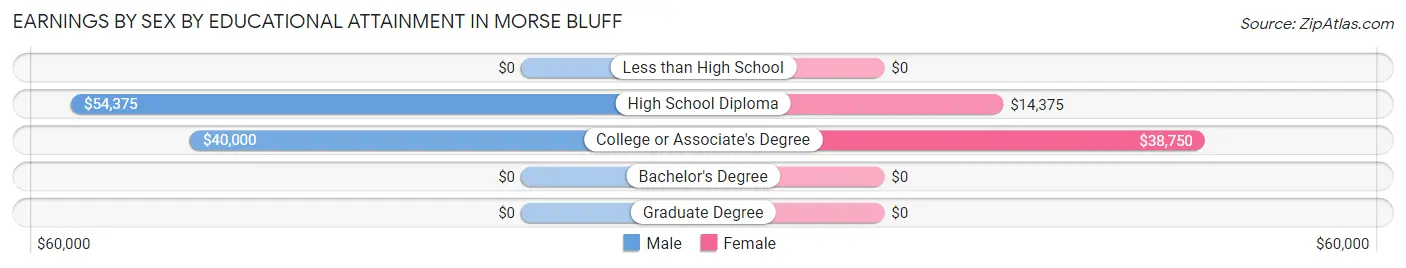
Earnings by Sex by Educational Attainment in Morse Bluff
Average earnings in Morse Bluff are $48,750 for men and $37,500 for women, a difference of 23.1%. Men with an educational attainment of high school diploma enjoy the highest average annual earnings of $54,375, while those with college or associate's degree education earn the least with $40,000. Women with an educational attainment of college or associate's degree earn the most with the average annual earnings of $38,750, while those with high school diploma education have the smallest earnings of $14,375.
| Educational Attainment | Male Income | Female Income |
| Less than High School | - | - |
| High School Diploma | $54,375 | $14,375 |
| College or Associate's Degree | $40,000 | $38,750 |
| Bachelor's Degree | - | - |
| Graduate Degree | - | - |
| Total | $48,750 | $37,500 |
Family Income in Morse Bluff
Family Income Brackets in Morse Bluff
According to the Morse Bluff family income data, there are 9 families falling into the $50,000 to $74,999 income range, which is the most common income bracket and makes up 40.9% of all families.
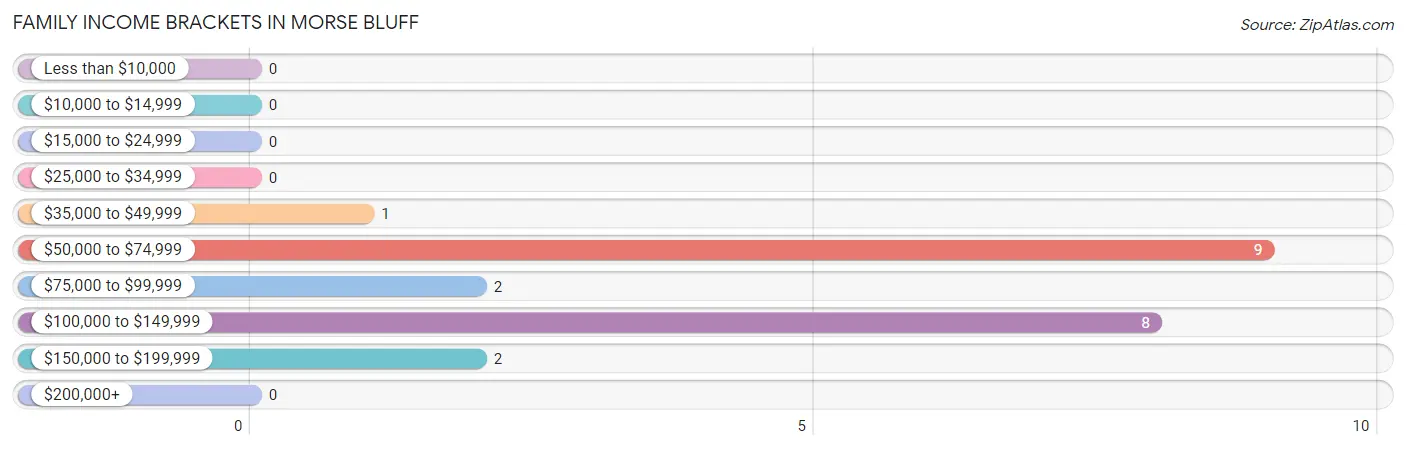
| Income Bracket | # Families | % Families |
| Less than $10,000 | 0 | 0.0% |
| $10,000 to $14,999 | 0 | 0.0% |
| $15,000 to $24,999 | 0 | 0.0% |
| $25,000 to $34,999 | 0 | 0.0% |
| $35,000 to $49,999 | 1 | 4.5% |
| $50,000 to $74,999 | 9 | 40.9% |
| $75,000 to $99,999 | 2 | 9.1% |
| $100,000 to $149,999 | 8 | 36.4% |
| $150,000 to $199,999 | 2 | 9.1% |
| $200,000+ | 0 | 0.0% |
Family Income by Famaliy Size in Morse Bluff
2-person families (16 | 72.7%) account for the highest median family income in Morse Bluff with $86,250 per family, while 2-person families (16 | 72.7%) have the highest median income of $43,125 per family member.
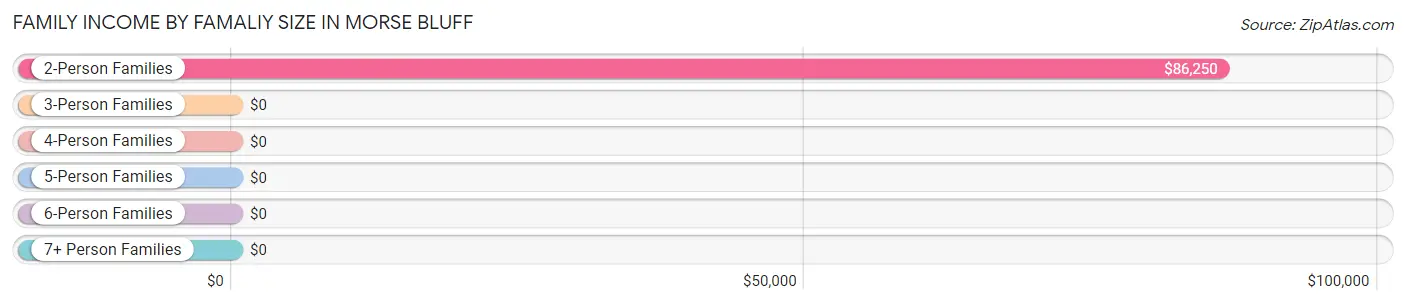
| Income Bracket | # Families | Median Income |
| 2-Person Families | 16 (72.7%) | $86,250 |
| 3-Person Families | 2 (9.1%) | $0 |
| 4-Person Families | 2 (9.1%) | $0 |
| 5-Person Families | 2 (9.1%) | $0 |
| 6-Person Families | 0 (0.0%) | $0 |
| 7+ Person Families | 0 (0.0%) | $0 |
| Total | 22 (100.0%) | $98,750 |
Family Income by Number of Earners in Morse Bluff
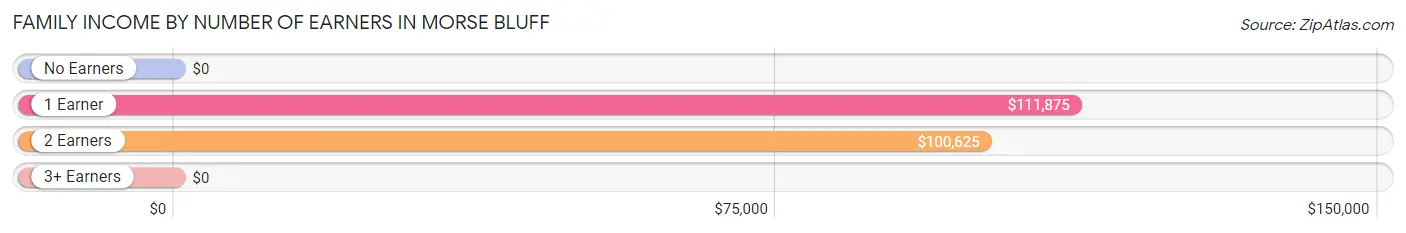
| Number of Earners | # Families | Median Income |
| No Earners | 4 (18.2%) | $0 |
| 1 Earner | 7 (31.8%) | $111,875 |
| 2 Earners | 9 (40.9%) | $100,625 |
| 3+ Earners | 2 (9.1%) | $0 |
| Total | 22 (100.0%) | $98,750 |
Household Income in Morse Bluff
Household Income Brackets in Morse Bluff
With 11 households falling in the category, the $50,000 to $74,999 income range is the most frequent in Morse Bluff, accounting for 26.2% of all households.
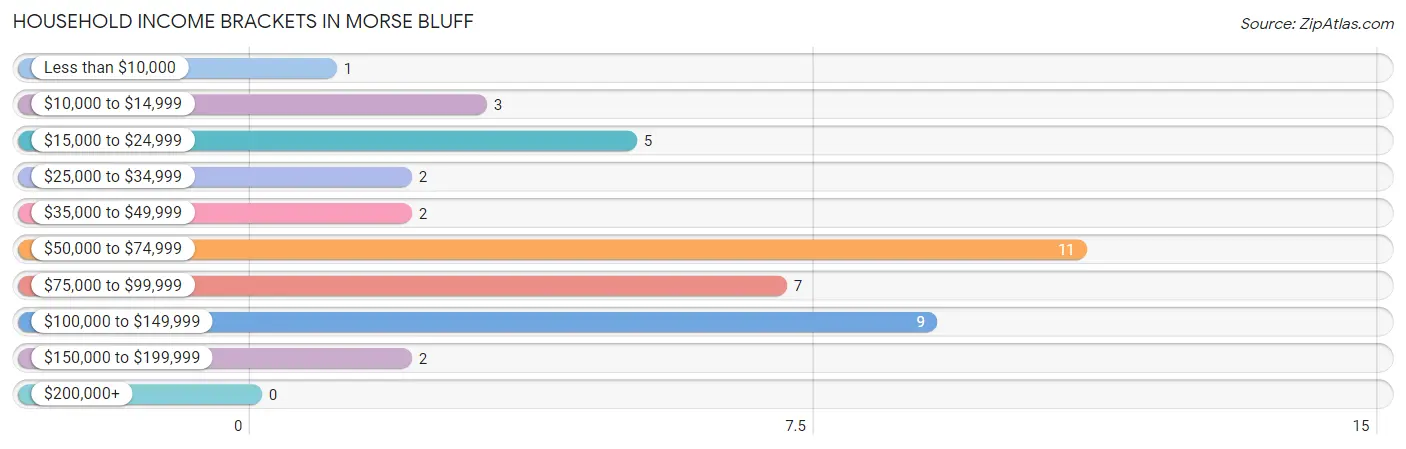
| Income Bracket | # Households | % Households |
| Less than $10,000 | 1 | 2.4% |
| $10,000 to $14,999 | 3 | 7.1% |
| $15,000 to $24,999 | 5 | 11.9% |
| $25,000 to $34,999 | 2 | 4.8% |
| $35,000 to $49,999 | 2 | 4.8% |
| $50,000 to $74,999 | 11 | 26.2% |
| $75,000 to $99,999 | 7 | 16.7% |
| $100,000 to $149,999 | 9 | 21.4% |
| $150,000 to $199,999 | 2 | 4.8% |
| $200,000+ | 0 | 0.0% |
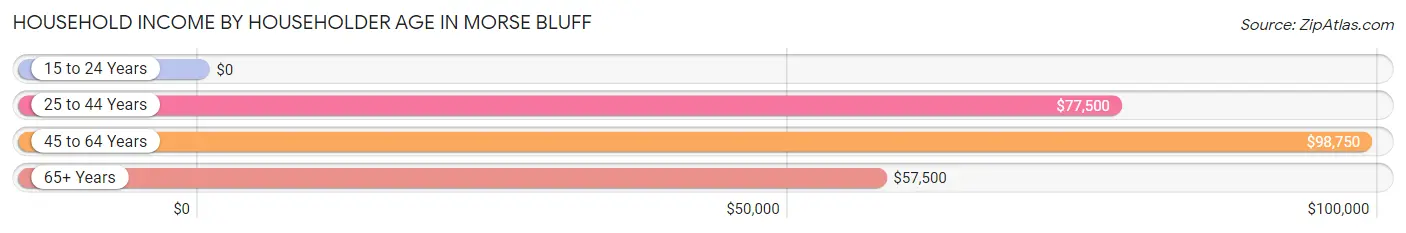
Household Income by Householder Age in Morse Bluff
The median household income in Morse Bluff is $70,000, with the highest median household income of $98,750 found in the 45 to 64 years age bracket for the primary householder. A total of 14 households (33.3%) fall into this category.
| Income Bracket | # Households | Median Income |
| 15 to 24 Years | 0 (0.0%) | $0 |
| 25 to 44 Years | 14 (33.3%) | $77,500 |
| 45 to 64 Years | 14 (33.3%) | $98,750 |
| 65+ Years | 14 (33.3%) | $57,500 |
| Total | 42 (100.0%) | $70,000 |
Poverty in Morse Bluff
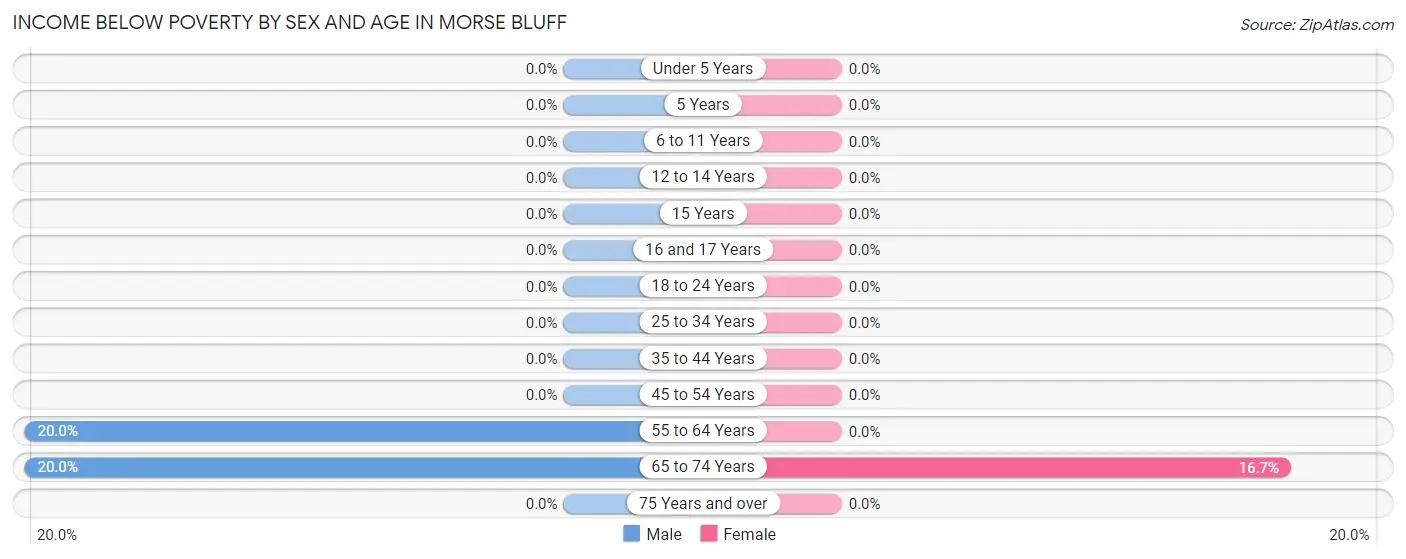
Income Below Poverty by Sex and Age in Morse Bluff
With 7.9% poverty level for males and 2.7% for females among the residents of Morse Bluff, 55 to 64 year old males and 65 to 74 year old females are the most vulnerable to poverty, with 2 males (20.0%) and 1 females (16.7%) in their respective age groups living below the poverty level.
| Age Bracket | Male | Female |
| Under 5 Years | 0 (0.0%) | 0 (0.0%) |
| 5 Years | 0 (0.0%) | 0 (0.0%) |
| 6 to 11 Years | 0 (0.0%) | 0 (0.0%) |
| 12 to 14 Years | 0 (0.0%) | 0 (0.0%) |
| 15 Years | 0 (0.0%) | 0 (0.0%) |
| 16 and 17 Years | 0 (0.0%) | 0 (0.0%) |
| 18 to 24 Years | 0 (0.0%) | 0 (0.0%) |
| 25 to 34 Years | 0 (0.0%) | 0 (0.0%) |
| 35 to 44 Years | 0 (0.0%) | 0 (0.0%) |
| 45 to 54 Years | 0 (0.0%) | 0 (0.0%) |
| 55 to 64 Years | 2 (20.0%) | 0 (0.0%) |
| 65 to 74 Years | 1 (20.0%) | 1 (16.7%) |
| 75 Years and over | 0 (0.0%) | 0 (0.0%) |
| Total | 3 (7.9%) | 1 (2.7%) |
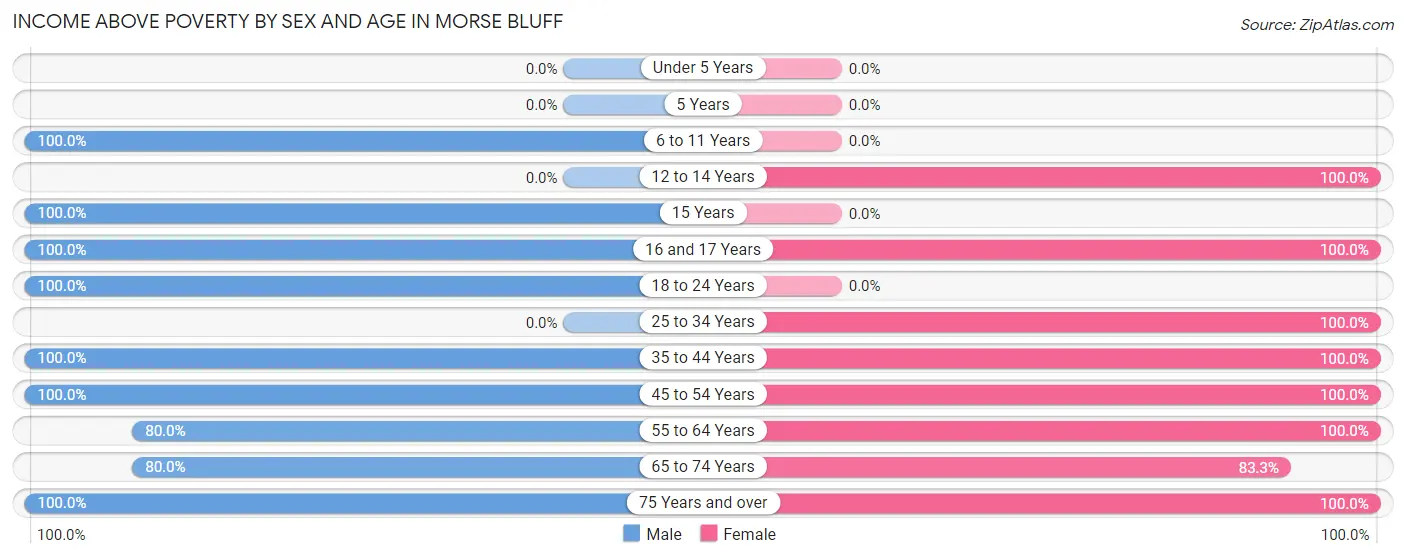
Income Above Poverty by Sex and Age in Morse Bluff
According to the poverty statistics in Morse Bluff, males aged 6 to 11 years and females aged 12 to 14 years are the age groups that are most secure financially, with 100.0% of males and 100.0% of females in these age groups living above the poverty line.
| Age Bracket | Male | Female |
| Under 5 Years | 0 (0.0%) | 0 (0.0%) |
| 5 Years | 0 (0.0%) | 0 (0.0%) |
| 6 to 11 Years | 2 (100.0%) | 0 (0.0%) |
| 12 to 14 Years | 0 (0.0%) | 2 (100.0%) |
| 15 Years | 3 (100.0%) | 0 (0.0%) |
| 16 and 17 Years | 1 (100.0%) | 1 (100.0%) |
| 18 to 24 Years | 4 (100.0%) | 0 (0.0%) |
| 25 to 34 Years | 0 (0.0%) | 2 (100.0%) |
| 35 to 44 Years | 5 (100.0%) | 11 (100.0%) |
| 45 to 54 Years | 4 (100.0%) | 6 (100.0%) |
| 55 to 64 Years | 8 (80.0%) | 7 (100.0%) |
| 65 to 74 Years | 4 (80.0%) | 5 (83.3%) |
| 75 Years and over | 4 (100.0%) | 2 (100.0%) |
| Total | 35 (92.1%) | 36 (97.3%) |
Income Below Poverty Among Married-Couple Families in Morse Bluff
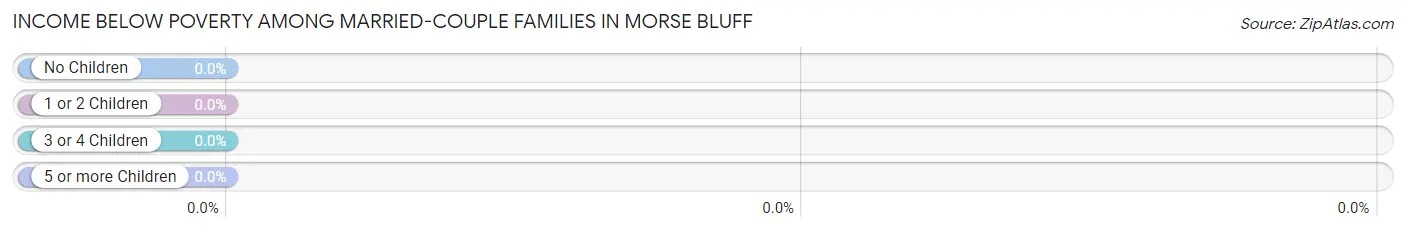
| Children | Above Poverty | Below Poverty |
| No Children | 17 (100.0%) | 0 (0.0%) |
| 1 or 2 Children | 2 (100.0%) | 0 (0.0%) |
| 3 or 4 Children | 2 (100.0%) | 0 (0.0%) |
| 5 or more Children | 0 (0.0%) | 0 (0.0%) |
| Total | 21 (100.0%) | 0 (0.0%) |
Income Below Poverty Among Single-Parent Households in Morse Bluff
| Children | Single Father | Single Mother |
| No Children | 0 (0.0%) | 0 (0.0%) |
| 1 or 2 Children | 0 (0.0%) | 0 (0.0%) |
| 3 or 4 Children | 0 (0.0%) | 0 (0.0%) |
| 5 or more Children | 0 (0.0%) | 0 (0.0%) |
| Total | 0 (0.0%) | 0 (0.0%) |
Income Below Poverty Among Married-Couple vs Single-Parent Households in Morse Bluff
| Children | Married-Couple Families | Single-Parent Households |
| No Children | 0 (0.0%) | 0 (0.0%) |
| 1 or 2 Children | 0 (0.0%) | 0 (0.0%) |
| 3 or 4 Children | 0 (0.0%) | 0 (0.0%) |
| 5 or more Children | 0 (0.0%) | 0 (0.0%) |
| Total | 0 (0.0%) | 0 (0.0%) |
Race in Morse Bluff
The most populous races in Morse Bluff are , and White / Caucasian (75 | 100.0%).
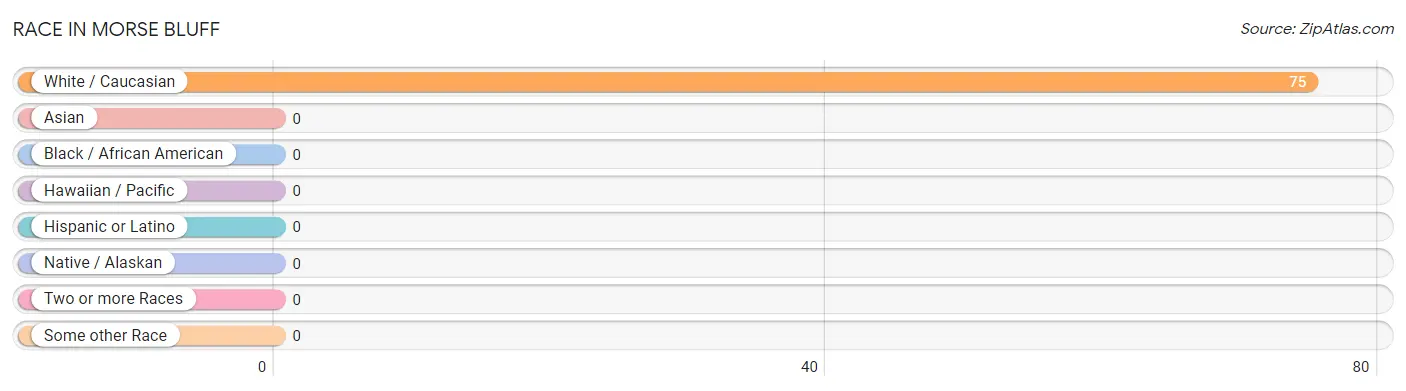
| Race | # Population | % Population |
| Asian | 0 | 0.0% |
| Black / African American | 0 | 0.0% |
| Hawaiian / Pacific | 0 | 0.0% |
| Hispanic or Latino | 0 | 0.0% |
| Native / Alaskan | 0 | 0.0% |
| White / Caucasian | 75 | 100.0% |
| Two or more Races | 0 | 0.0% |
| Some other Race | 0 | 0.0% |
| Total | 75 | 100.0% |
Ancestry in Morse Bluff
The most populous ancestries reported in Morse Bluff are German (33 | 44.0%), Czech (24 | 32.0%), Irish (24 | 32.0%), American (7 | 9.3%), and French (3 | 4.0%), together accounting for 121.3% of all Morse Bluff residents.
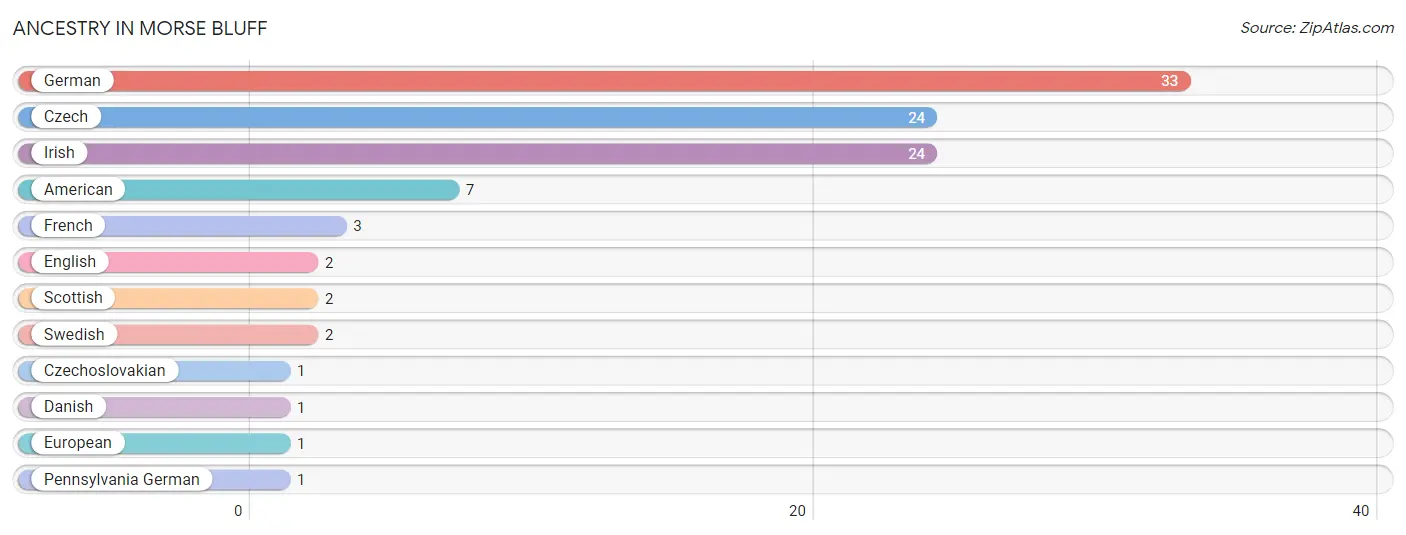
| Ancestry | # Population | % Population |
| American | 7 | 9.3% |
| Czech | 24 | 32.0% |
| Czechoslovakian | 1 | 1.3% |
| Danish | 1 | 1.3% |
| English | 2 | 2.7% |
| European | 1 | 1.3% |
| French | 3 | 4.0% |
| German | 33 | 44.0% |
| Irish | 24 | 32.0% |
| Pennsylvania German | 1 | 1.3% |
| Scottish | 2 | 2.7% |
| Swedish | 2 | 2.7% | View All 12 Rows |
Immigrants in Morse Bluff

| Immigration Origin | # Population | % Population | View All 0 Rows |
Sex and Age in Morse Bluff
Sex and Age in Morse Bluff
The most populous age groups in Morse Bluff are 60 to 64 Years (9 | 23.7%) for men and 40 to 44 Years (9 | 24.3%) for women.
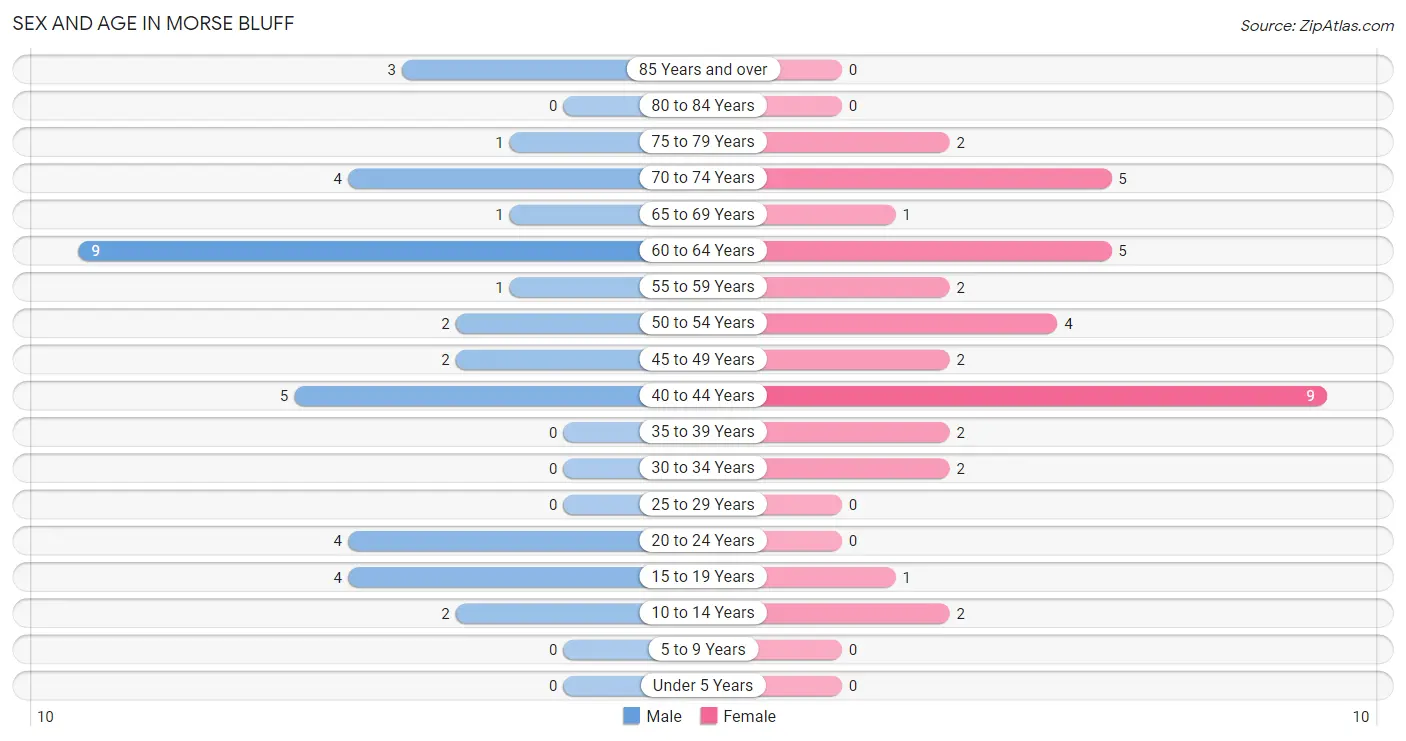
| Age Bracket | Male | Female |
| Under 5 Years | 0 (0.0%) | 0 (0.0%) |
| 5 to 9 Years | 0 (0.0%) | 0 (0.0%) |
| 10 to 14 Years | 2 (5.3%) | 2 (5.4%) |
| 15 to 19 Years | 4 (10.5%) | 1 (2.7%) |
| 20 to 24 Years | 4 (10.5%) | 0 (0.0%) |
| 25 to 29 Years | 0 (0.0%) | 0 (0.0%) |
| 30 to 34 Years | 0 (0.0%) | 2 (5.4%) |
| 35 to 39 Years | 0 (0.0%) | 2 (5.4%) |
| 40 to 44 Years | 5 (13.2%) | 9 (24.3%) |
| 45 to 49 Years | 2 (5.3%) | 2 (5.4%) |
| 50 to 54 Years | 2 (5.3%) | 4 (10.8%) |
| 55 to 59 Years | 1 (2.6%) | 2 (5.4%) |
| 60 to 64 Years | 9 (23.7%) | 5 (13.5%) |
| 65 to 69 Years | 1 (2.6%) | 1 (2.7%) |
| 70 to 74 Years | 4 (10.5%) | 5 (13.5%) |
| 75 to 79 Years | 1 (2.6%) | 2 (5.4%) |
| 80 to 84 Years | 0 (0.0%) | 0 (0.0%) |
| 85 Years and over | 3 (7.9%) | 0 (0.0%) |
| Total | 38 (100.0%) | 37 (100.0%) |
Families and Households in Morse Bluff
Median Family Size in Morse Bluff
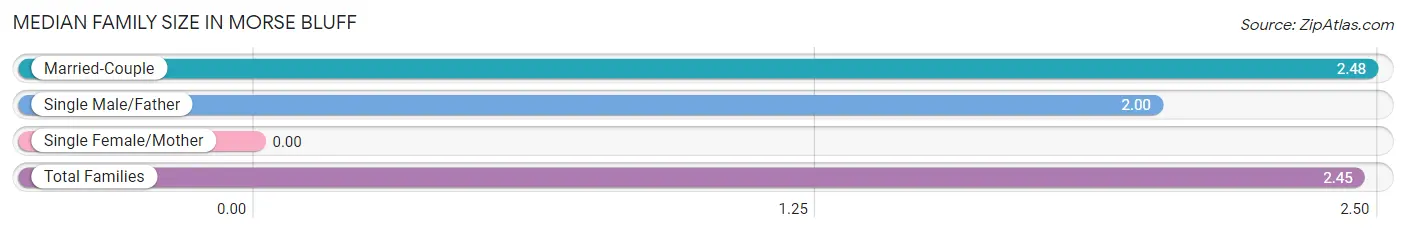
| Family Type | # Families | Family Size |
| Married-Couple | 21 (95.5%) | 2.48 |
| Single Male/Father | 1 (4.5%) | 2.00 |
| Single Female/Mother | 0 (0.0%) | - |
| Total Families | 22 (100.0%) | 2.45 |
Median Household Size in Morse Bluff
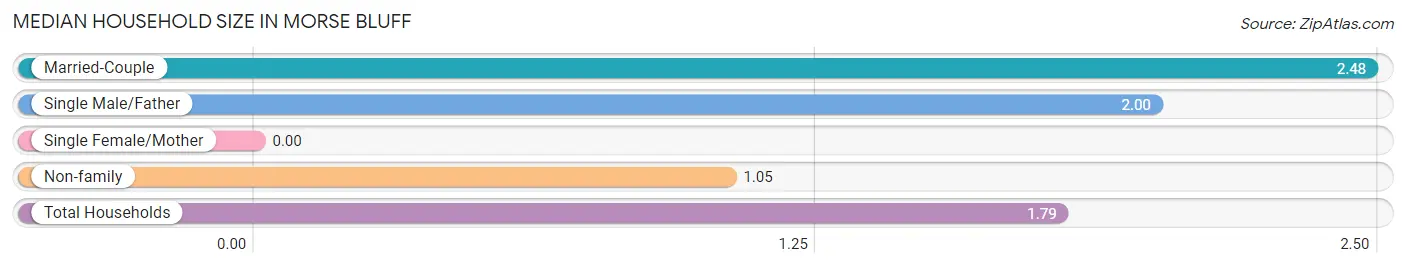
| Household Type | # Households | Household Size |
| Married-Couple | 21 (50.0%) | 2.48 |
| Single Male/Father | 1 (2.4%) | 2.00 |
| Single Female/Mother | 0 (0.0%) | - |
| Non-family | 20 (47.6%) | 1.05 |
| Total Households | 42 (100.0%) | 1.79 |
Household Size by Marriage Status in Morse Bluff
Out of a total of 42 households in Morse Bluff, 22 (52.4%) are family households, while 20 (47.6%) are nonfamily households. The most numerous type of family households are 2-person households, comprising 16, and the most common type of nonfamily households are 1-person households, comprising 19.
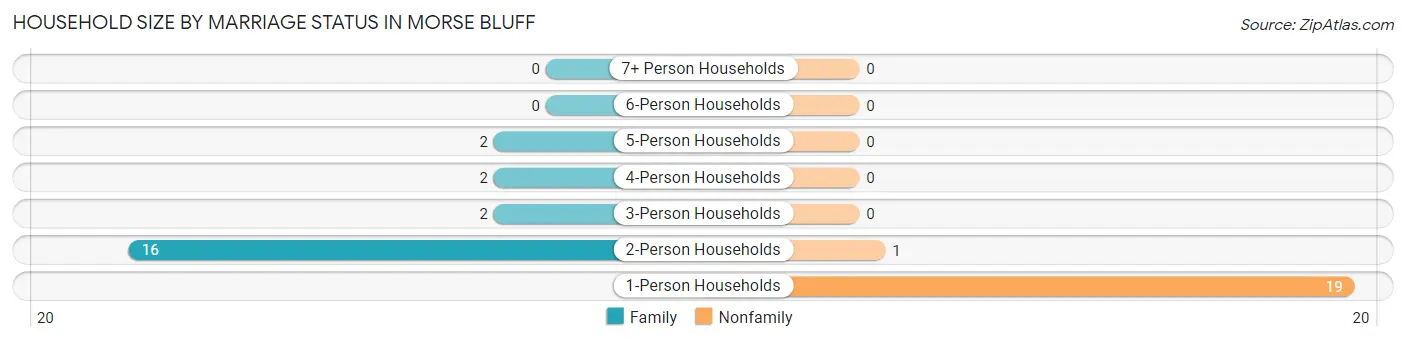
| Household Size | Family Households | Nonfamily Households |
| 1-Person Households | - | 19 (45.2%) |
| 2-Person Households | 16 (38.1%) | 1 (2.4%) |
| 3-Person Households | 2 (4.8%) | 0 (0.0%) |
| 4-Person Households | 2 (4.8%) | 0 (0.0%) |
| 5-Person Households | 2 (4.8%) | 0 (0.0%) |
| 6-Person Households | 0 (0.0%) | 0 (0.0%) |
| 7+ Person Households | 0 (0.0%) | 0 (0.0%) |
| Total | 22 (52.4%) | 20 (47.6%) |
Female Fertility in Morse Bluff
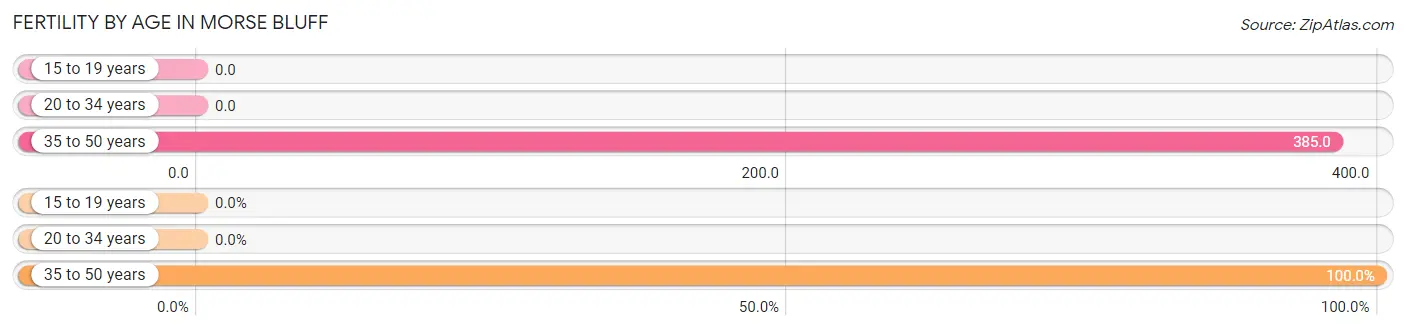
Fertility by Age in Morse Bluff
Average fertility rate in Morse Bluff is 313.0 births per 1,000 women. Women in the age bracket of 35 to 50 years have the highest fertility rate with 385.0 births per 1,000 women. Women in the age bracket of 35 to 50 years acount for 100.0% of all women with births.
| Age Bracket | Women with Births | Births / 1,000 Women |
| 15 to 19 years | 0 (0.0%) | 0.0 |
| 20 to 34 years | 0 (0.0%) | 0.0 |
| 35 to 50 years | 5 (100.0%) | 385.0 |
| Total | 5 (100.0%) | 313.0 |
Fertility by Age by Marriage Status in Morse Bluff
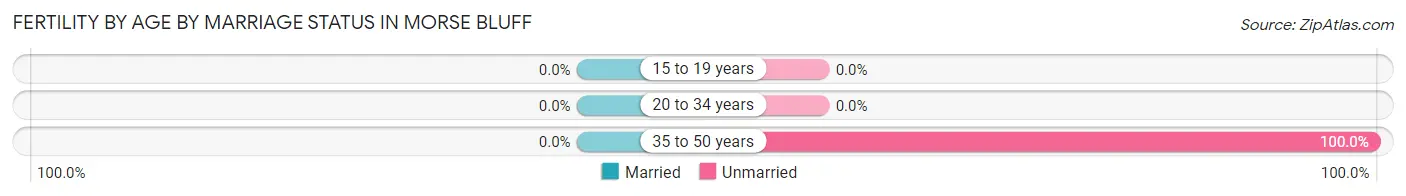
| Age Bracket | Married | Unmarried |
| 15 to 19 years | 0 (0.0%) | 0 (0.0%) |
| 20 to 34 years | 0 (0.0%) | 0 (0.0%) |
| 35 to 50 years | 0 (0.0%) | 5 (100.0%) |
| Total | 0 (0.0%) | 5 (100.0%) |
Fertility by Education in Morse Bluff
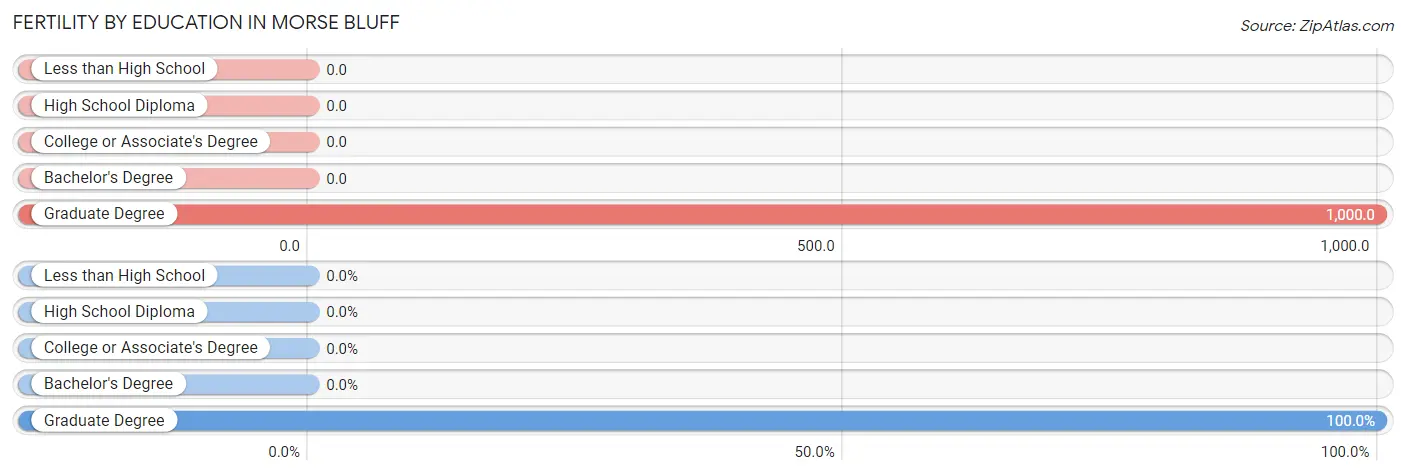
| Educational Attainment | Women with Births | Births / 1,000 Women |
| Less than High School | 0 (0.0%) | 0.0 |
| High School Diploma | 0 (0.0%) | 0.0 |
| College or Associate's Degree | 0 (0.0%) | 0.0 |
| Bachelor's Degree | 0 (0.0%) | 0.0 |
| Graduate Degree | 5 (100.0%) | 1,000.0 |
| Total | 5 (100.0%) | 313.0 |
Fertility by Education by Marriage Status in Morse Bluff
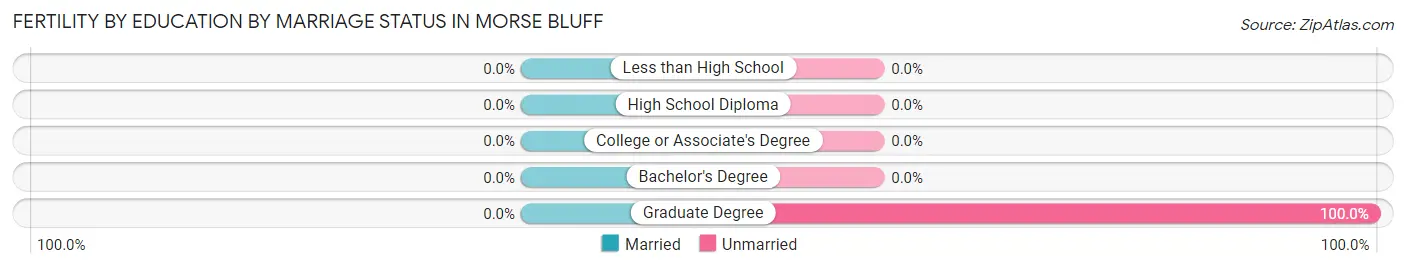
| Educational Attainment | Married | Unmarried |
| Less than High School | 0 (0.0%) | 0 (0.0%) |
| High School Diploma | 0 (0.0%) | 0 (0.0%) |
| College or Associate's Degree | 0 (0.0%) | 0 (0.0%) |
| Bachelor's Degree | 0 (0.0%) | 0 (0.0%) |
| Graduate Degree | 0 (0.0%) | 5 (100.0%) |
| Total | 0 (0.0%) | 5 (100.0%) |
Employment Characteristics in Morse Bluff
Employment by Class of Employer in Morse Bluff
Among the 42 employed individuals in Morse Bluff, private company employees (26 | 61.9%), self-employed (incorporated) (4 | 9.5%), and local government employees (4 | 9.5%) make up the most common classes of employment.
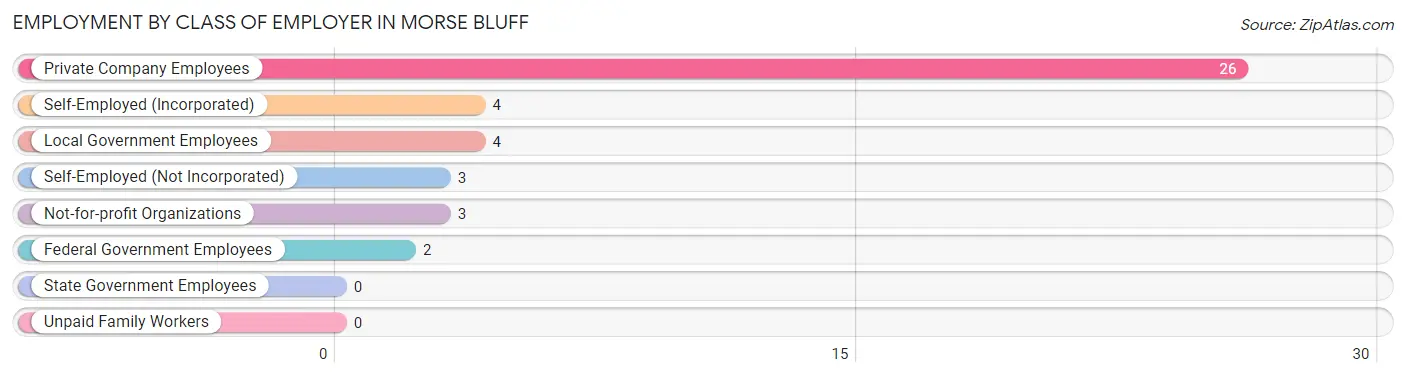
| Employer Class | # Employees | % Employees |
| Private Company Employees | 26 | 61.9% |
| Self-Employed (Incorporated) | 4 | 9.5% |
| Self-Employed (Not Incorporated) | 3 | 7.1% |
| Not-for-profit Organizations | 3 | 7.1% |
| Local Government Employees | 4 | 9.5% |
| State Government Employees | 0 | 0.0% |
| Federal Government Employees | 2 | 4.8% |
| Unpaid Family Workers | 0 | 0.0% |
| Total | 42 | 100.0% |
Employment Status by Age in Morse Bluff
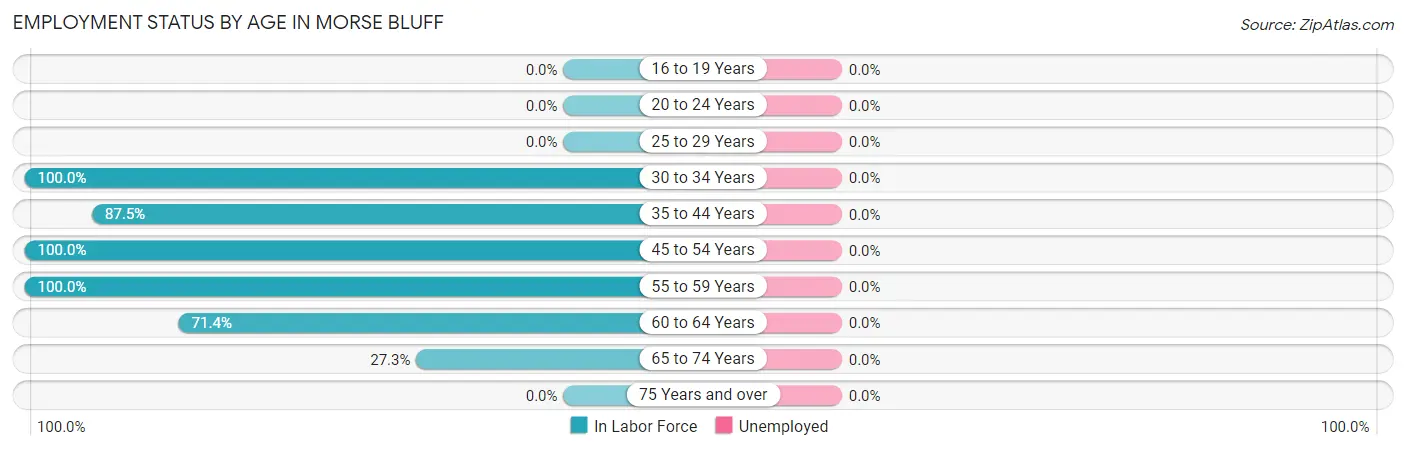
| Age Bracket | In Labor Force | Unemployed |
| 16 to 19 Years | 0 (0.0%) | 0 (0.0%) |
| 20 to 24 Years | 0 (0.0%) | 0 (0.0%) |
| 25 to 29 Years | 0 (0.0%) | 0 (0.0%) |
| 30 to 34 Years | 2 (100.0%) | 0 (0.0%) |
| 35 to 44 Years | 14 (87.5%) | 0 (0.0%) |
| 45 to 54 Years | 10 (100.0%) | 0 (0.0%) |
| 55 to 59 Years | 3 (100.0%) | 0 (0.0%) |
| 60 to 64 Years | 10 (71.4%) | 0 (0.0%) |
| 65 to 74 Years | 3 (27.3%) | 0 (0.0%) |
| 75 Years and over | 0 (0.0%) | 0 (0.0%) |
| Total | 42 (61.8%) | 0 (0.0%) |
Employment Status by Educational Attainment in Morse Bluff
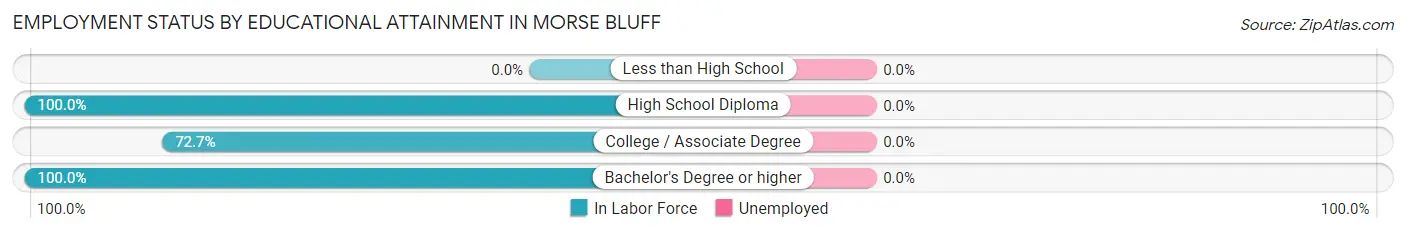
| Educational Attainment | In Labor Force | Unemployed |
| Less than High School | 0 (0.0%) | 0 (0.0%) |
| High School Diploma | 14 (100.0%) | 0 (0.0%) |
| College / Associate Degree | 16 (72.7%) | 0 (0.0%) |
| Bachelor's Degree or higher | 9 (100.0%) | 0 (0.0%) |
| Total | 39 (86.7%) | 0 (0.0%) |
Employment Occupations by Sex in Morse Bluff
Management, Business, Science and Arts Occupations
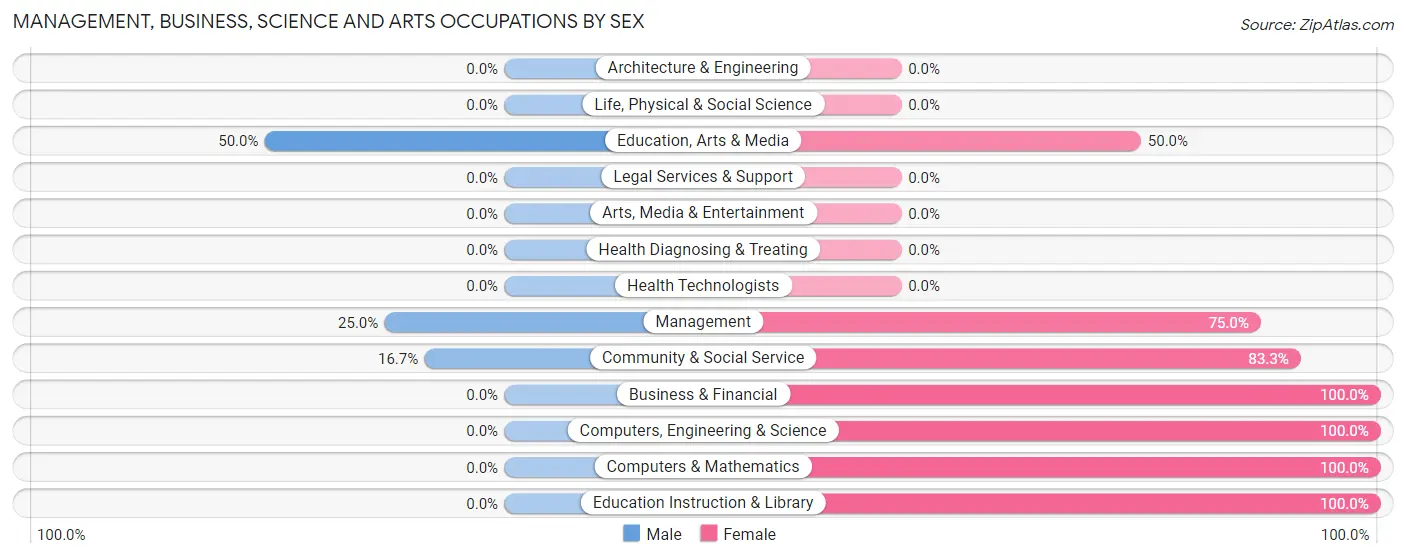
The most common Management, Business, Science and Arts occupations in Morse Bluff are Management (8 | 19.1%), Community & Social Service (6 | 14.3%), Education Instruction & Library (4 | 9.5%), Education, Arts & Media (2 | 4.8%), and Business & Financial (1 | 2.4%).
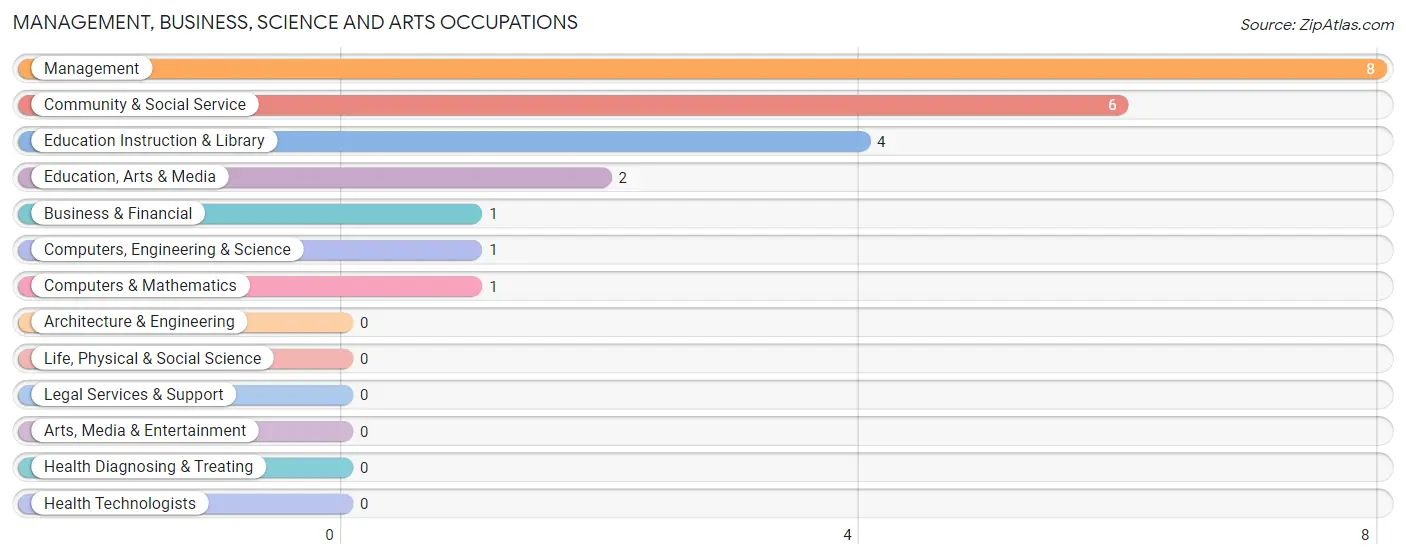
Management, Business, Science and Arts Occupations by Sex
Within the Management, Business, Science and Arts occupations in Morse Bluff, the most male-oriented occupations are Education, Arts & Media (50.0%), Management (25.0%), and Community & Social Service (16.7%), while the most female-oriented occupations are Business & Financial (100.0%), Computers, Engineering & Science (100.0%), and Computers & Mathematics (100.0%).
| Occupation | Male | Female |
| Management | 2 (25.0%) | 6 (75.0%) |
| Business & Financial | 0 (0.0%) | 1 (100.0%) |
| Computers, Engineering & Science | 0 (0.0%) | 1 (100.0%) |
| Computers & Mathematics | 0 (0.0%) | 1 (100.0%) |
| Architecture & Engineering | 0 (0.0%) | 0 (0.0%) |
| Life, Physical & Social Science | 0 (0.0%) | 0 (0.0%) |
| Community & Social Service | 1 (16.7%) | 5 (83.3%) |
| Education, Arts & Media | 1 (50.0%) | 1 (50.0%) |
| Legal Services & Support | 0 (0.0%) | 0 (0.0%) |
| Education Instruction & Library | 0 (0.0%) | 4 (100.0%) |
| Arts, Media & Entertainment | 0 (0.0%) | 0 (0.0%) |
| Health Diagnosing & Treating | 0 (0.0%) | 0 (0.0%) |
| Health Technologists | 0 (0.0%) | 0 (0.0%) |
| Total (Category) | 3 (18.8%) | 13 (81.2%) |
| Total (Overall) | 16 (38.1%) | 26 (61.9%) |
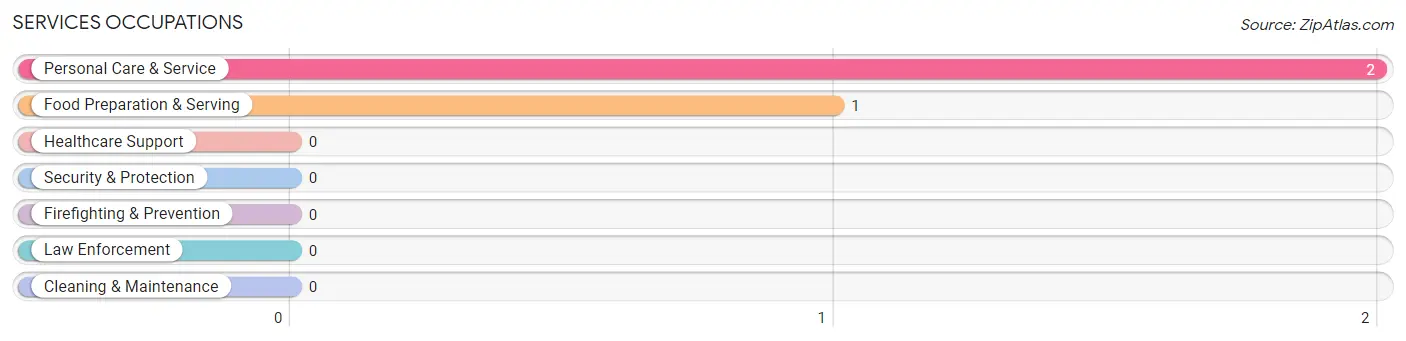
Services Occupations
The most common Services occupations in Morse Bluff are Personal Care & Service (2 | 4.8%), and Food Preparation & Serving (1 | 2.4%).
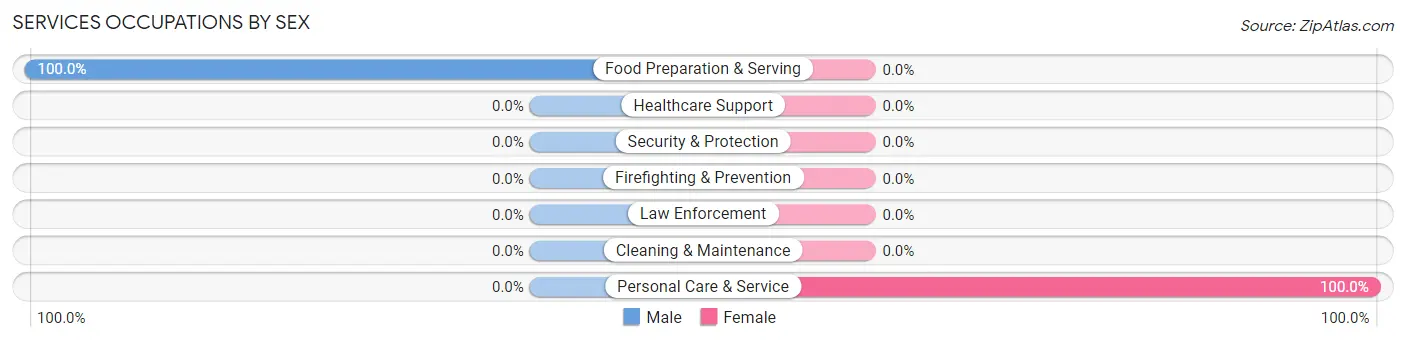
Services Occupations by Sex
| Occupation | Male | Female |
| Healthcare Support | 0 (0.0%) | 0 (0.0%) |
| Security & Protection | 0 (0.0%) | 0 (0.0%) |
| Firefighting & Prevention | 0 (0.0%) | 0 (0.0%) |
| Law Enforcement | 0 (0.0%) | 0 (0.0%) |
| Food Preparation & Serving | 1 (100.0%) | 0 (0.0%) |
| Cleaning & Maintenance | 0 (0.0%) | 0 (0.0%) |
| Personal Care & Service | 0 (0.0%) | 2 (100.0%) |
| Total (Category) | 1 (33.3%) | 2 (66.7%) |
| Total (Overall) | 16 (38.1%) | 26 (61.9%) |
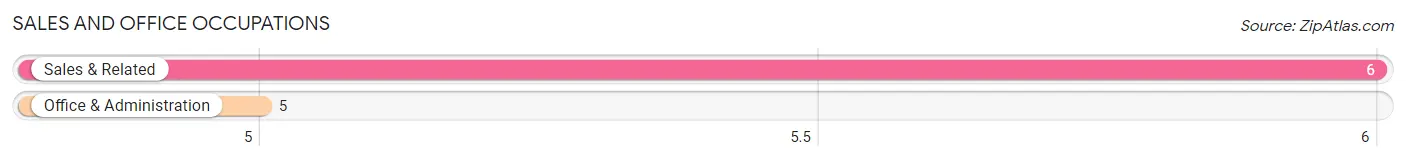
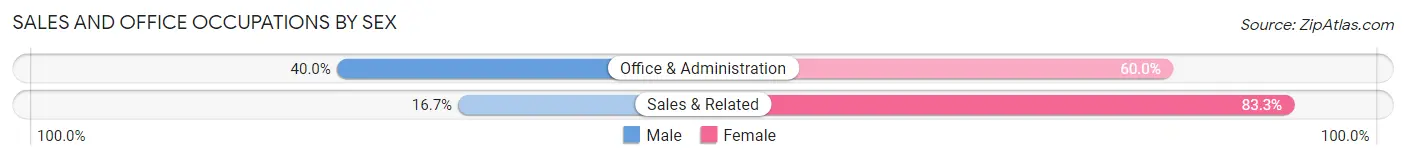
Sales and Office Occupations
The most common Sales and Office occupations in Morse Bluff are Sales & Related (6 | 14.3%), and Office & Administration (5 | 11.9%).
Sales and Office Occupations by Sex
| Occupation | Male | Female |
| Sales & Related | 1 (16.7%) | 5 (83.3%) |
| Office & Administration | 2 (40.0%) | 3 (60.0%) |
| Total (Category) | 3 (27.3%) | 8 (72.7%) |
| Total (Overall) | 16 (38.1%) | 26 (61.9%) |
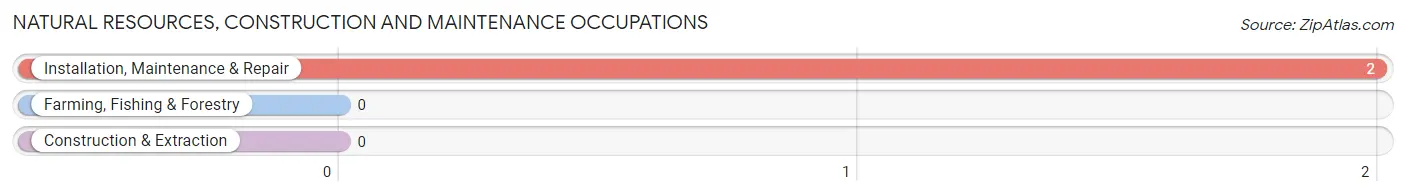
Natural Resources, Construction and Maintenance Occupations
The most common Natural Resources, Construction and Maintenance occupations in Morse Bluff are , and Installation, Maintenance & Repair (2 | 4.8%).
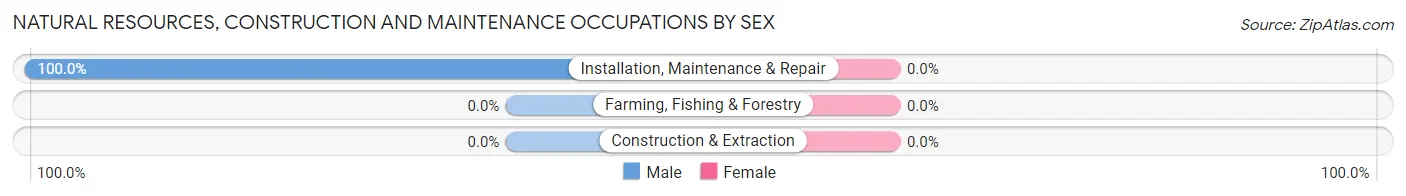
Natural Resources, Construction and Maintenance Occupations by Sex
| Occupation | Male | Female |
| Farming, Fishing & Forestry | 0 (0.0%) | 0 (0.0%) |
| Construction & Extraction | 0 (0.0%) | 0 (0.0%) |
| Installation, Maintenance & Repair | 2 (100.0%) | 0 (0.0%) |
| Total (Category) | 2 (100.0%) | 0 (0.0%) |
| Total (Overall) | 16 (38.1%) | 26 (61.9%) |
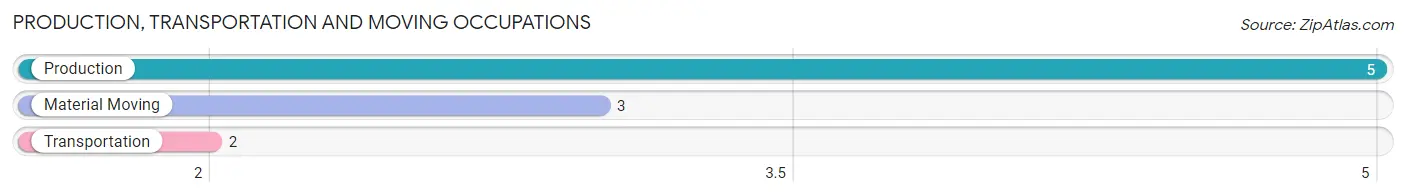
Production, Transportation and Moving Occupations
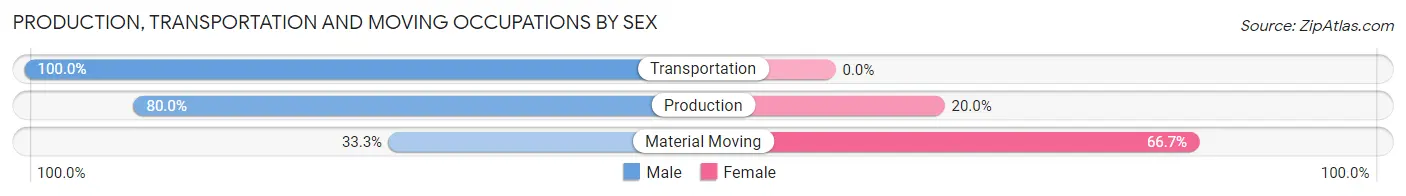
The most common Production, Transportation and Moving occupations in Morse Bluff are Production (5 | 11.9%), Material Moving (3 | 7.1%), and Transportation (2 | 4.8%).
Production, Transportation and Moving Occupations by Sex
| Occupation | Male | Female |
| Production | 4 (80.0%) | 1 (20.0%) |
| Transportation | 2 (100.0%) | 0 (0.0%) |
| Material Moving | 1 (33.3%) | 2 (66.7%) |
| Total (Category) | 7 (70.0%) | 3 (30.0%) |
| Total (Overall) | 16 (38.1%) | 26 (61.9%) |
Employment Industries by Sex in Morse Bluff
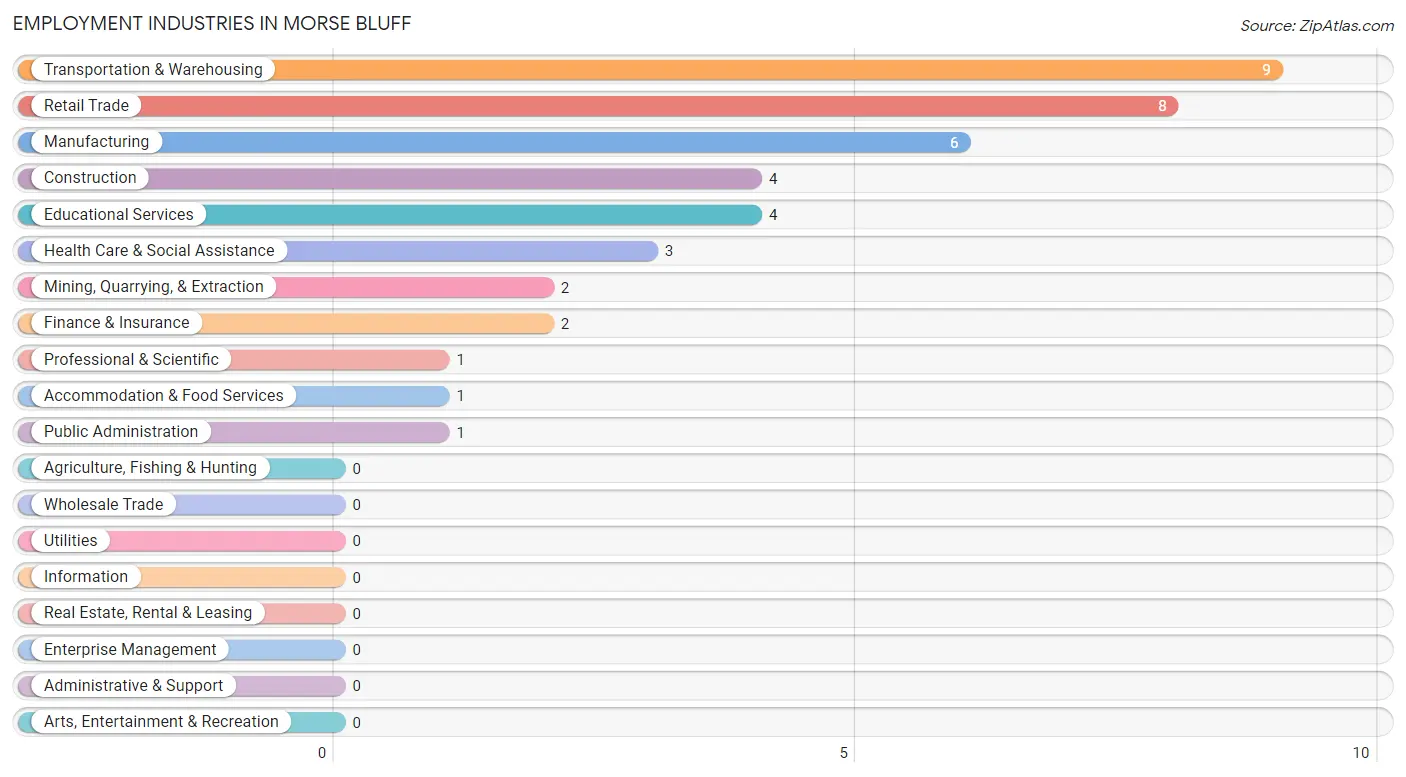
Employment Industries in Morse Bluff
The major employment industries in Morse Bluff include Transportation & Warehousing (9 | 21.4%), Retail Trade (8 | 19.1%), Manufacturing (6 | 14.3%), Construction (4 | 9.5%), and Educational Services (4 | 9.5%).
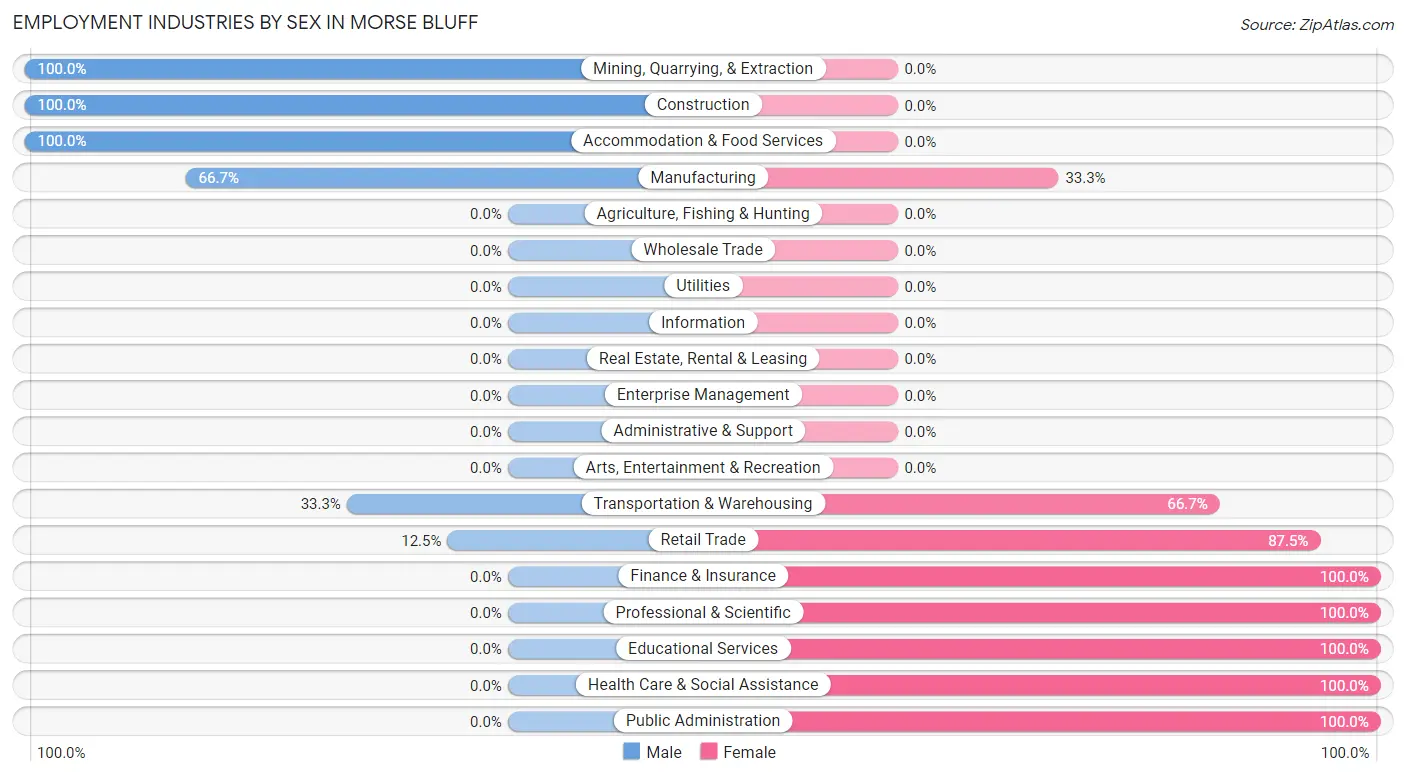
Employment Industries by Sex in Morse Bluff
The Morse Bluff industries that see more men than women are Mining, Quarrying, & Extraction (100.0%), Construction (100.0%), and Accommodation & Food Services (100.0%), whereas the industries that tend to have a higher number of women are Finance & Insurance (100.0%), Professional & Scientific (100.0%), and Educational Services (100.0%).
| Industry | Male | Female |
| Agriculture, Fishing & Hunting | 0 (0.0%) | 0 (0.0%) |
| Mining, Quarrying, & Extraction | 2 (100.0%) | 0 (0.0%) |
| Construction | 4 (100.0%) | 0 (0.0%) |
| Manufacturing | 4 (66.7%) | 2 (33.3%) |
| Wholesale Trade | 0 (0.0%) | 0 (0.0%) |
| Retail Trade | 1 (12.5%) | 7 (87.5%) |
| Transportation & Warehousing | 3 (33.3%) | 6 (66.7%) |
| Utilities | 0 (0.0%) | 0 (0.0%) |
| Information | 0 (0.0%) | 0 (0.0%) |
| Finance & Insurance | 0 (0.0%) | 2 (100.0%) |
| Real Estate, Rental & Leasing | 0 (0.0%) | 0 (0.0%) |
| Professional & Scientific | 0 (0.0%) | 1 (100.0%) |
| Enterprise Management | 0 (0.0%) | 0 (0.0%) |
| Administrative & Support | 0 (0.0%) | 0 (0.0%) |
| Educational Services | 0 (0.0%) | 4 (100.0%) |
| Health Care & Social Assistance | 0 (0.0%) | 3 (100.0%) |
| Arts, Entertainment & Recreation | 0 (0.0%) | 0 (0.0%) |
| Accommodation & Food Services | 1 (100.0%) | 0 (0.0%) |
| Public Administration | 0 (0.0%) | 1 (100.0%) |
| Total | 16 (38.1%) | 26 (61.9%) |
Education in Morse Bluff
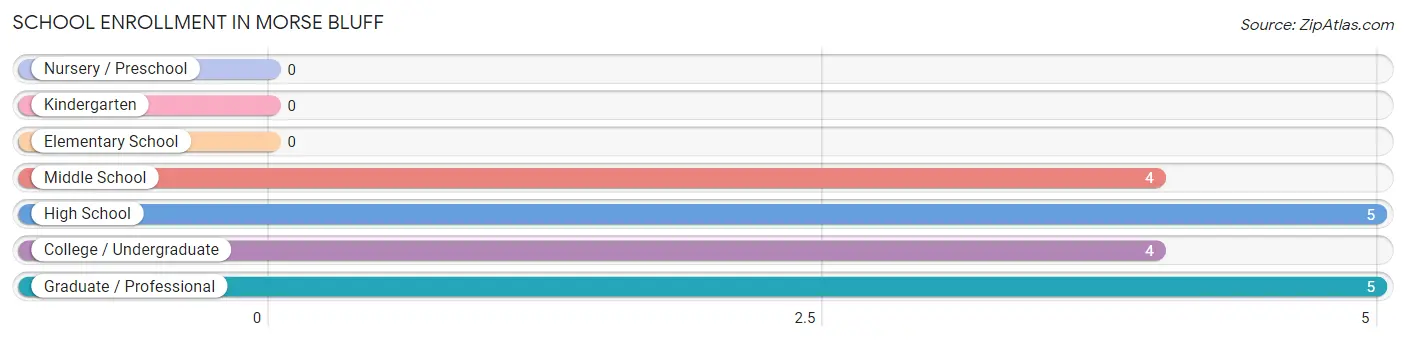
School Enrollment in Morse Bluff
The most common levels of schooling among the 18 students in Morse Bluff are high school (5 | 27.8%), graduate / professional (5 | 27.8%), and middle school (4 | 22.2%).
| School Level | # Students | % Students |
| Nursery / Preschool | 0 | 0.0% |
| Kindergarten | 0 | 0.0% |
| Elementary School | 0 | 0.0% |
| Middle School | 4 | 22.2% |
| High School | 5 | 27.8% |
| College / Undergraduate | 4 | 22.2% |
| Graduate / Professional | 5 | 27.8% |
| Total | 18 | 100.0% |
School Enrollment by Age by Funding Source in Morse Bluff
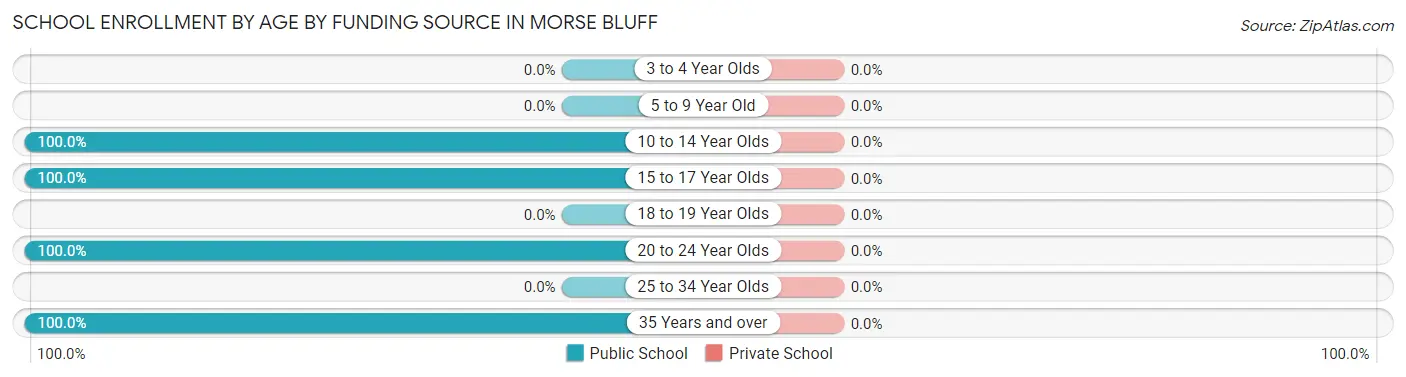
| Age Bracket | Public School | Private School |
| 3 to 4 Year Olds | 0 (0.0%) | 0 (0.0%) |
| 5 to 9 Year Old | 0 (0.0%) | 0 (0.0%) |
| 10 to 14 Year Olds | 4 (100.0%) | 0 (0.0%) |
| 15 to 17 Year Olds | 5 (100.0%) | 0 (0.0%) |
| 18 to 19 Year Olds | 0 (0.0%) | 0 (0.0%) |
| 20 to 24 Year Olds | 4 (100.0%) | 0 (0.0%) |
| 25 to 34 Year Olds | 0 (0.0%) | 0 (0.0%) |
| 35 Years and over | 5 (100.0%) | 0 (0.0%) |
| Total | 18 (100.0%) | 0 (0.0%) |
Educational Attainment by Field of Study in Morse Bluff
Literature & languages (5 | 33.3%), communications (5 | 33.3%), science & technology (2 | 13.3%), liberal arts & history (2 | 13.3%), and business (1 | 6.7%) are the most common fields of study among 15 individuals in Morse Bluff who have obtained a bachelor's degree or higher.
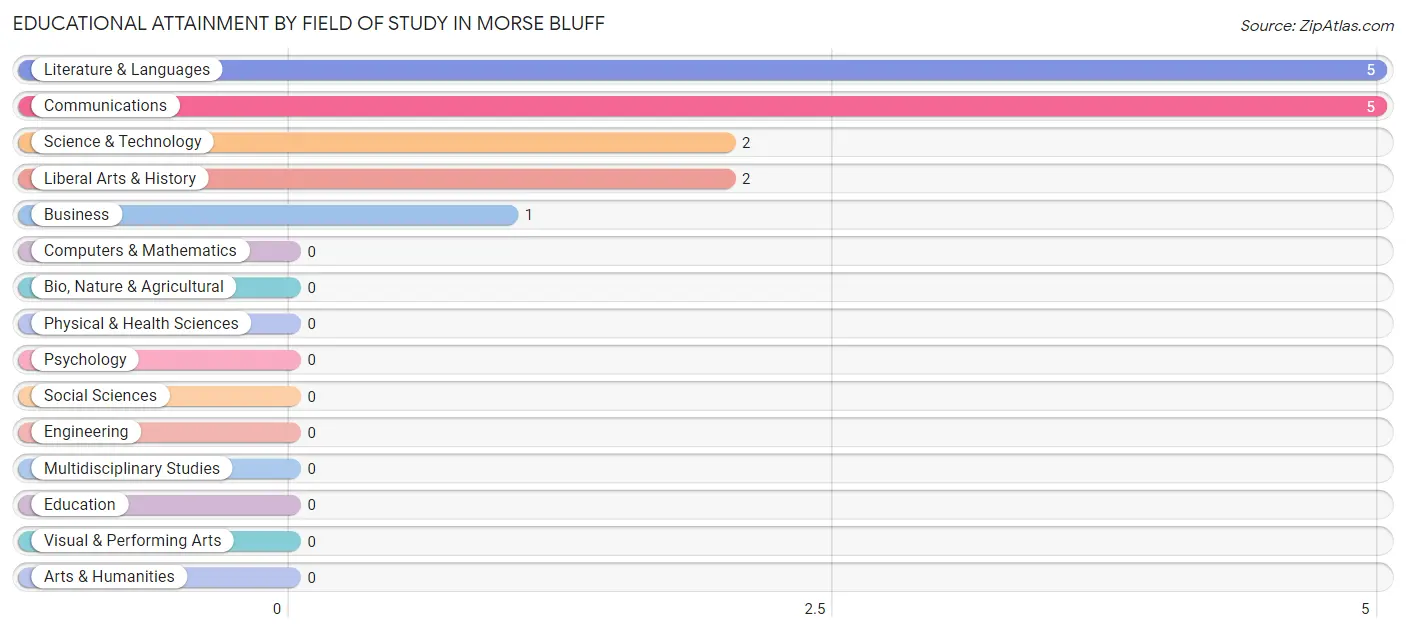
| Field of Study | # Graduates | % Graduates |
| Computers & Mathematics | 0 | 0.0% |
| Bio, Nature & Agricultural | 0 | 0.0% |
| Physical & Health Sciences | 0 | 0.0% |
| Psychology | 0 | 0.0% |
| Social Sciences | 0 | 0.0% |
| Engineering | 0 | 0.0% |
| Multidisciplinary Studies | 0 | 0.0% |
| Science & Technology | 2 | 13.3% |
| Business | 1 | 6.7% |
| Education | 0 | 0.0% |
| Literature & Languages | 5 | 33.3% |
| Liberal Arts & History | 2 | 13.3% |
| Visual & Performing Arts | 0 | 0.0% |
| Communications | 5 | 33.3% |
| Arts & Humanities | 0 | 0.0% |
| Total | 15 | 100.0% |
Transportation & Commute in Morse Bluff
Vehicle Availability by Sex in Morse Bluff
The most prevalent vehicle ownership categories in Morse Bluff are males with 3 vehicles (5, accounting for 31.2%) and females with 3 vehicles (5, making up 19.2%).
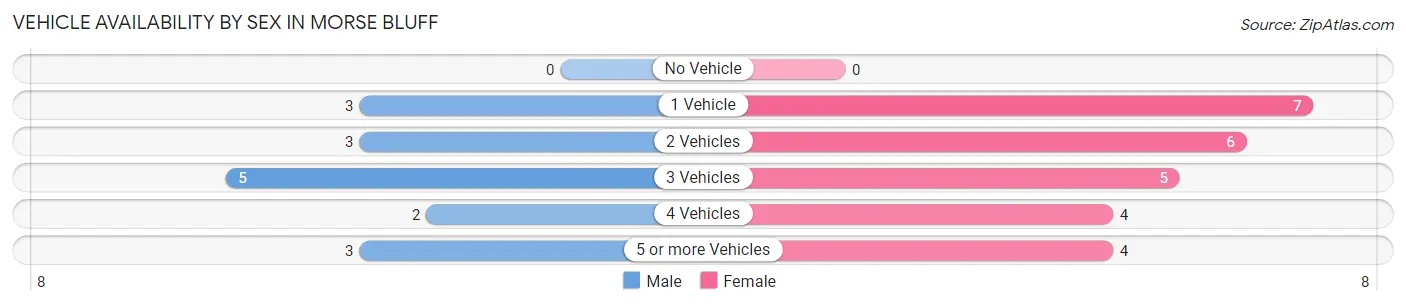
| Vehicles Available | Male | Female |
| No Vehicle | 0 (0.0%) | 0 (0.0%) |
| 1 Vehicle | 3 (18.8%) | 7 (26.9%) |
| 2 Vehicles | 3 (18.8%) | 6 (23.1%) |
| 3 Vehicles | 5 (31.2%) | 5 (19.2%) |
| 4 Vehicles | 2 (12.5%) | 4 (15.4%) |
| 5 or more Vehicles | 3 (18.8%) | 4 (15.4%) |
| Total | 16 (100.0%) | 26 (100.0%) |
Commute Time in Morse Bluff
The most frequently occuring commute durations in Morse Bluff are 10 to 14 minutes (7 commuters, 18.4%), less than 5 minutes (6 commuters, 15.8%), and 25 to 29 minutes (6 commuters, 15.8%).
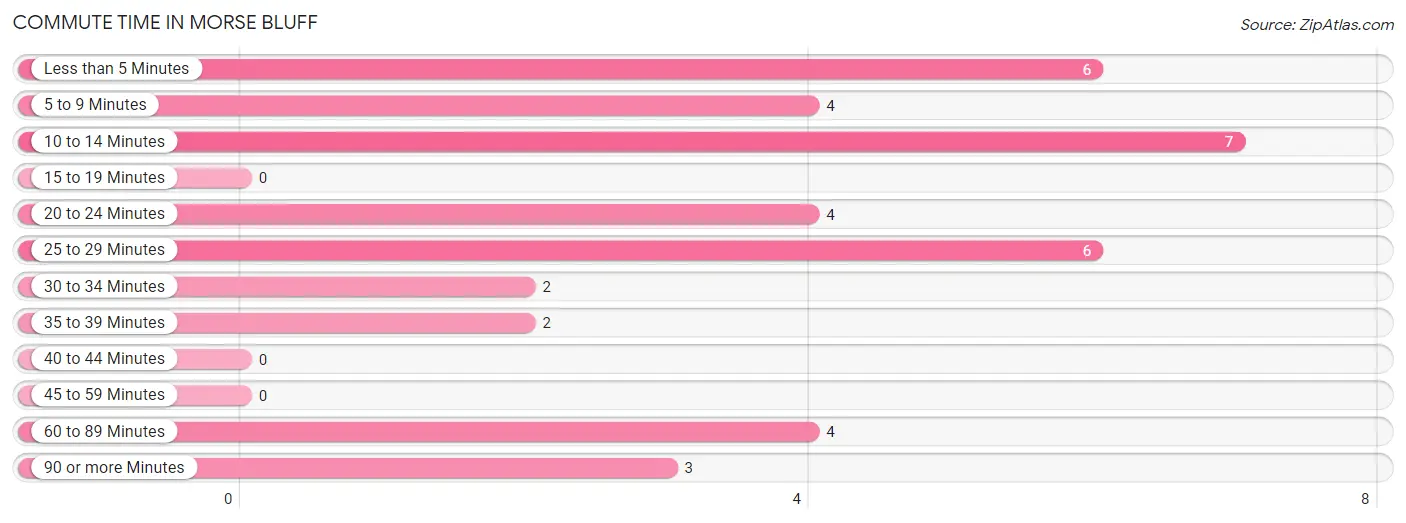
| Commute Time | # Commuters | % Commuters |
| Less than 5 Minutes | 6 | 15.8% |
| 5 to 9 Minutes | 4 | 10.5% |
| 10 to 14 Minutes | 7 | 18.4% |
| 15 to 19 Minutes | 0 | 0.0% |
| 20 to 24 Minutes | 4 | 10.5% |
| 25 to 29 Minutes | 6 | 15.8% |
| 30 to 34 Minutes | 2 | 5.3% |
| 35 to 39 Minutes | 2 | 5.3% |
| 40 to 44 Minutes | 0 | 0.0% |
| 45 to 59 Minutes | 0 | 0.0% |
| 60 to 89 Minutes | 4 | 10.5% |
| 90 or more Minutes | 3 | 7.9% |
Commute Time by Sex in Morse Bluff
The most common commute times in Morse Bluff are 20 to 24 minutes (4 commuters, 26.7%) for males and 10 to 14 minutes (7 commuters, 30.4%) for females.
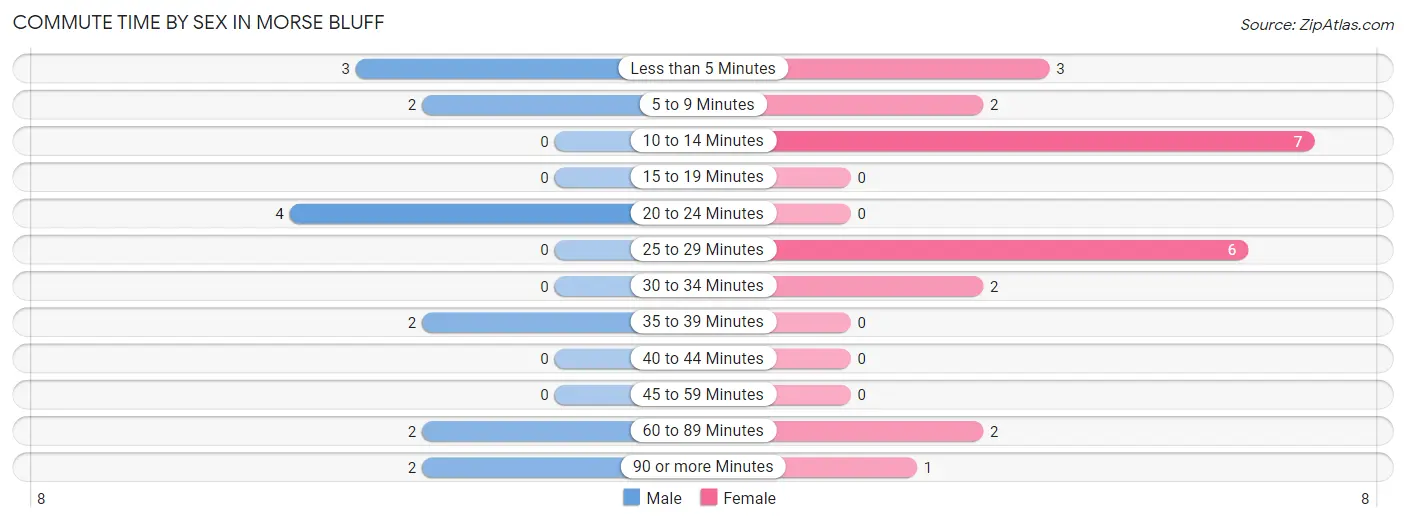
| Commute Time | Male | Female |
| Less than 5 Minutes | 3 (20.0%) | 3 (13.0%) |
| 5 to 9 Minutes | 2 (13.3%) | 2 (8.7%) |
| 10 to 14 Minutes | 0 (0.0%) | 7 (30.4%) |
| 15 to 19 Minutes | 0 (0.0%) | 0 (0.0%) |
| 20 to 24 Minutes | 4 (26.7%) | 0 (0.0%) |
| 25 to 29 Minutes | 0 (0.0%) | 6 (26.1%) |
| 30 to 34 Minutes | 0 (0.0%) | 2 (8.7%) |
| 35 to 39 Minutes | 2 (13.3%) | 0 (0.0%) |
| 40 to 44 Minutes | 0 (0.0%) | 0 (0.0%) |
| 45 to 59 Minutes | 0 (0.0%) | 0 (0.0%) |
| 60 to 89 Minutes | 2 (13.3%) | 2 (8.7%) |
| 90 or more Minutes | 2 (13.3%) | 1 (4.3%) |
Time of Departure to Work by Sex in Morse Bluff
The most frequent times of departure to work in Morse Bluff are 6:00 AM to 6:29 AM (5, 33.3%) for males and 4:00 PM to 11:59 PM (5, 21.7%) for females.
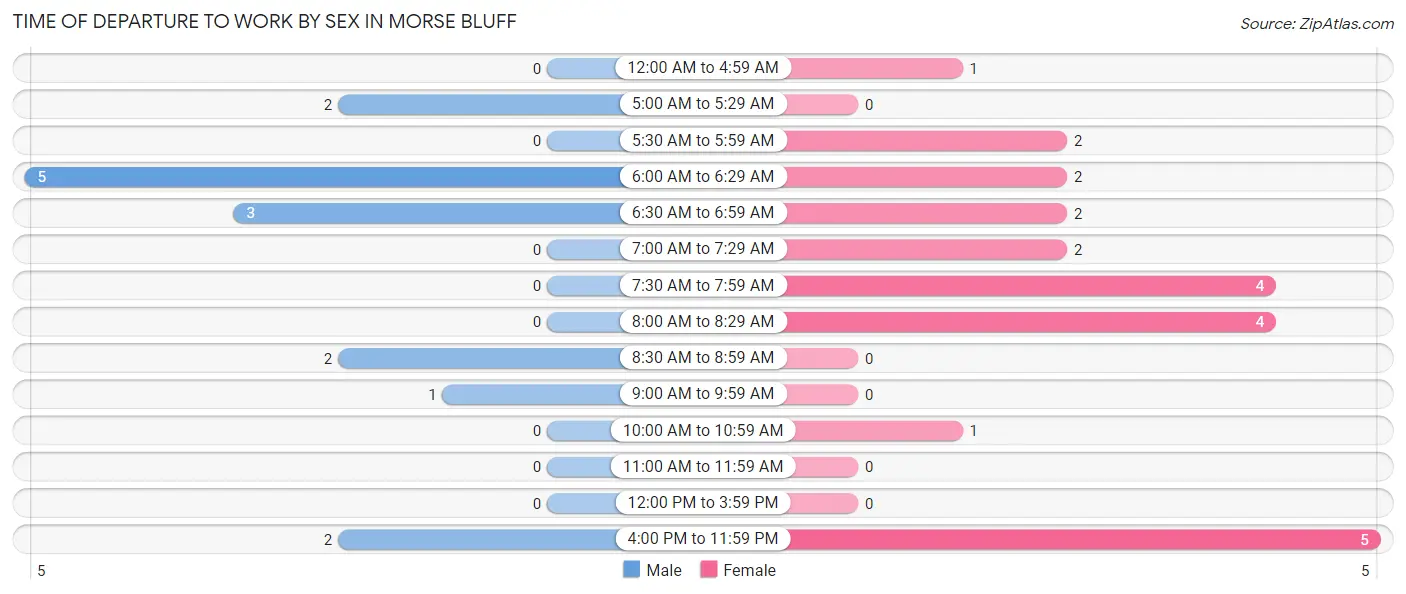
| Time of Departure | Male | Female |
| 12:00 AM to 4:59 AM | 0 (0.0%) | 1 (4.3%) |
| 5:00 AM to 5:29 AM | 2 (13.3%) | 0 (0.0%) |
| 5:30 AM to 5:59 AM | 0 (0.0%) | 2 (8.7%) |
| 6:00 AM to 6:29 AM | 5 (33.3%) | 2 (8.7%) |
| 6:30 AM to 6:59 AM | 3 (20.0%) | 2 (8.7%) |
| 7:00 AM to 7:29 AM | 0 (0.0%) | 2 (8.7%) |
| 7:30 AM to 7:59 AM | 0 (0.0%) | 4 (17.4%) |
| 8:00 AM to 8:29 AM | 0 (0.0%) | 4 (17.4%) |
| 8:30 AM to 8:59 AM | 2 (13.3%) | 0 (0.0%) |
| 9:00 AM to 9:59 AM | 1 (6.7%) | 0 (0.0%) |
| 10:00 AM to 10:59 AM | 0 (0.0%) | 1 (4.3%) |
| 11:00 AM to 11:59 AM | 0 (0.0%) | 0 (0.0%) |
| 12:00 PM to 3:59 PM | 0 (0.0%) | 0 (0.0%) |
| 4:00 PM to 11:59 PM | 2 (13.3%) | 5 (21.7%) |
| Total | 15 (100.0%) | 23 (100.0%) |
Housing Occupancy in Morse Bluff
Occupancy by Ownership in Morse Bluff
Of the total 42 dwellings in Morse Bluff, owner-occupied units account for 34 (80.9%), while renter-occupied units make up 8 (19.1%).
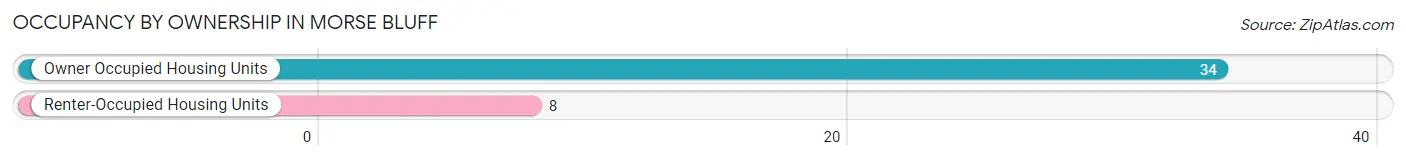
| Occupancy | # Housing Units | % Housing Units |
| Owner Occupied Housing Units | 34 | 80.9% |
| Renter-Occupied Housing Units | 8 | 19.1% |
| Total Occupied Housing Units | 42 | 100.0% |
Occupancy by Household Size in Morse Bluff
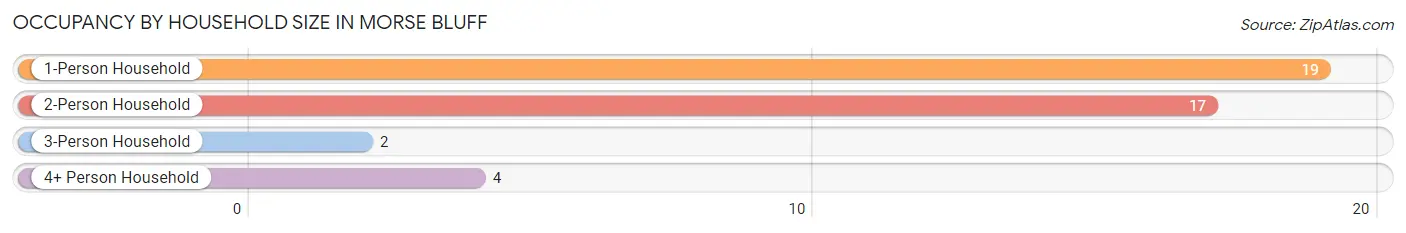
| Household Size | # Housing Units | % Housing Units |
| 1-Person Household | 19 | 45.2% |
| 2-Person Household | 17 | 40.5% |
| 3-Person Household | 2 | 4.8% |
| 4+ Person Household | 4 | 9.5% |
| Total Housing Units | 42 | 100.0% |
Occupancy by Ownership by Household Size in Morse Bluff
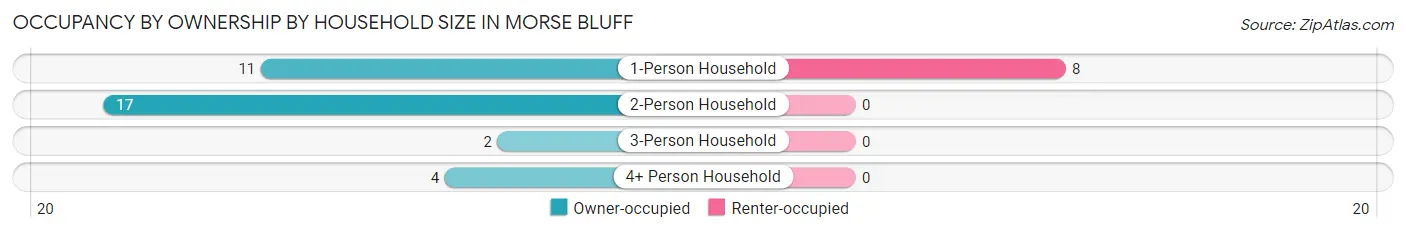
| Household Size | Owner-occupied | Renter-occupied |
| 1-Person Household | 11 (57.9%) | 8 (42.1%) |
| 2-Person Household | 17 (100.0%) | 0 (0.0%) |
| 3-Person Household | 2 (100.0%) | 0 (0.0%) |
| 4+ Person Household | 4 (100.0%) | 0 (0.0%) |
| Total Housing Units | 34 (80.9%) | 8 (19.1%) |
Occupancy by Educational Attainment in Morse Bluff
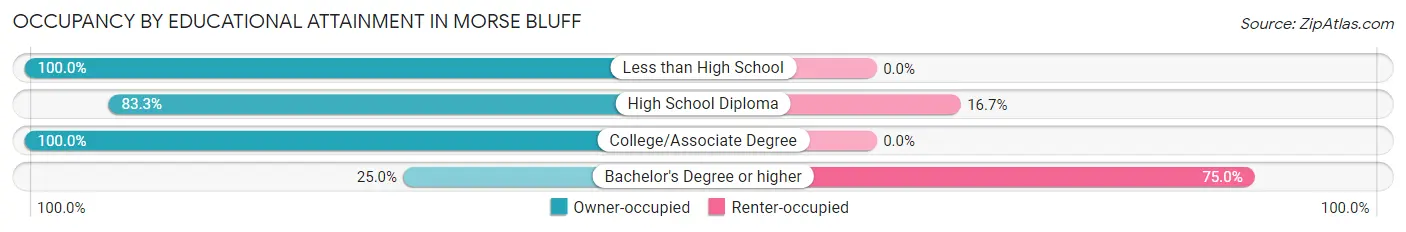
| Household Size | Owner-occupied | Renter-occupied |
| Less than High School | 2 (100.0%) | 0 (0.0%) |
| High School Diploma | 10 (83.3%) | 2 (16.7%) |
| College/Associate Degree | 20 (100.0%) | 0 (0.0%) |
| Bachelor's Degree or higher | 2 (25.0%) | 6 (75.0%) |
Occupancy by Age of Householder in Morse Bluff
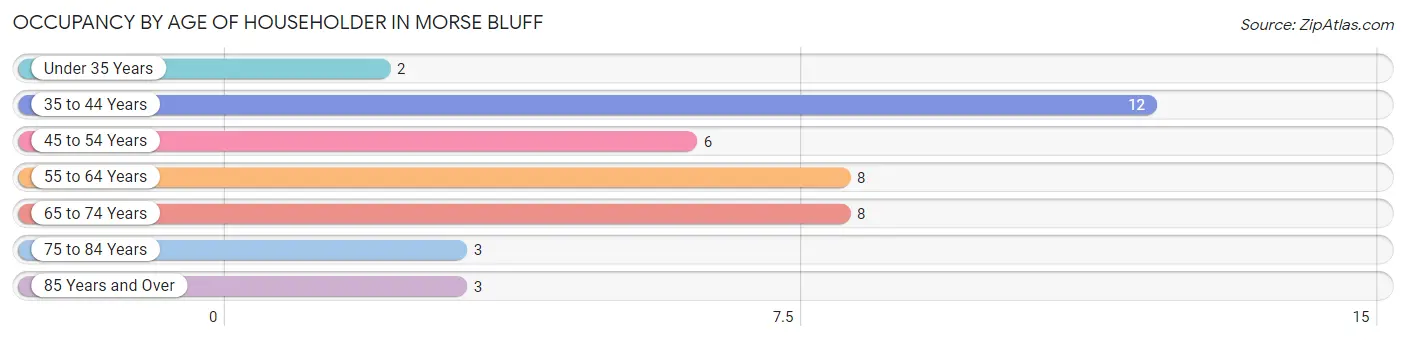
| Age Bracket | # Households | % Households |
| Under 35 Years | 2 | 4.8% |
| 35 to 44 Years | 12 | 28.6% |
| 45 to 54 Years | 6 | 14.3% |
| 55 to 64 Years | 8 | 19.1% |
| 65 to 74 Years | 8 | 19.1% |
| 75 to 84 Years | 3 | 7.1% |
| 85 Years and Over | 3 | 7.1% |
| Total | 42 | 100.0% |
Housing Finances in Morse Bluff
Median Income by Occupancy in Morse Bluff
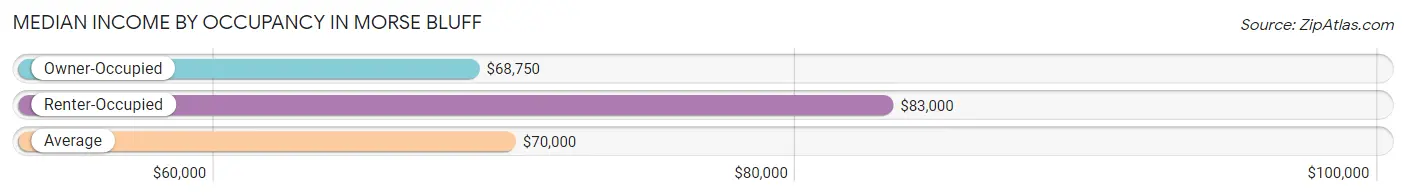
| Occupancy Type | # Households | Median Income |
| Owner-Occupied | 34 (80.9%) | $68,750 |
| Renter-Occupied | 8 (19.1%) | $83,000 |
| Average | 42 (100.0%) | $70,000 |
Occupancy by Householder Income Bracket in Morse Bluff
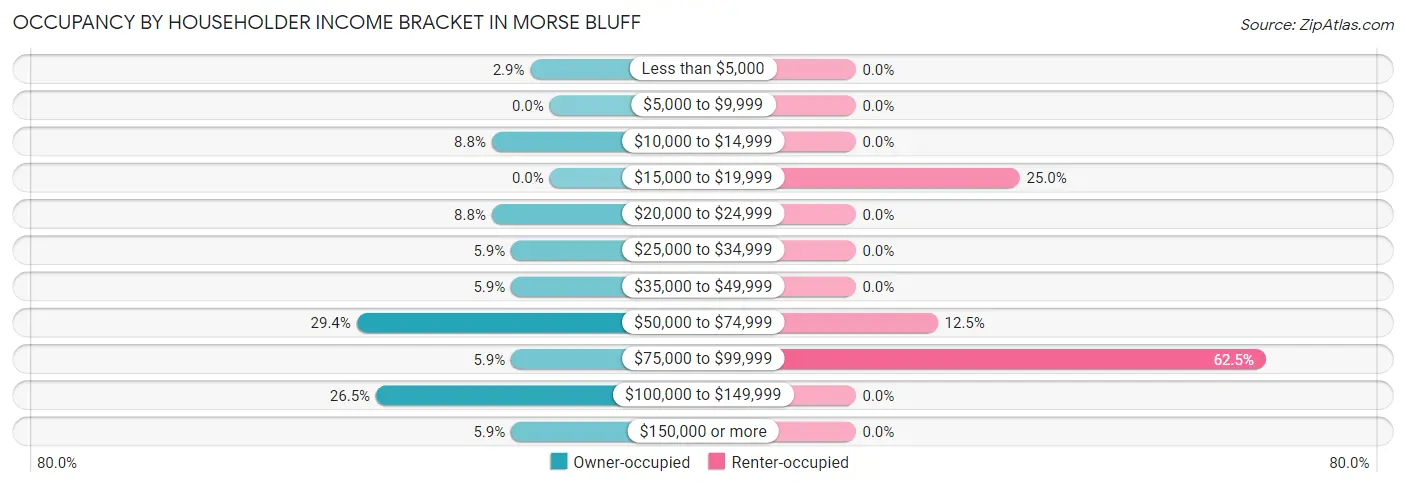
| Income Bracket | Owner-occupied | Renter-occupied |
| Less than $5,000 | 1 (2.9%) | 0 (0.0%) |
| $5,000 to $9,999 | 0 (0.0%) | 0 (0.0%) |
| $10,000 to $14,999 | 3 (8.8%) | 0 (0.0%) |
| $15,000 to $19,999 | 0 (0.0%) | 2 (25.0%) |
| $20,000 to $24,999 | 3 (8.8%) | 0 (0.0%) |
| $25,000 to $34,999 | 2 (5.9%) | 0 (0.0%) |
| $35,000 to $49,999 | 2 (5.9%) | 0 (0.0%) |
| $50,000 to $74,999 | 10 (29.4%) | 1 (12.5%) |
| $75,000 to $99,999 | 2 (5.9%) | 5 (62.5%) |
| $100,000 to $149,999 | 9 (26.5%) | 0 (0.0%) |
| $150,000 or more | 2 (5.9%) | 0 (0.0%) |
| Total | 34 (100.0%) | 8 (100.0%) |
Monthly Housing Cost Tiers in Morse Bluff
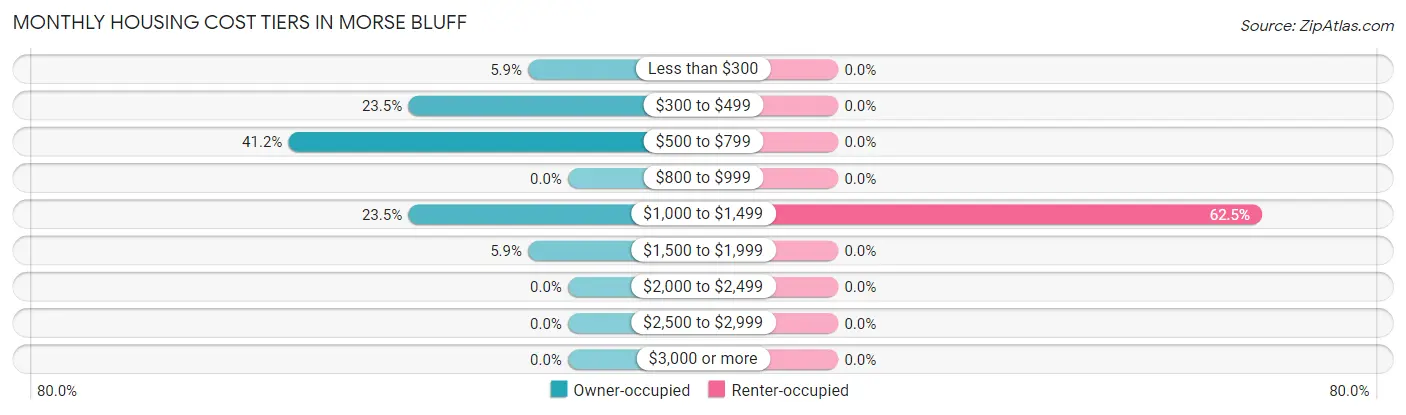
| Monthly Cost | Owner-occupied | Renter-occupied |
| Less than $300 | 2 (5.9%) | 0 (0.0%) |
| $300 to $499 | 8 (23.5%) | 0 (0.0%) |
| $500 to $799 | 14 (41.2%) | 0 (0.0%) |
| $800 to $999 | 0 (0.0%) | 0 (0.0%) |
| $1,000 to $1,499 | 8 (23.5%) | 5 (62.5%) |
| $1,500 to $1,999 | 2 (5.9%) | 0 (0.0%) |
| $2,000 to $2,499 | 0 (0.0%) | 0 (0.0%) |
| $2,500 to $2,999 | 0 (0.0%) | 0 (0.0%) |
| $3,000 or more | 0 (0.0%) | 0 (0.0%) |
| Total | 34 (100.0%) | 8 (100.0%) |
Physical Housing Characteristics in Morse Bluff
Housing Structures in Morse Bluff
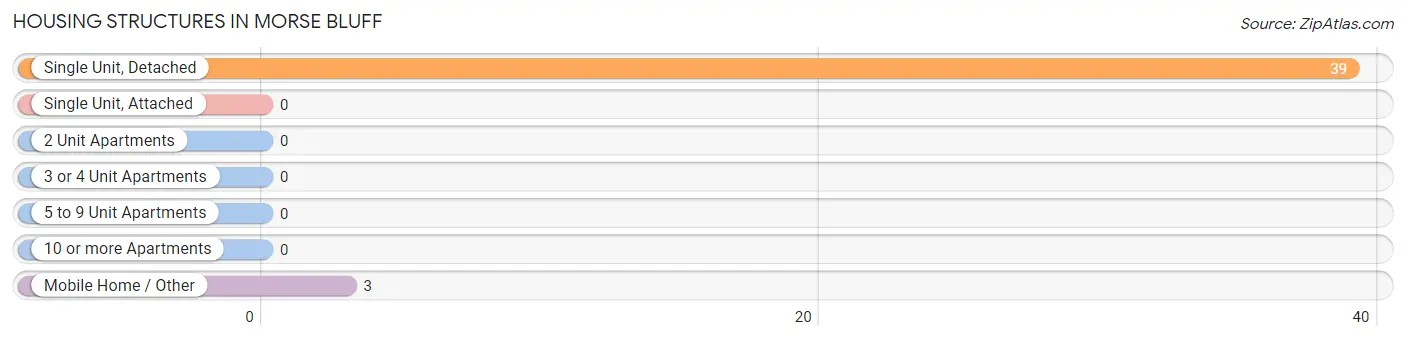
| Structure Type | # Housing Units | % Housing Units |
| Single Unit, Detached | 39 | 92.9% |
| Single Unit, Attached | 0 | 0.0% |
| 2 Unit Apartments | 0 | 0.0% |
| 3 or 4 Unit Apartments | 0 | 0.0% |
| 5 to 9 Unit Apartments | 0 | 0.0% |
| 10 or more Apartments | 0 | 0.0% |
| Mobile Home / Other | 3 | 7.1% |
| Total | 42 | 100.0% |
Housing Structures by Occupancy in Morse Bluff
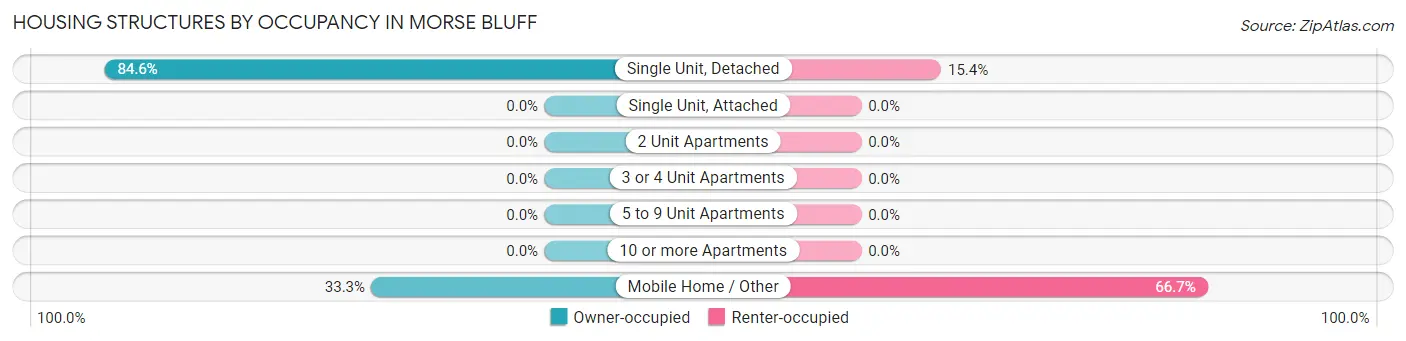
| Structure Type | Owner-occupied | Renter-occupied |
| Single Unit, Detached | 33 (84.6%) | 6 (15.4%) |
| Single Unit, Attached | 0 (0.0%) | 0 (0.0%) |
| 2 Unit Apartments | 0 (0.0%) | 0 (0.0%) |
| 3 or 4 Unit Apartments | 0 (0.0%) | 0 (0.0%) |
| 5 to 9 Unit Apartments | 0 (0.0%) | 0 (0.0%) |
| 10 or more Apartments | 0 (0.0%) | 0 (0.0%) |
| Mobile Home / Other | 1 (33.3%) | 2 (66.7%) |
| Total | 34 (80.9%) | 8 (19.1%) |
Housing Structures by Number of Rooms in Morse Bluff
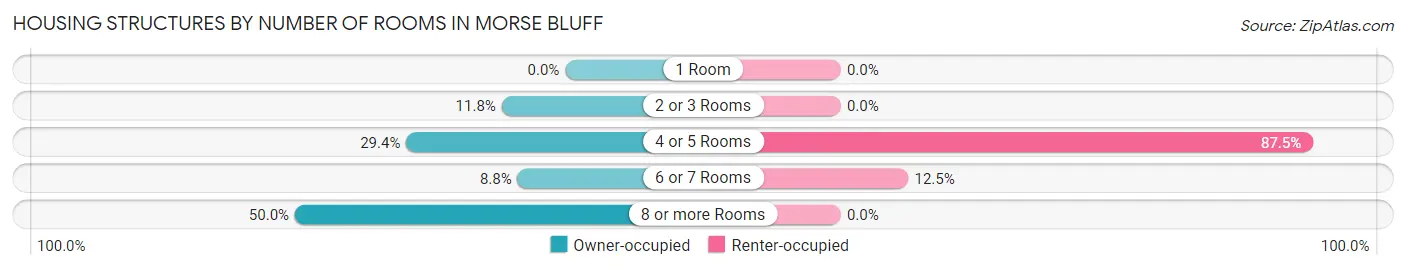
| Number of Rooms | Owner-occupied | Renter-occupied |
| 1 Room | 0 (0.0%) | 0 (0.0%) |
| 2 or 3 Rooms | 4 (11.8%) | 0 (0.0%) |
| 4 or 5 Rooms | 10 (29.4%) | 7 (87.5%) |
| 6 or 7 Rooms | 3 (8.8%) | 1 (12.5%) |
| 8 or more Rooms | 17 (50.0%) | 0 (0.0%) |
| Total | 34 (100.0%) | 8 (100.0%) |
Housing Structure by Heating Type in Morse Bluff
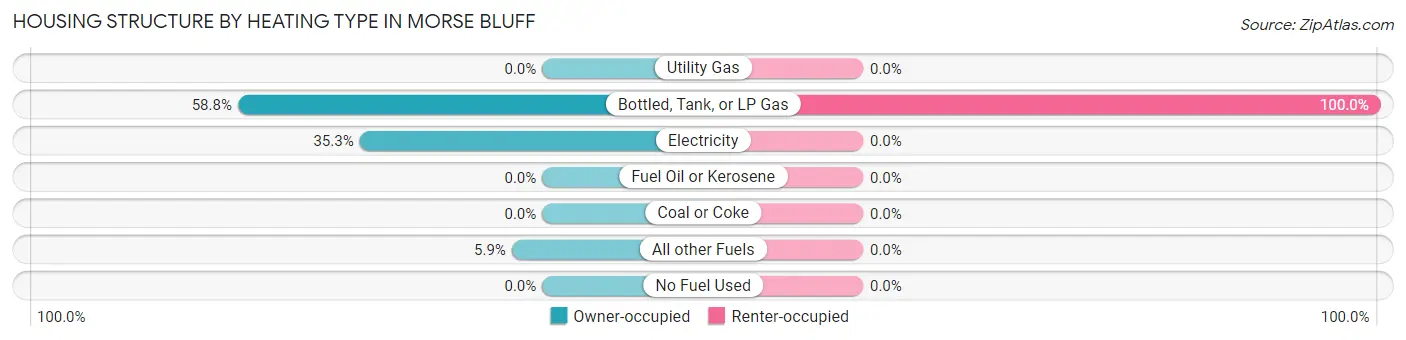
| Heating Type | Owner-occupied | Renter-occupied |
| Utility Gas | 0 (0.0%) | 0 (0.0%) |
| Bottled, Tank, or LP Gas | 20 (58.8%) | 8 (100.0%) |
| Electricity | 12 (35.3%) | 0 (0.0%) |
| Fuel Oil or Kerosene | 0 (0.0%) | 0 (0.0%) |
| Coal or Coke | 0 (0.0%) | 0 (0.0%) |
| All other Fuels | 2 (5.9%) | 0 (0.0%) |
| No Fuel Used | 0 (0.0%) | 0 (0.0%) |
| Total | 34 (100.0%) | 8 (100.0%) |
Household Vehicle Usage in Morse Bluff
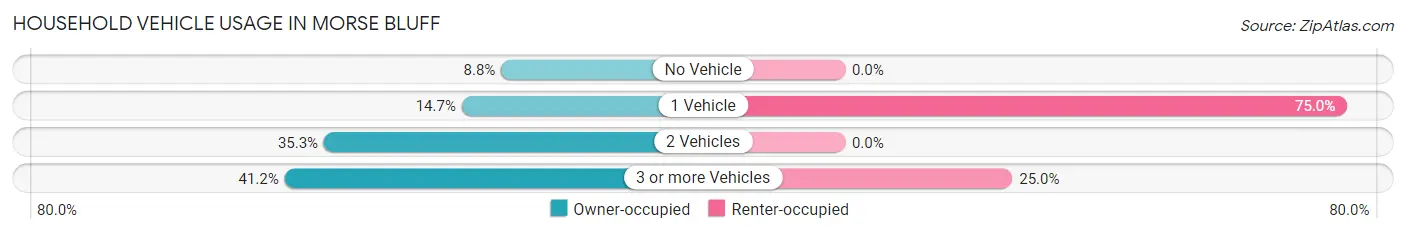
| Vehicles per Household | Owner-occupied | Renter-occupied |
| No Vehicle | 3 (8.8%) | 0 (0.0%) |
| 1 Vehicle | 5 (14.7%) | 6 (75.0%) |
| 2 Vehicles | 12 (35.3%) | 0 (0.0%) |
| 3 or more Vehicles | 14 (41.2%) | 2 (25.0%) |
| Total | 34 (100.0%) | 8 (100.0%) |
Real Estate & Mortgages in Morse Bluff
Real Estate and Mortgage Overview in Morse Bluff
| Characteristic | Without Mortgage | With Mortgage |
| Housing Units | 21 | 13 |
| Median Property Value | $117,500 | $92,500 |
| Median Household Income | - | - |
| Monthly Housing Costs | $508 | $0 |
| Real Estate Taxes | $1,250 | $0 |
Property Value by Mortgage Status in Morse Bluff
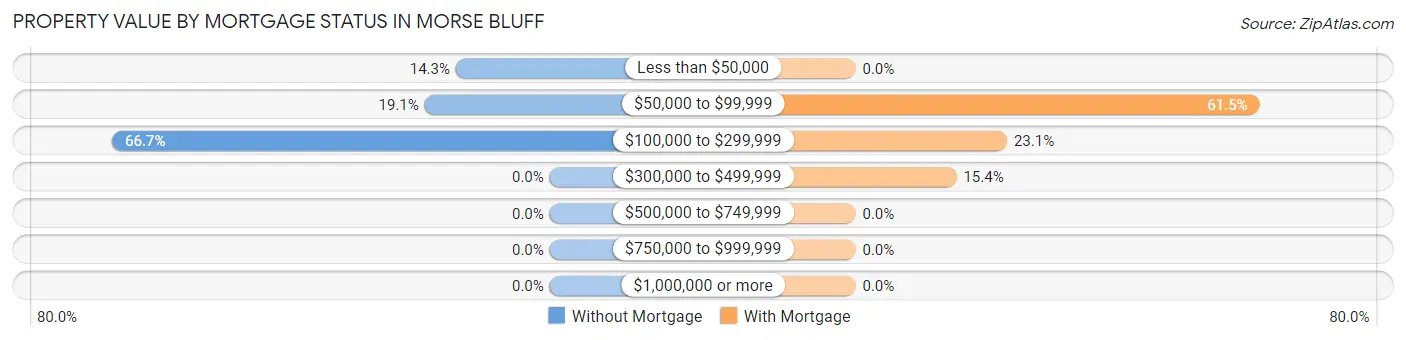
| Property Value | Without Mortgage | With Mortgage |
| Less than $50,000 | 3 (14.3%) | 0 (0.0%) |
| $50,000 to $99,999 | 4 (19.1%) | 8 (61.5%) |
| $100,000 to $299,999 | 14 (66.7%) | 3 (23.1%) |
| $300,000 to $499,999 | 0 (0.0%) | 2 (15.4%) |
| $500,000 to $749,999 | 0 (0.0%) | 0 (0.0%) |
| $750,000 to $999,999 | 0 (0.0%) | 0 (0.0%) |
| $1,000,000 or more | 0 (0.0%) | 0 (0.0%) |
| Total | 21 (100.0%) | 13 (100.0%) |
Household Income by Mortgage Status in Morse Bluff
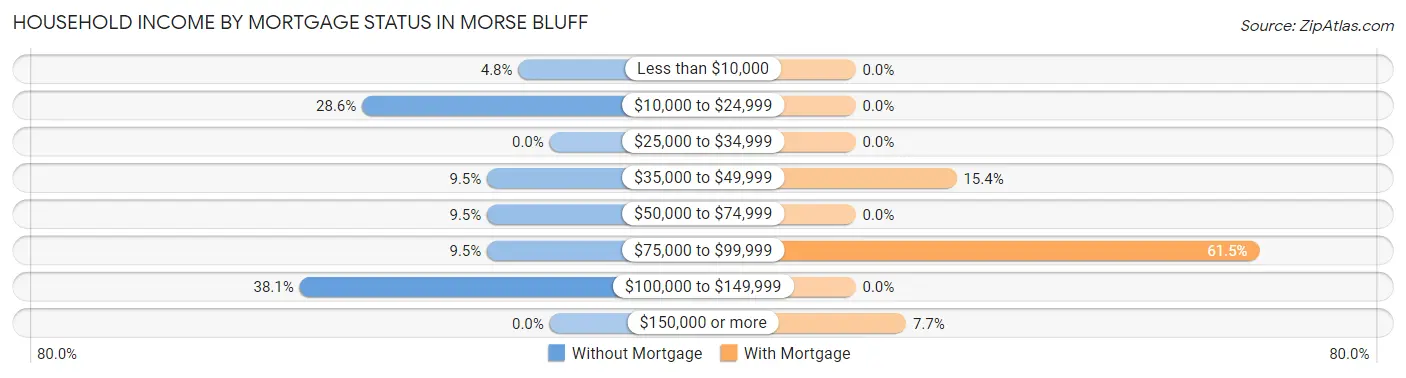
| Household Income | Without Mortgage | With Mortgage |
| Less than $10,000 | 1 (4.8%) | 0 (0.0%) |
| $10,000 to $24,999 | 6 (28.6%) | 0 (0.0%) |
| $25,000 to $34,999 | 0 (0.0%) | 0 (0.0%) |
| $35,000 to $49,999 | 2 (9.5%) | 2 (15.4%) |
| $50,000 to $74,999 | 2 (9.5%) | 0 (0.0%) |
| $75,000 to $99,999 | 2 (9.5%) | 8 (61.5%) |
| $100,000 to $149,999 | 8 (38.1%) | 0 (0.0%) |
| $150,000 or more | 0 (0.0%) | 1 (7.7%) |
| Total | 21 (100.0%) | 13 (100.0%) |
Property Value to Household Income Ratio in Morse Bluff
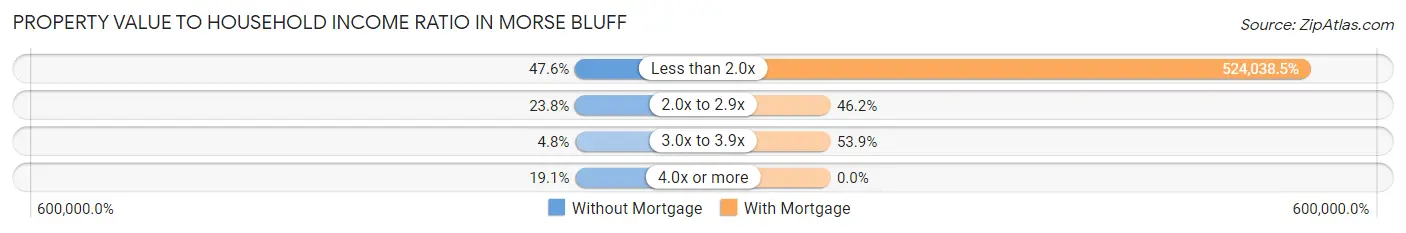
| Value-to-Income Ratio | Without Mortgage | With Mortgage |
| Less than 2.0x | 10 (47.6%) | 68,125 (524,038.5%) |
| 2.0x to 2.9x | 5 (23.8%) | 6 (46.2%) |
| 3.0x to 3.9x | 1 (4.8%) | 7 (53.8%) |
| 4.0x or more | 4 (19.1%) | 0 (0.0%) |
| Total | 21 (100.0%) | 13 (100.0%) |
Real Estate Taxes by Mortgage Status in Morse Bluff
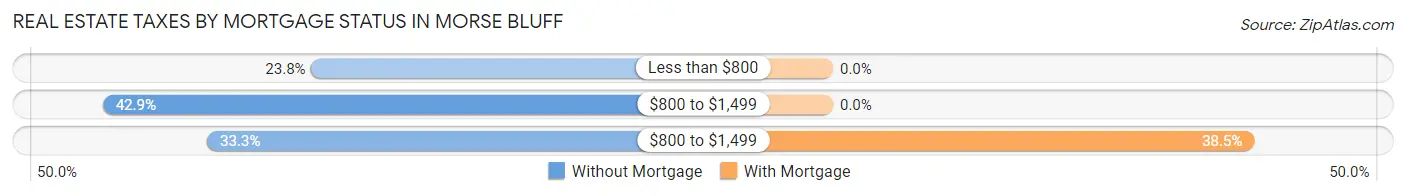
| Property Taxes | Without Mortgage | With Mortgage |
| Less than $800 | 5 (23.8%) | 0 (0.0%) |
| $800 to $1,499 | 9 (42.9%) | 0 (0.0%) |
| $800 to $1,499 | 7 (33.3%) | 5 (38.5%) |
| Total | 21 (100.0%) | 13 (100.0%) |
Health & Disability in Morse Bluff
Health Insurance Coverage by Age in Morse Bluff
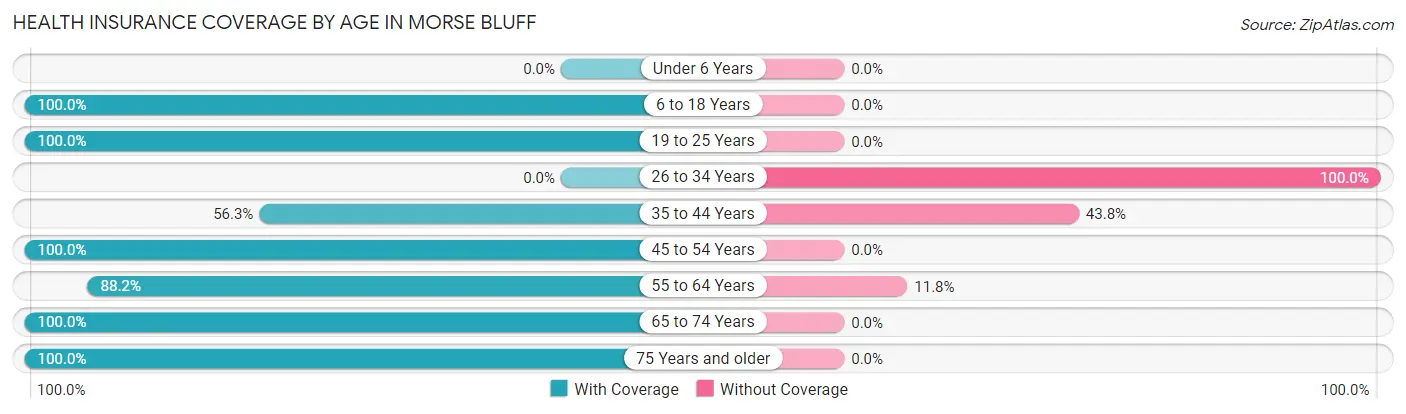
| Age Bracket | With Coverage | Without Coverage |
| Under 6 Years | 0 (0.0%) | 0 (0.0%) |
| 6 to 18 Years | 9 (100.0%) | 0 (0.0%) |
| 19 to 25 Years | 4 (100.0%) | 0 (0.0%) |
| 26 to 34 Years | 0 (0.0%) | 2 (100.0%) |
| 35 to 44 Years | 9 (56.2%) | 7 (43.8%) |
| 45 to 54 Years | 10 (100.0%) | 0 (0.0%) |
| 55 to 64 Years | 15 (88.2%) | 2 (11.8%) |
| 65 to 74 Years | 11 (100.0%) | 0 (0.0%) |
| 75 Years and older | 6 (100.0%) | 0 (0.0%) |
| Total | 64 (85.3%) | 11 (14.7%) |
Health Insurance Coverage by Citizenship Status in Morse Bluff
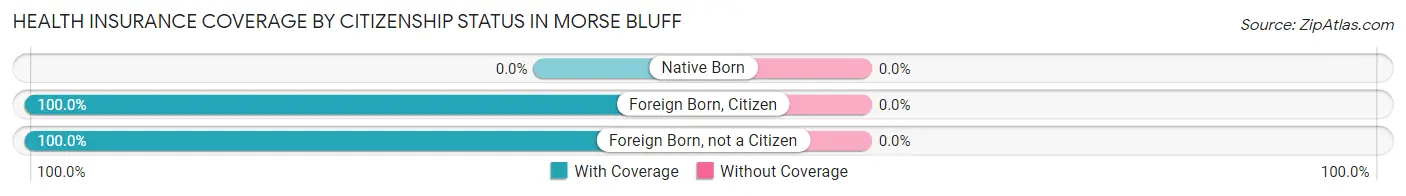
| Citizenship Status | With Coverage | Without Coverage |
| Native Born | 0 (0.0%) | 0 (0.0%) |
| Foreign Born, Citizen | 9 (100.0%) | 0 (0.0%) |
| Foreign Born, not a Citizen | 4 (100.0%) | 0 (0.0%) |
Health Insurance Coverage by Household Income in Morse Bluff
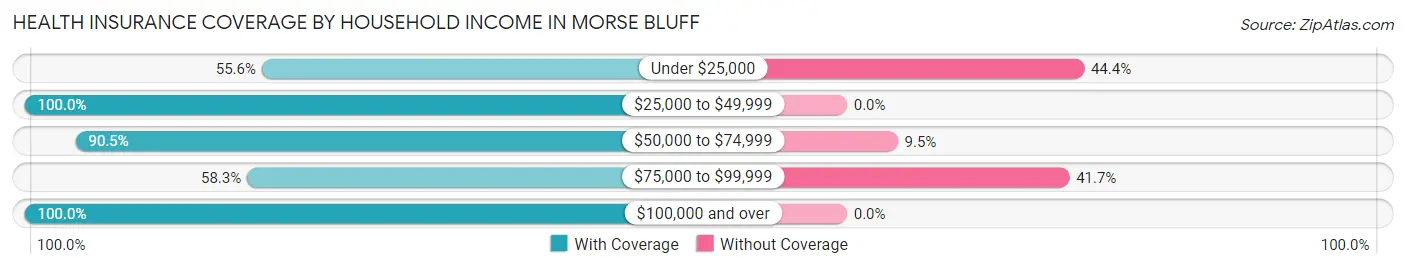
| Household Income | With Coverage | Without Coverage |
| Under $25,000 | 5 (55.6%) | 4 (44.4%) |
| $25,000 to $49,999 | 5 (100.0%) | 0 (0.0%) |
| $50,000 to $74,999 | 19 (90.5%) | 2 (9.5%) |
| $75,000 to $99,999 | 7 (58.3%) | 5 (41.7%) |
| $100,000 and over | 28 (100.0%) | 0 (0.0%) |
Public vs Private Health Insurance Coverage by Age in Morse Bluff
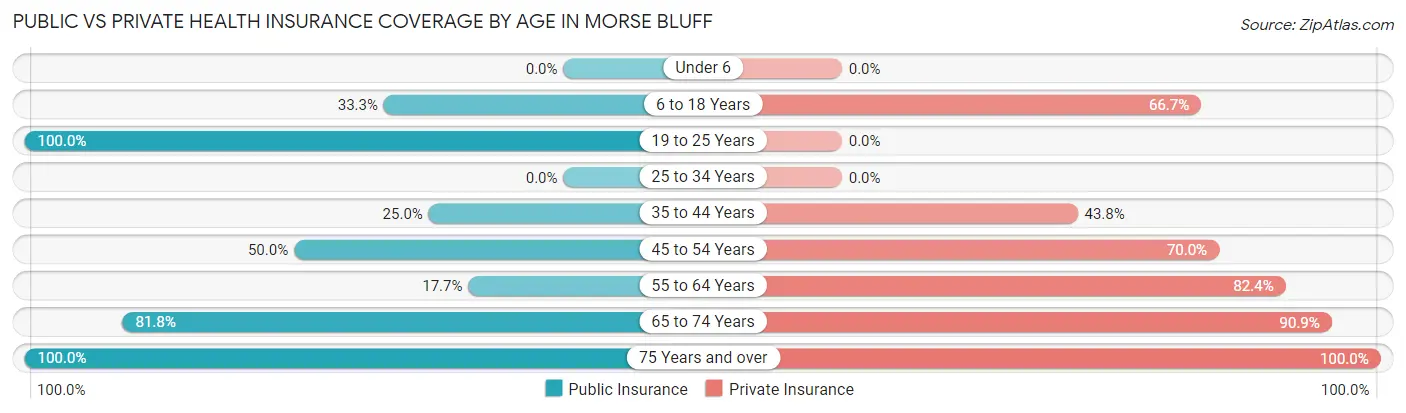
| Age Bracket | Public Insurance | Private Insurance |
| Under 6 | 0 (0.0%) | 0 (0.0%) |
| 6 to 18 Years | 3 (33.3%) | 6 (66.7%) |
| 19 to 25 Years | 4 (100.0%) | 0 (0.0%) |
| 25 to 34 Years | 0 (0.0%) | 0 (0.0%) |
| 35 to 44 Years | 4 (25.0%) | 7 (43.8%) |
| 45 to 54 Years | 5 (50.0%) | 7 (70.0%) |
| 55 to 64 Years | 3 (17.6%) | 14 (82.4%) |
| 65 to 74 Years | 9 (81.8%) | 10 (90.9%) |
| 75 Years and over | 6 (100.0%) | 6 (100.0%) |
| Total | 34 (45.3%) | 50 (66.7%) |
Disability Status by Sex by Age in Morse Bluff
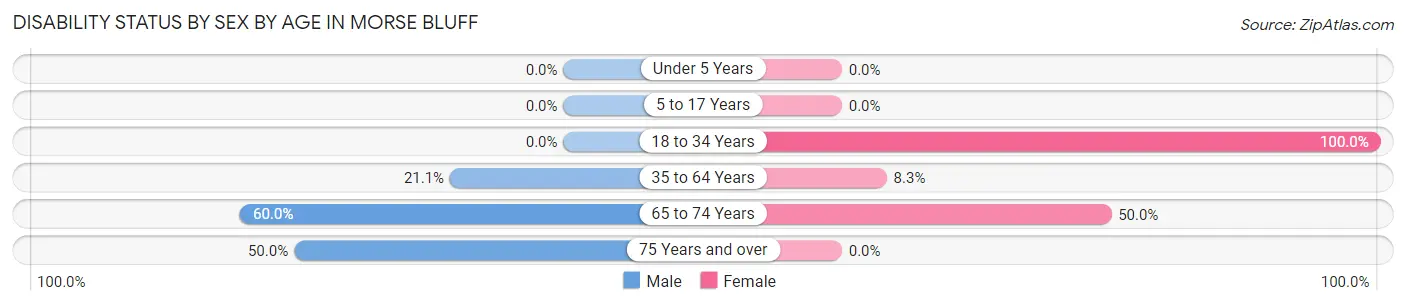
| Age Bracket | Male | Female |
| Under 5 Years | 0 (0.0%) | 0 (0.0%) |
| 5 to 17 Years | 0 (0.0%) | 0 (0.0%) |
| 18 to 34 Years | 0 (0.0%) | 2 (100.0%) |
| 35 to 64 Years | 4 (21.0%) | 2 (8.3%) |
| 65 to 74 Years | 3 (60.0%) | 3 (50.0%) |
| 75 Years and over | 2 (50.0%) | 0 (0.0%) |
Disability Class by Sex by Age in Morse Bluff
Disability Class: Hearing Difficulty
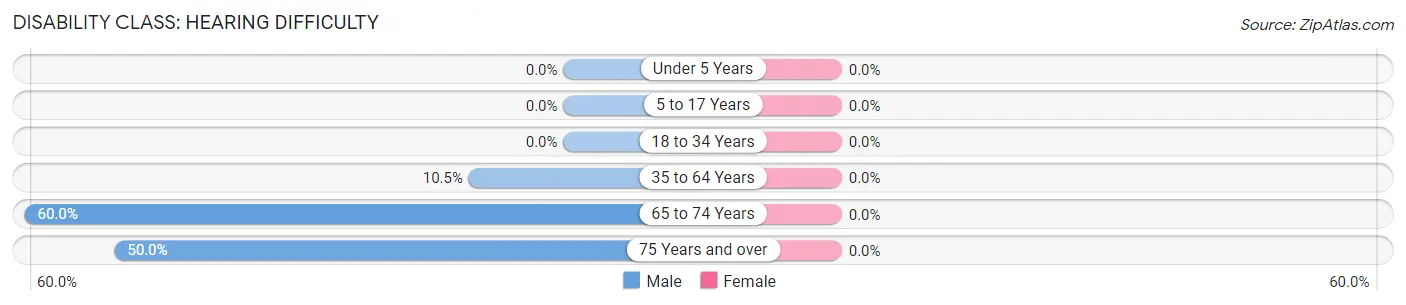
| Age Bracket | Male | Female |
| Under 5 Years | 0 (0.0%) | 0 (0.0%) |
| 5 to 17 Years | 0 (0.0%) | 0 (0.0%) |
| 18 to 34 Years | 0 (0.0%) | 0 (0.0%) |
| 35 to 64 Years | 2 (10.5%) | 0 (0.0%) |
| 65 to 74 Years | 3 (60.0%) | 0 (0.0%) |
| 75 Years and over | 2 (50.0%) | 0 (0.0%) |
Disability Class: Vision Difficulty
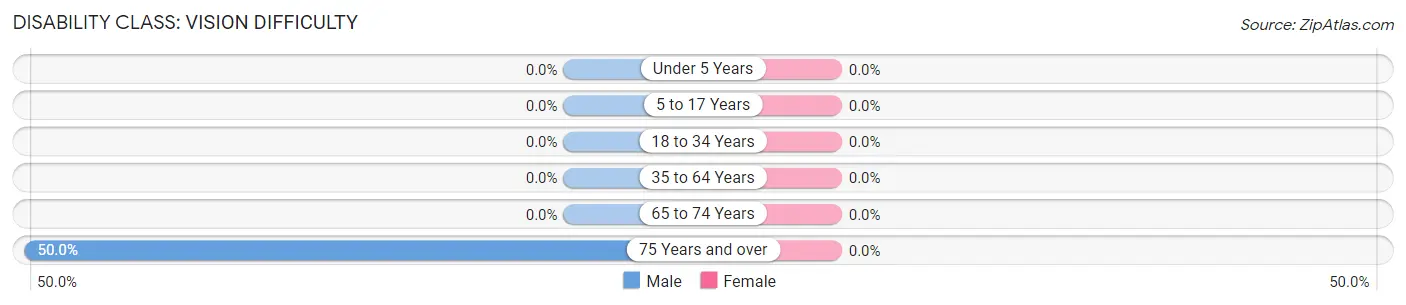
| Age Bracket | Male | Female |
| Under 5 Years | 0 (0.0%) | 0 (0.0%) |
| 5 to 17 Years | 0 (0.0%) | 0 (0.0%) |
| 18 to 34 Years | 0 (0.0%) | 0 (0.0%) |
| 35 to 64 Years | 0 (0.0%) | 0 (0.0%) |
| 65 to 74 Years | 0 (0.0%) | 0 (0.0%) |
| 75 Years and over | 2 (50.0%) | 0 (0.0%) |
Disability Class: Cognitive Difficulty
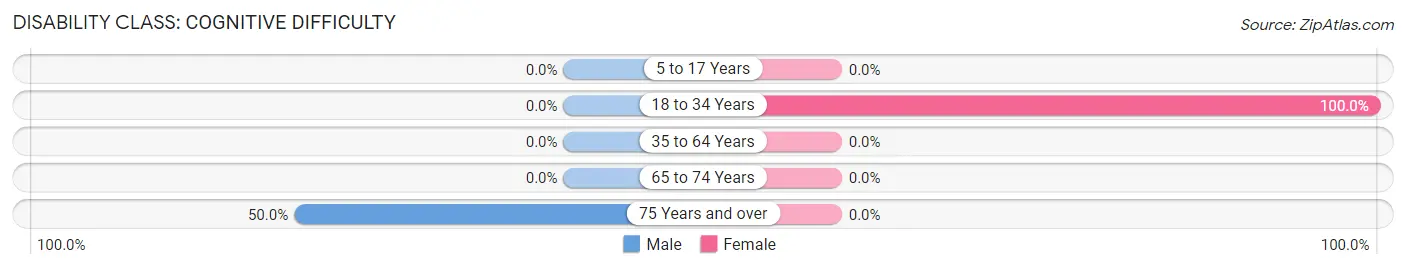
| Age Bracket | Male | Female |
| 5 to 17 Years | 0 (0.0%) | 0 (0.0%) |
| 18 to 34 Years | 0 (0.0%) | 2 (100.0%) |
| 35 to 64 Years | 0 (0.0%) | 0 (0.0%) |
| 65 to 74 Years | 0 (0.0%) | 0 (0.0%) |
| 75 Years and over | 2 (50.0%) | 0 (0.0%) |
Disability Class: Ambulatory Difficulty
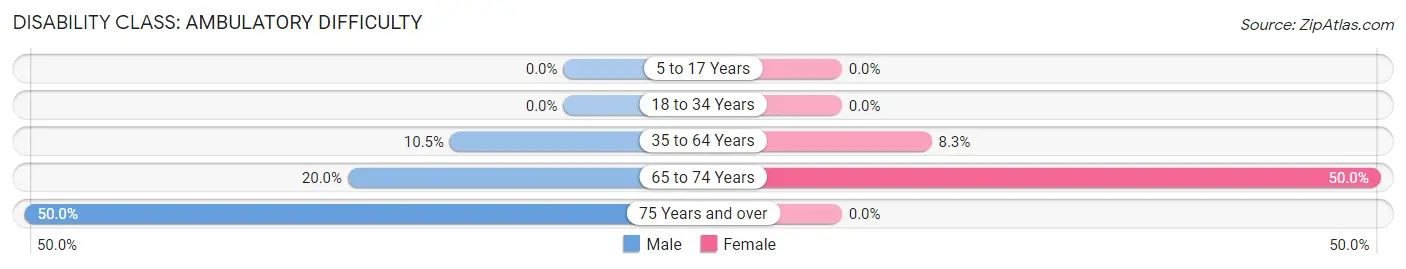
| Age Bracket | Male | Female |
| 5 to 17 Years | 0 (0.0%) | 0 (0.0%) |
| 18 to 34 Years | 0 (0.0%) | 0 (0.0%) |
| 35 to 64 Years | 2 (10.5%) | 2 (8.3%) |
| 65 to 74 Years | 1 (20.0%) | 3 (50.0%) |
| 75 Years and over | 2 (50.0%) | 0 (0.0%) |
Disability Class: Self-Care Difficulty
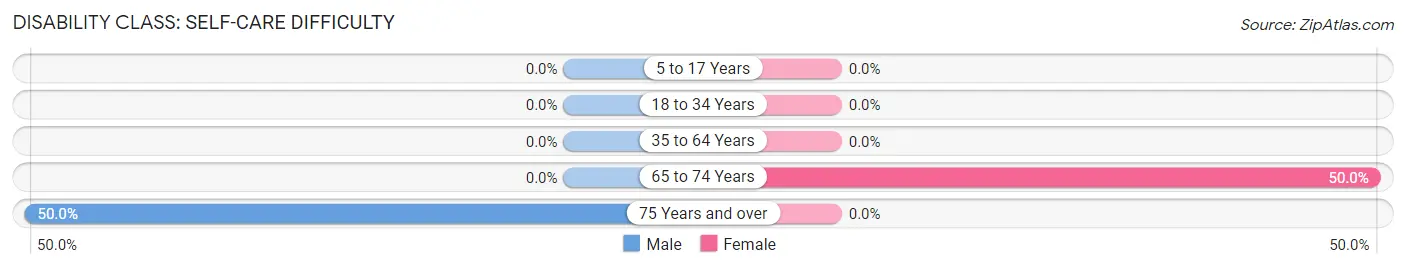
| Age Bracket | Male | Female |
| 5 to 17 Years | 0 (0.0%) | 0 (0.0%) |
| 18 to 34 Years | 0 (0.0%) | 0 (0.0%) |
| 35 to 64 Years | 0 (0.0%) | 0 (0.0%) |
| 65 to 74 Years | 0 (0.0%) | 3 (50.0%) |
| 75 Years and over | 2 (50.0%) | 0 (0.0%) |
Technology Access in Morse Bluff
Computing Device Access in Morse Bluff
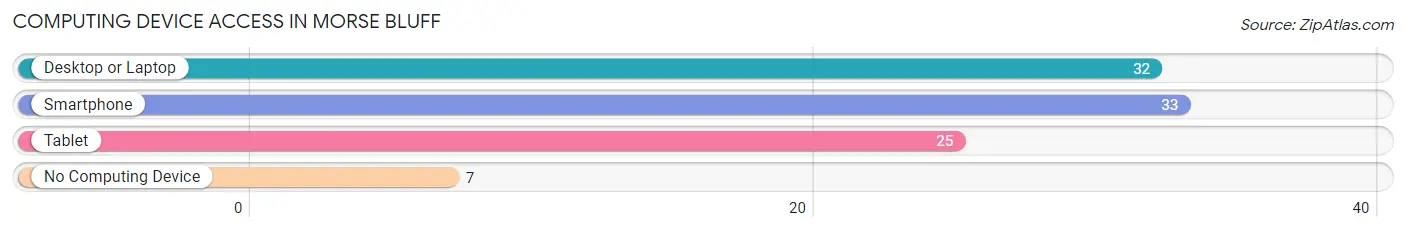
| Device Type | # Households | % Households |
| Desktop or Laptop | 32 | 76.2% |
| Smartphone | 33 | 78.6% |
| Tablet | 25 | 59.5% |
| No Computing Device | 7 | 16.7% |
| Total | 42 | 100.0% |
Internet Access in Morse Bluff
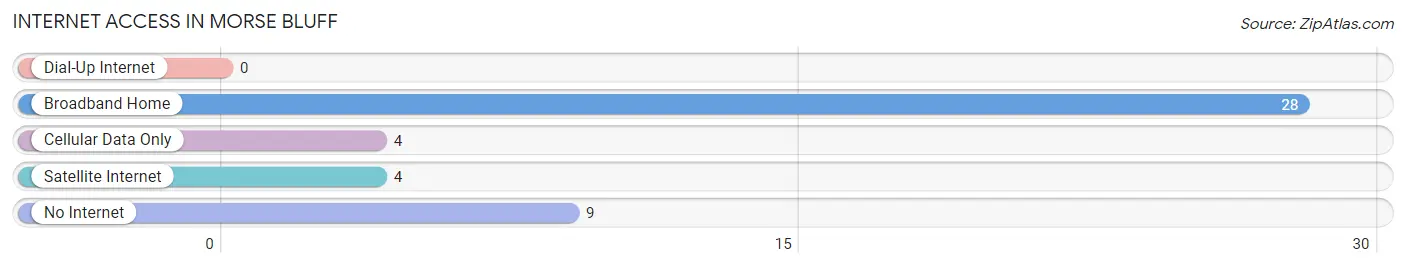
| Internet Type | # Households | % Households |
| Dial-Up Internet | 0 | 0.0% |
| Broadband Home | 28 | 66.7% |
| Cellular Data Only | 4 | 9.5% |
| Satellite Internet | 4 | 9.5% |
| No Internet | 9 | 21.4% |
| Total | 42 | 100.0% |
Morse Bluff Summary
Morse Bluff is a small village located in Saunders County, Nebraska, United States. It is situated on the banks of the Platte River, approximately 25 miles northwest of Omaha. The village was founded in 1871 by William Morse, a Civil War veteran, and was named after him. The population of Morse Bluff was estimated to be around 200 people in 2020.
Geography
Morse Bluff is located in the Platte River Valley, which is part of the Great Plains region of the United States. The village is situated on the banks of the Platte River, approximately 25 miles northwest of Omaha. The terrain is mostly flat, with some rolling hills in the area. The climate is characterized by hot summers and cold winters, with an average annual temperature of around 50°F.
Economy
Morse Bluff is a small, rural community with a limited economy. The main industries in the area are agriculture and tourism. The village is home to several small businesses, including a grocery store, a hardware store, and a few restaurants. The village also has a post office and a bank.
Demographics
Morse Bluff is a predominantly white community, with a population of around 200 people in 2020. The median household income is around $50,000, and the median age is around 40 years old. The village is home to a variety of religious denominations, including Catholic, Lutheran, and Methodist.
History
Morse Bluff was founded in 1871 by William Morse, a Civil War veteran. The village was named after him, and it quickly became a popular destination for settlers in the area. The village was incorporated in 1887, and it has remained a small, rural community ever since. The village was home to a variety of businesses, including a flour mill, a sawmill, and a blacksmith shop.
In the early 20th century, the village was home to a variety of cultural and recreational activities, including a baseball team, a band, and a theater. The village also had a library and a school. In the late 20th century, the village experienced a decline in population, as many of its residents moved away in search of better economic opportunities.
Today, Morse Bluff is a small, rural community with a limited economy. The village is home to several small businesses, including a grocery store, a hardware store, and a few restaurants. The village also has a post office and a bank. The village is home to a variety of religious denominations, including Catholic, Lutheran, and Methodist. The population of Morse Bluff was estimated to be around 200 people in 2020.
Common Questions
What is Per Capita Income in Morse Bluff?
Per Capita income in Morse Bluff is $39,053.
What is the Median Family Income in Morse Bluff?
Median Family Income in Morse Bluff is $98,750.
What is the Median Household income in Morse Bluff?
Median Household Income in Morse Bluff is $70,000.
What is Income or Wage Gap in Morse Bluff?
Income or Wage Gap in Morse Bluff is 18.2%.
Women in Morse Bluff earn 81.8 cents for every dollar earned by a man.
What is Inequality or Gini Index in Morse Bluff?
Inequality or Gini Index in Morse Bluff is 0.33.
What is the Total Population of Morse Bluff?
Total Population of Morse Bluff is 75.
What is the Total Male Population of Morse Bluff?
Total Male Population of Morse Bluff is 38.
What is the Total Female Population of Morse Bluff?
Total Female Population of Morse Bluff is 37.
What is the Ratio of Males per 100 Females in Morse Bluff?
There are 102.70 Males per 100 Females in Morse Bluff.
What is the Ratio of Females per 100 Males in Morse Bluff?
There are 97.37 Females per 100 Males in Morse Bluff.
What is the Median Population Age in Morse Bluff?
Median Population Age in Morse Bluff is 53.1 Years.
What is the Average Family Size in Morse Bluff
Average Family Size in Morse Bluff is 2.5 People.
What is the Average Household Size in Morse Bluff
Average Household Size in Morse Bluff is 1.8 People.
How Large is the Labor Force in Morse Bluff?
There are 42 People in the Labor Forcein in Morse Bluff.
What is the Percentage of People in the Labor Force in Morse Bluff?
61.8% of People are in the Labor Force in Morse Bluff.