Zip Codes with the Highest Percentage of Population Employed in Security & Protection in Tinley Park, IL
RELATED REPORTS & OPTIONS
Security & Protection
Tinley Park
Compare Zip Codes
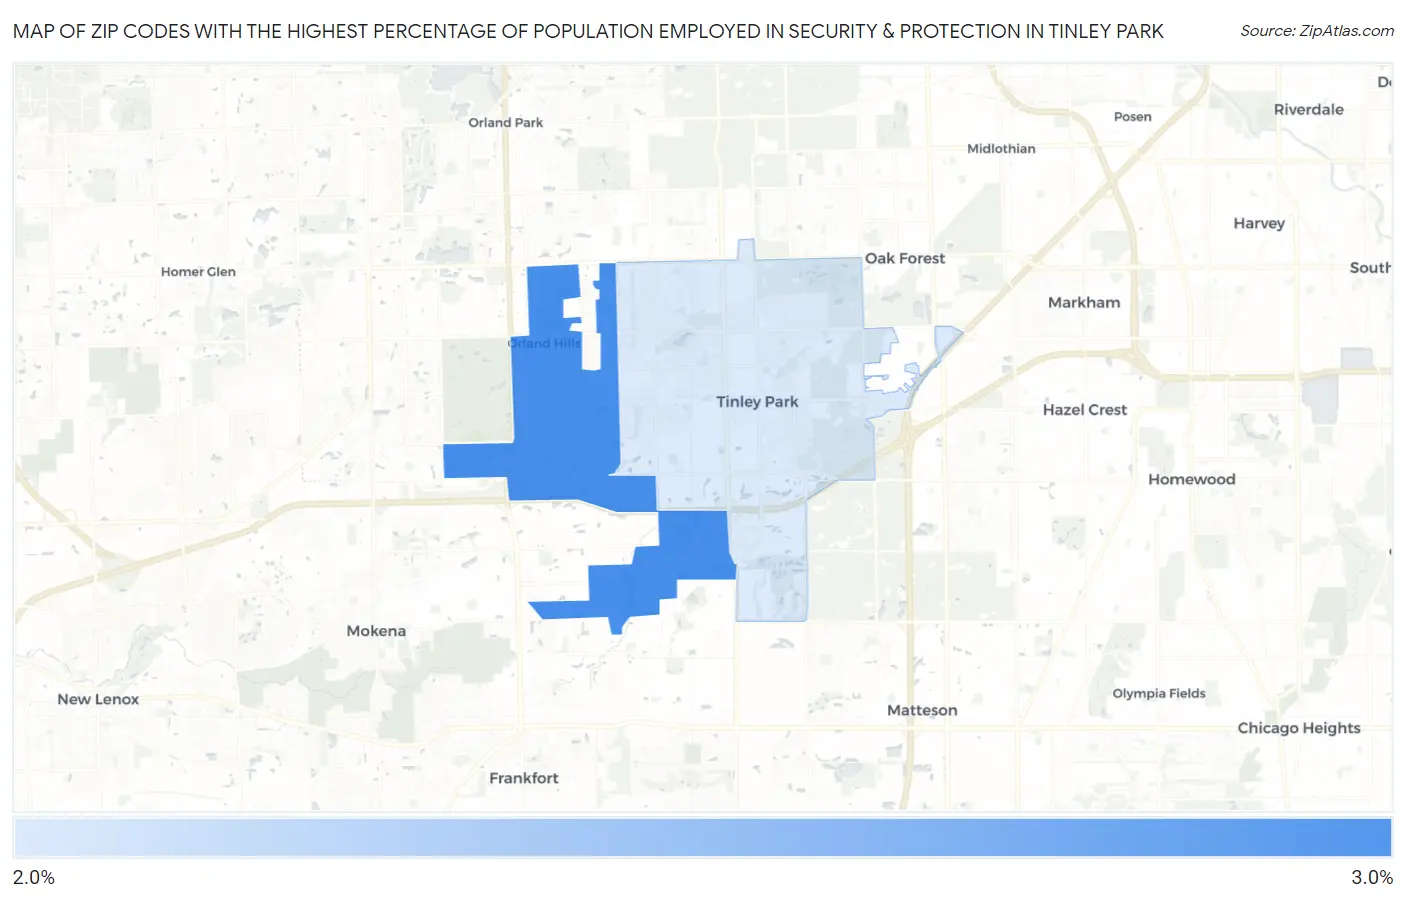
Map of Zip Codes with the Highest Percentage of Population Employed in Security & Protection in Tinley Park
2.5%
2.9%
Zip Codes with the Highest Percentage of Population Employed in Security & Protection in Tinley Park, IL
| Zip Code | % Employed | vs State | vs National | |
| 1. | 60487 | 2.9% | 2.2%(+0.710)#317 | 2.1%(+0.753)#7,631 |
| 2. | 60477 | 2.5% | 2.2%(+0.307)#396 | 2.1%(+0.350)#9,517 |
1
Common Questions
What are the Top Zip Codes with the Highest Percentage of Population Employed in Security & Protection in Tinley Park, IL?
Top Zip Codes with the Highest Percentage of Population Employed in Security & Protection in Tinley Park, IL are:
What zip code has the Highest Percentage of Population Employed in Security & Protection in Tinley Park, IL?
60487 has the Highest Percentage of Population Employed in Security & Protection in Tinley Park, IL with 2.9%.
What is the Percentage of Population Employed in Security & Protection in Tinley Park, IL?
Percentage of Population Employed in Security & Protection in Tinley Park is 2.9%.
What is the Percentage of Population Employed in Security & Protection in Illinois?
Percentage of Population Employed in Security & Protection in Illinois is 2.2%.
What is the Percentage of Population Employed in Security & Protection in the United States?
Percentage of Population Employed in Security & Protection in the United States is 2.1%.