Zip Codes with the Highest Percentage of Population Employed in Security & Protection in Danville, IL
RELATED REPORTS & OPTIONS
Security & Protection
Danville
Compare Zip Codes
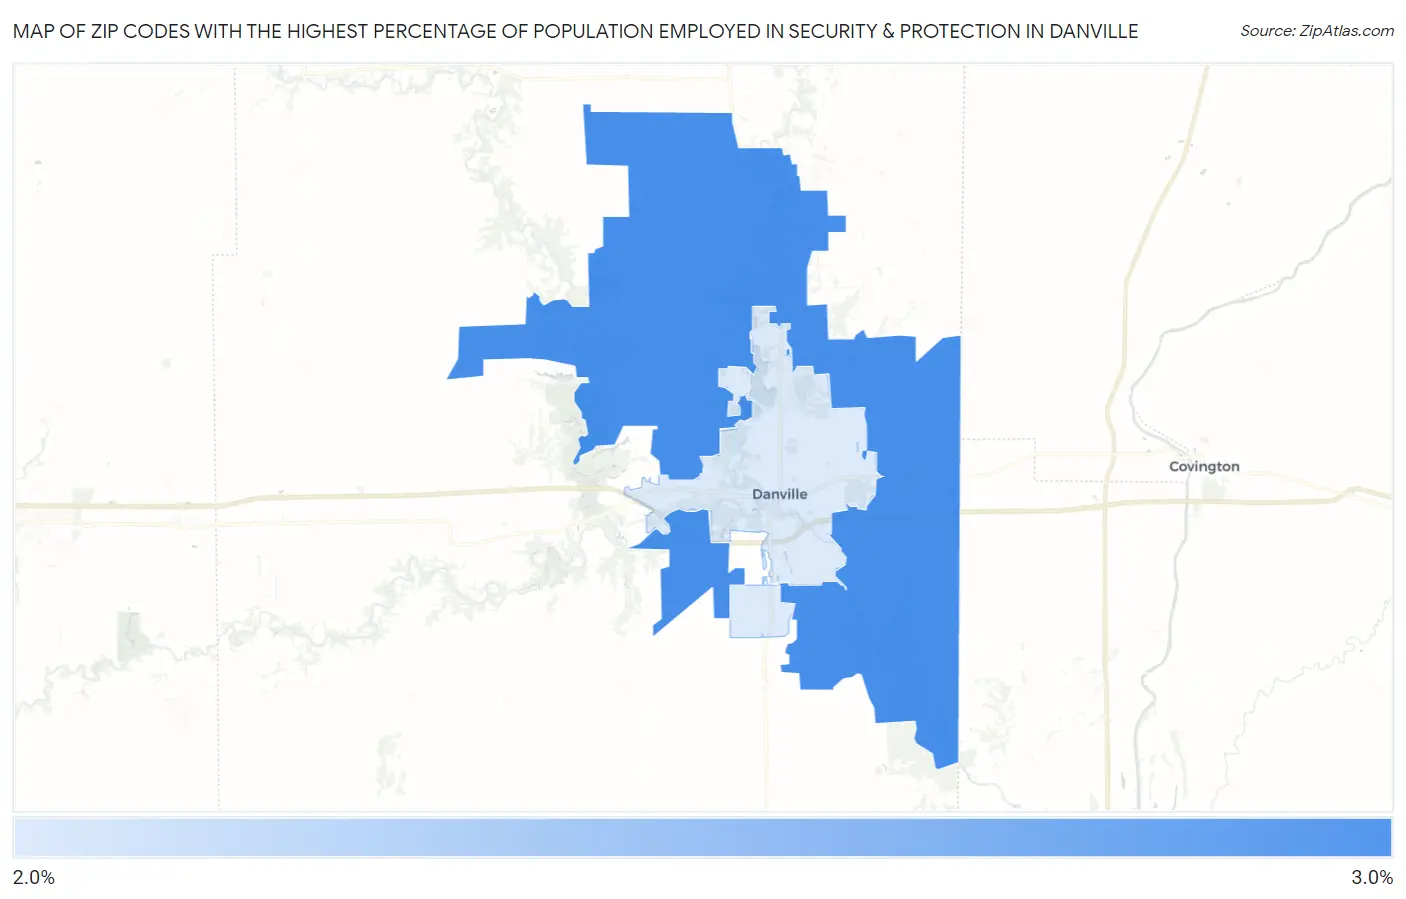
Map of Zip Codes with the Highest Percentage of Population Employed in Security & Protection in Danville
2.0%
2.7%
Zip Codes with the Highest Percentage of Population Employed in Security & Protection in Danville, IL
| Zip Code | % Employed | vs State | vs National | |
| 1. | 61834 | 2.7% | 2.2%(+0.488)#361 | 2.1%(+0.531)#8,630 |
| 2. | 61832 | 2.0% | 2.2%(-0.174)#530 | 2.1%(-0.131)#12,442 |
1
Common Questions
What are the Top Zip Codes with the Highest Percentage of Population Employed in Security & Protection in Danville, IL?
Top Zip Codes with the Highest Percentage of Population Employed in Security & Protection in Danville, IL are:
What zip code has the Highest Percentage of Population Employed in Security & Protection in Danville, IL?
61834 has the Highest Percentage of Population Employed in Security & Protection in Danville, IL with 2.7%.
What is the Percentage of Population Employed in Security & Protection in Danville, IL?
Percentage of Population Employed in Security & Protection in Danville is 1.8%.
What is the Percentage of Population Employed in Security & Protection in Illinois?
Percentage of Population Employed in Security & Protection in Illinois is 2.2%.
What is the Percentage of Population Employed in Security & Protection in the United States?
Percentage of Population Employed in Security & Protection in the United States is 2.1%.