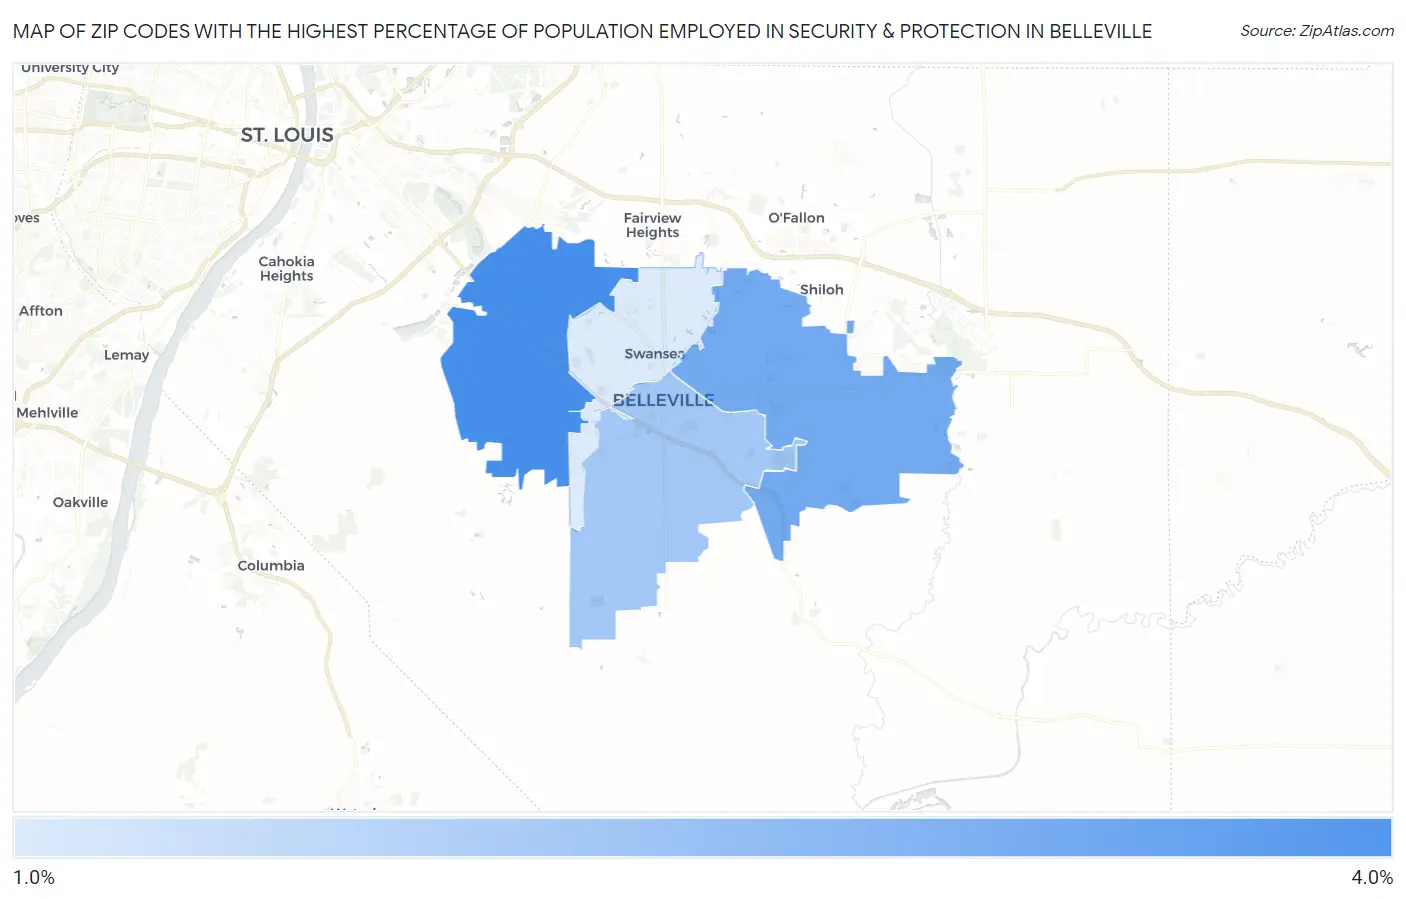
Zip Codes with the Highest Percentage of Population Employed in Security & Protection in Belleville, IL
RELATED REPORTS & OPTIONS
Security & Protection
Belleville
Compare Zip Codes
Map of Zip Codes with the Highest Percentage of Population Employed in Security & Protection in Belleville
1.0%
3.3%
Zip Codes with the Highest Percentage of Population Employed in Security & Protection in Belleville, IL
| Zip Code | % Employed | vs State | vs National | |
| 1. | 62223 | 3.3% | 2.2%(+1.11)#257 | 2.1%(+1.15)#6,233 |
| 2. | 62221 | 2.6% | 2.2%(+0.448)#370 | 2.1%(+0.491)#8,824 |
| 3. | 62220 | 1.9% | 2.2%(-0.298)#565 | 2.1%(-0.255)#13,274 |
| 4. | 62226 | 1.0% | 2.2%(-1.15)#876 | 2.1%(-1.11)#19,712 |
1
Common Questions
What are the Top 3 Zip Codes with the Highest Percentage of Population Employed in Security & Protection in Belleville, IL?
Top 3 Zip Codes with the Highest Percentage of Population Employed in Security & Protection in Belleville, IL are:
What zip code has the Highest Percentage of Population Employed in Security & Protection in Belleville, IL?
62223 has the Highest Percentage of Population Employed in Security & Protection in Belleville, IL with 3.3%.
What is the Percentage of Population Employed in Security & Protection in Belleville, IL?
Percentage of Population Employed in Security & Protection in Belleville is 2.3%.
What is the Percentage of Population Employed in Security & Protection in Illinois?
Percentage of Population Employed in Security & Protection in Illinois is 2.2%.
What is the Percentage of Population Employed in Security & Protection in the United States?
Percentage of Population Employed in Security & Protection in the United States is 2.1%.