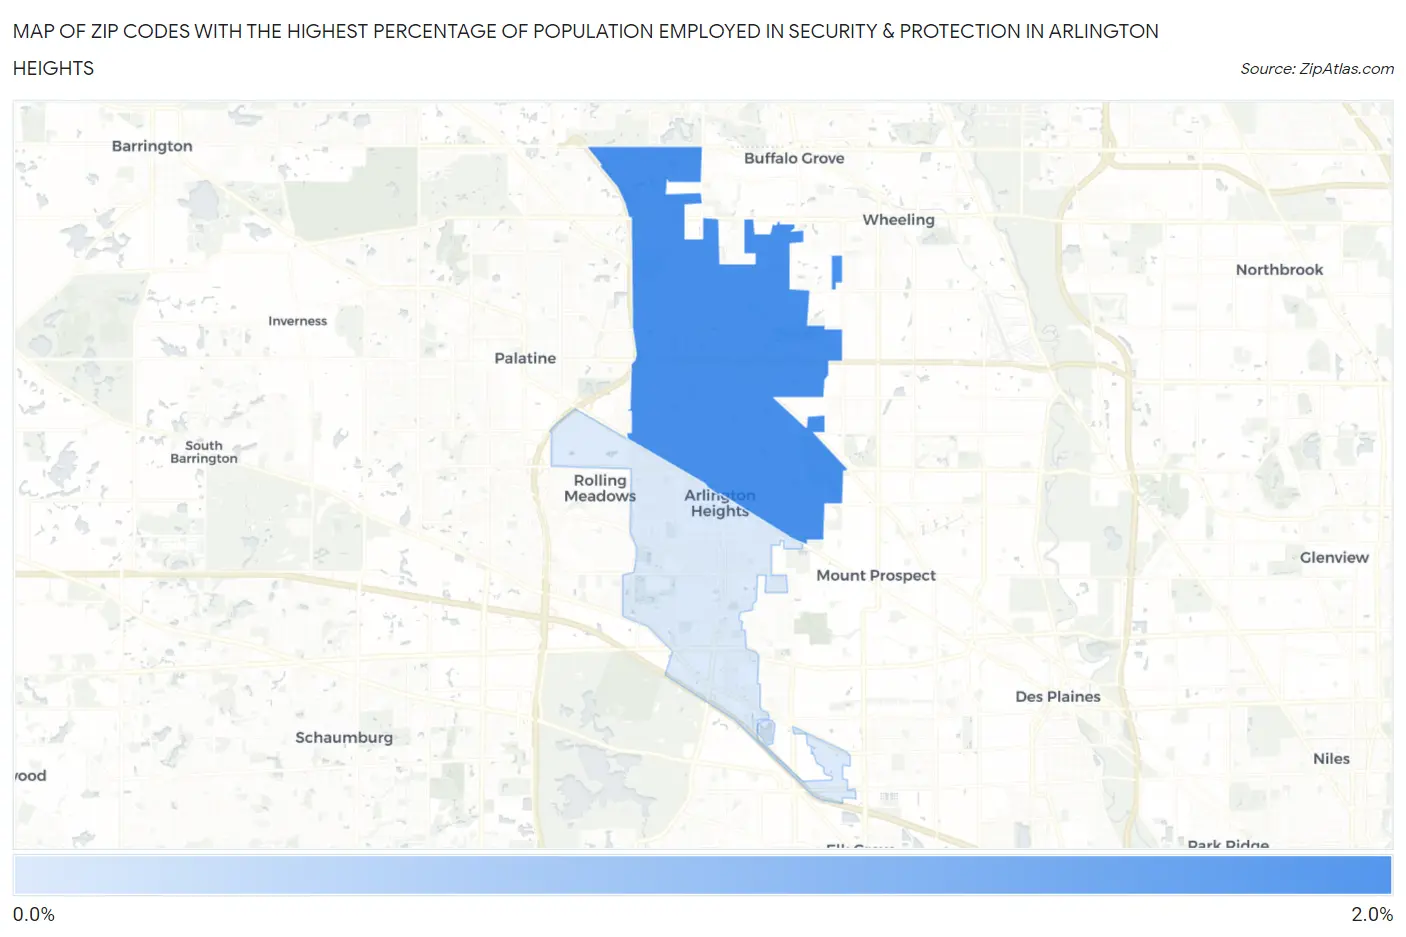
Zip Codes with the Highest Percentage of Population Employed in Security & Protection in Arlington Heights, IL
RELATED REPORTS & OPTIONS
Security & Protection
Arlington Heights
Compare Zip Codes
Map of Zip Codes with the Highest Percentage of Population Employed in Security & Protection in Arlington Heights
0.37%
1.6%
Zip Codes with the Highest Percentage of Population Employed in Security & Protection in Arlington Heights, IL
| Zip Code | % Employed | vs State | vs National | |
| 1. | 60004 | 1.6% | 2.2%(-0.635)#681 | 2.1%(-0.591)#15,749 |
| 2. | 60005 | 0.37% | 2.2%(-1.82)#1,079 | 2.1%(-1.77)#23,854 |
1
Common Questions
What are the Top Zip Codes with the Highest Percentage of Population Employed in Security & Protection in Arlington Heights, IL?
Top Zip Codes with the Highest Percentage of Population Employed in Security & Protection in Arlington Heights, IL are:
What zip code has the Highest Percentage of Population Employed in Security & Protection in Arlington Heights, IL?
60004 has the Highest Percentage of Population Employed in Security & Protection in Arlington Heights, IL with 1.6%.
What is the Percentage of Population Employed in Security & Protection in Arlington Heights, IL?
Percentage of Population Employed in Security & Protection in Arlington Heights is 1.2%.
What is the Percentage of Population Employed in Security & Protection in Illinois?
Percentage of Population Employed in Security & Protection in Illinois is 2.2%.
What is the Percentage of Population Employed in Security & Protection in the United States?
Percentage of Population Employed in Security & Protection in the United States is 2.1%.