Zip Codes with the Highest Percentage of Population Employed in Security & Protection in Palatine, IL
RELATED REPORTS & OPTIONS
Security & Protection
Palatine
Compare Zip Codes
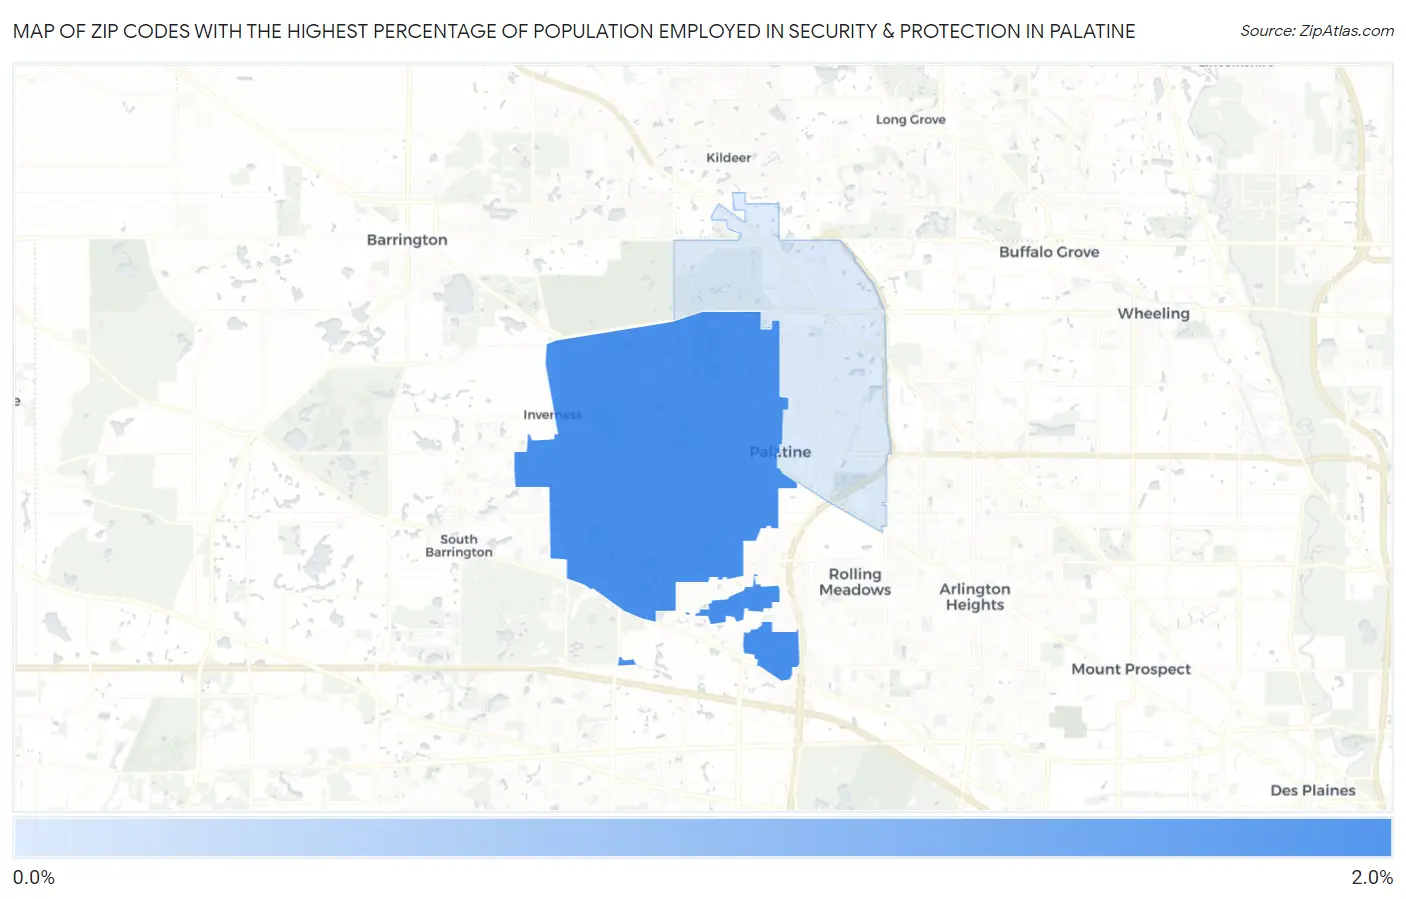
Map of Zip Codes with the Highest Percentage of Population Employed in Security & Protection in Palatine
0.52%
1.6%
Zip Codes with the Highest Percentage of Population Employed in Security & Protection in Palatine, IL
| Zip Code | % Employed | vs State | vs National | |
| 1. | 60067 | 1.6% | 2.2%(-0.600)#665 | 2.1%(-0.557)#15,474 |
| 2. | 60074 | 0.52% | 2.2%(-1.67)#1,044 | 2.1%(-1.63)#23,136 |
1
Common Questions
What are the Top Zip Codes with the Highest Percentage of Population Employed in Security & Protection in Palatine, IL?
Top Zip Codes with the Highest Percentage of Population Employed in Security & Protection in Palatine, IL are:
What zip code has the Highest Percentage of Population Employed in Security & Protection in Palatine, IL?
60067 has the Highest Percentage of Population Employed in Security & Protection in Palatine, IL with 1.6%.
What is the Percentage of Population Employed in Security & Protection in Palatine, IL?
Percentage of Population Employed in Security & Protection in Palatine is 1.2%.
What is the Percentage of Population Employed in Security & Protection in Illinois?
Percentage of Population Employed in Security & Protection in Illinois is 2.2%.
What is the Percentage of Population Employed in Security & Protection in the United States?
Percentage of Population Employed in Security & Protection in the United States is 2.1%.