Zip Codes with the Highest Percentage of Population Employed in Security & Protection in Quincy, IL
RELATED REPORTS & OPTIONS
Security & Protection
Quincy
Compare Zip Codes
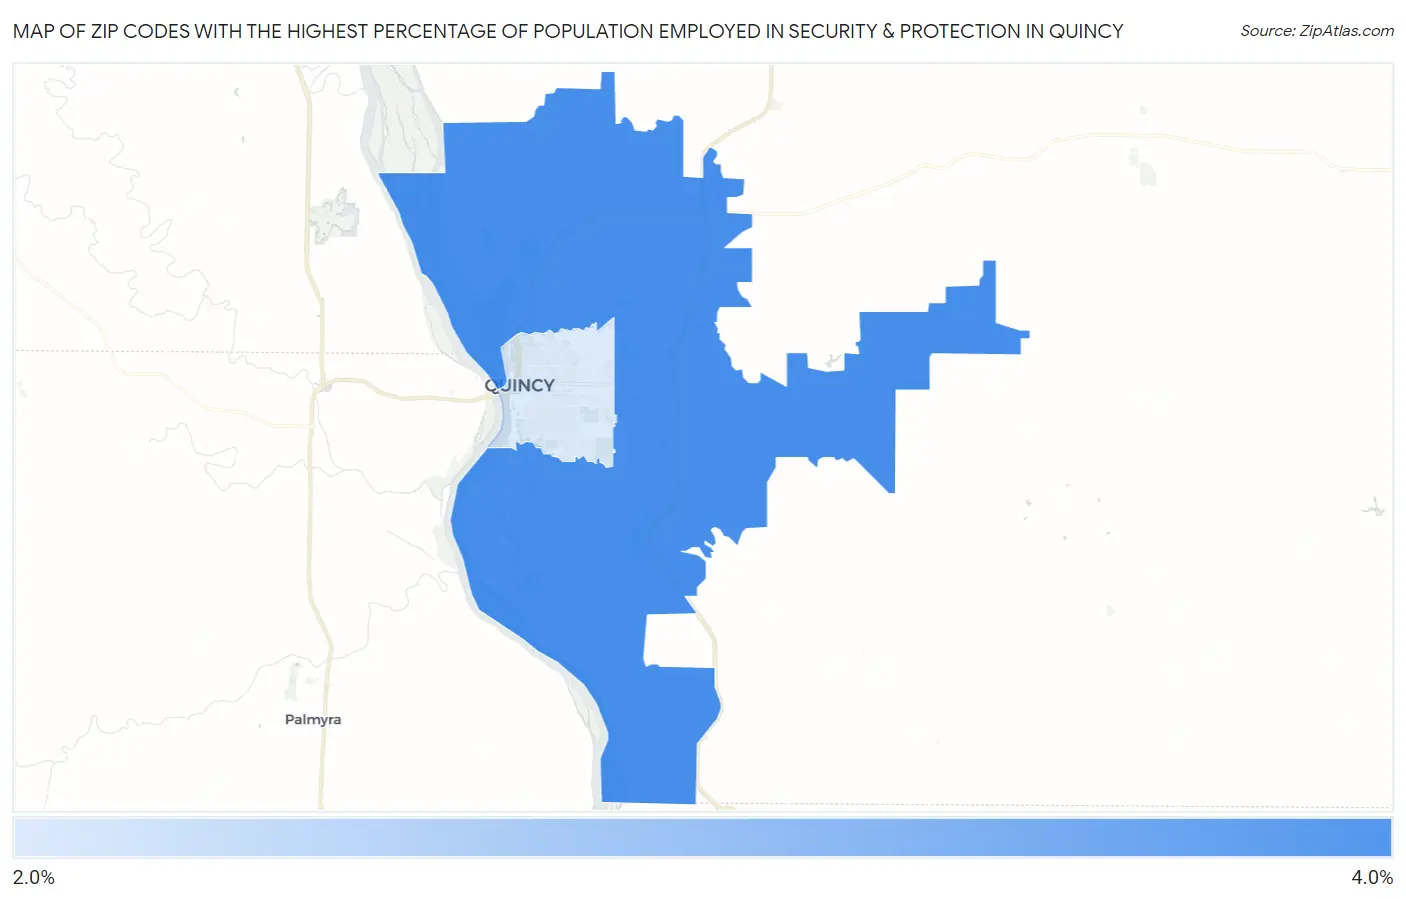
Map of Zip Codes with the Highest Percentage of Population Employed in Security & Protection in Quincy
2.1%
3.6%
Zip Codes with the Highest Percentage of Population Employed in Security & Protection in Quincy, IL
| Zip Code | % Employed | vs State | vs National | |
| 1. | 62305 | 3.6% | 2.2%(+1.36)#225 | 2.1%(+1.40)#5,531 |
| 2. | 62301 | 2.1% | 2.2%(-0.043)#498 | 2.1%(+0.000)#11,586 |
1
Common Questions
What are the Top Zip Codes with the Highest Percentage of Population Employed in Security & Protection in Quincy, IL?
Top Zip Codes with the Highest Percentage of Population Employed in Security & Protection in Quincy, IL are:
What zip code has the Highest Percentage of Population Employed in Security & Protection in Quincy, IL?
62305 has the Highest Percentage of Population Employed in Security & Protection in Quincy, IL with 3.6%.
What is the Percentage of Population Employed in Security & Protection in Quincy, IL?
Percentage of Population Employed in Security & Protection in Quincy is 2.9%.
What is the Percentage of Population Employed in Security & Protection in Illinois?
Percentage of Population Employed in Security & Protection in Illinois is 2.2%.
What is the Percentage of Population Employed in Security & Protection in the United States?
Percentage of Population Employed in Security & Protection in the United States is 2.1%.