Zip Codes with the Highest Percentage of Population Employed in Security & Protection in Champaign, IL
RELATED REPORTS & OPTIONS
Security & Protection
Champaign
Compare Zip Codes
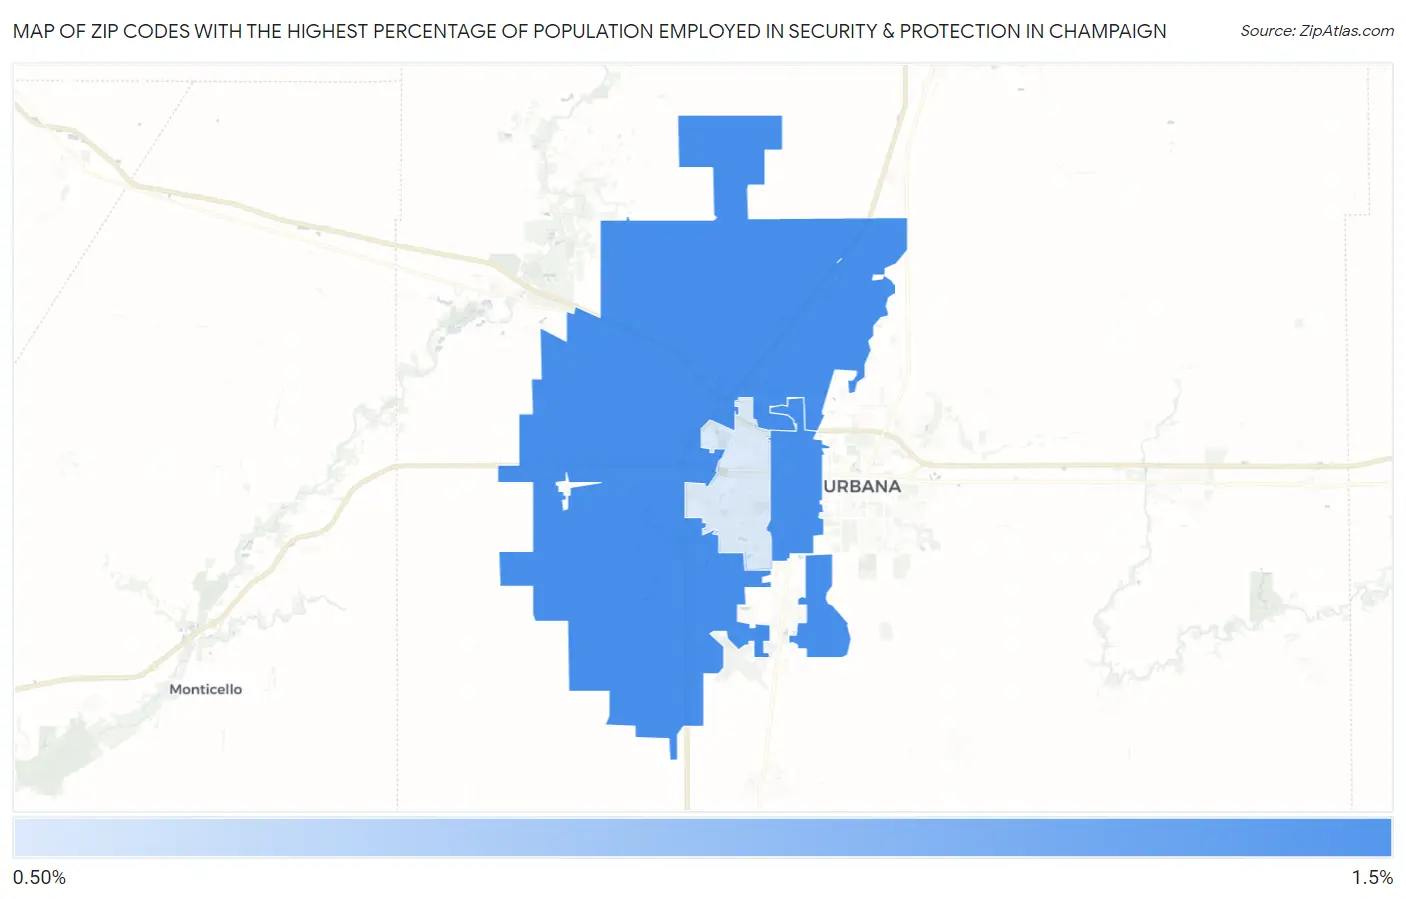
Map of Zip Codes with the Highest Percentage of Population Employed in Security & Protection in Champaign
0.70%
1.3%
Zip Codes with the Highest Percentage of Population Employed in Security & Protection in Champaign, IL
| Zip Code | % Employed | vs State | vs National | |
| 1. | 61820 | 1.3% | 2.2%(-0.864)#768 | 2.1%(-0.821)#17,511 |
| 2. | 61822 | 1.3% | 2.2%(-0.864)#769 | 2.1%(-0.821)#17,513 |
| 3. | 61821 | 0.70% | 2.2%(-1.49)#988 | 2.1%(-1.45)#22,069 |
1
Common Questions
What are the Top Zip Codes with the Highest Percentage of Population Employed in Security & Protection in Champaign, IL?
Top Zip Codes with the Highest Percentage of Population Employed in Security & Protection in Champaign, IL are:
What zip code has the Highest Percentage of Population Employed in Security & Protection in Champaign, IL?
61820 has the Highest Percentage of Population Employed in Security & Protection in Champaign, IL with 1.3%.
What is the Percentage of Population Employed in Security & Protection in Champaign, IL?
Percentage of Population Employed in Security & Protection in Champaign is 1.1%.
What is the Percentage of Population Employed in Security & Protection in Illinois?
Percentage of Population Employed in Security & Protection in Illinois is 2.2%.
What is the Percentage of Population Employed in Security & Protection in the United States?
Percentage of Population Employed in Security & Protection in the United States is 2.1%.