Zip Codes with the Highest Percentage of Population Employed in Security & Protection in Orland Park, IL
RELATED REPORTS & OPTIONS
Security & Protection
Orland Park
Compare Zip Codes
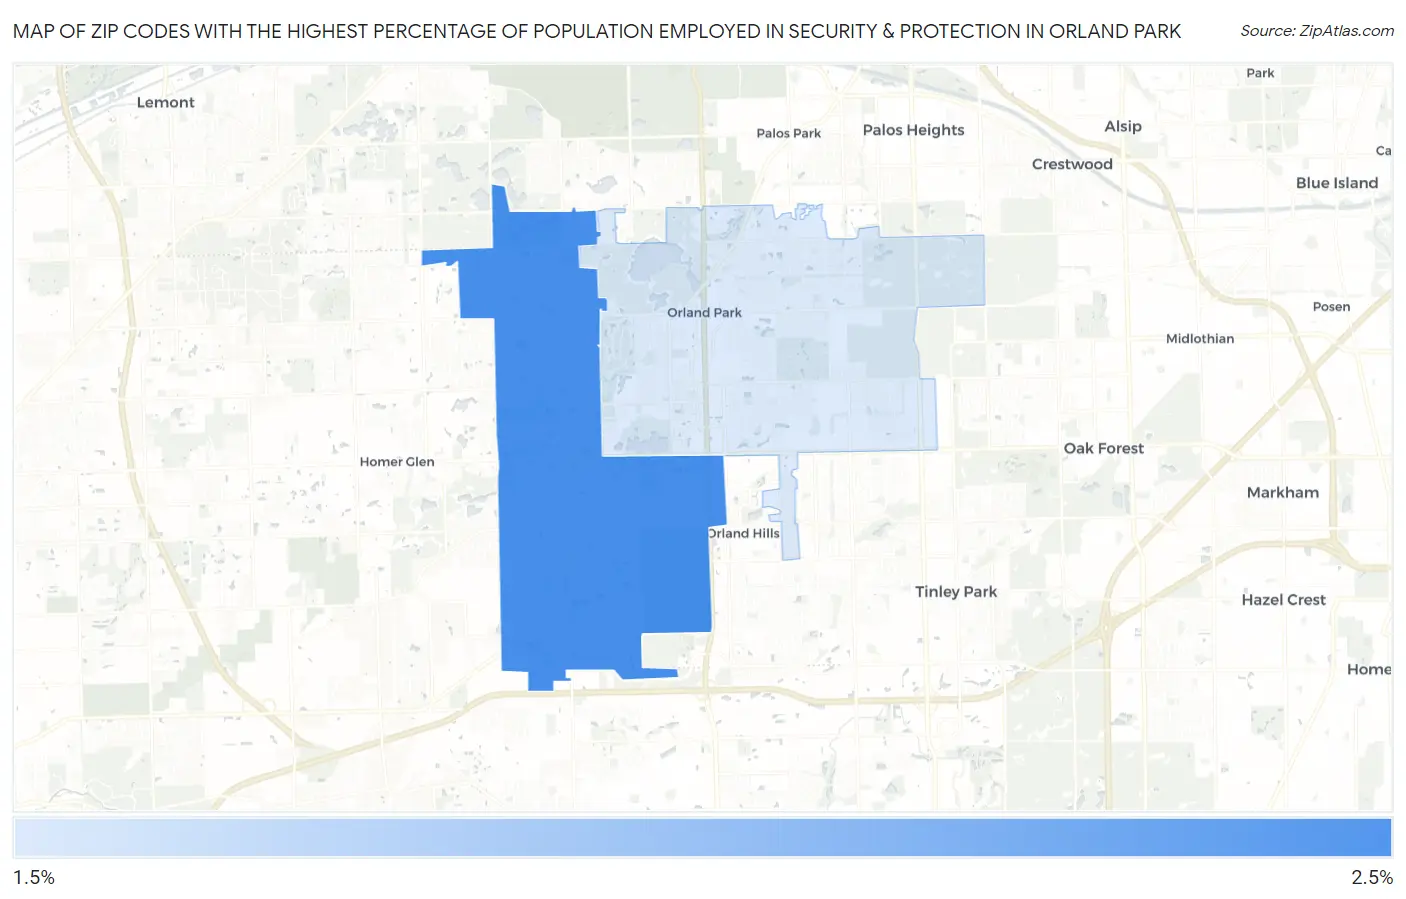
Map of Zip Codes with the Highest Percentage of Population Employed in Security & Protection in Orland Park
2.3%
2.3%
Zip Codes with the Highest Percentage of Population Employed in Security & Protection in Orland Park, IL
| Zip Code | % Employed | vs State | vs National | |
| 1. | 60467 | 2.3% | 2.2%(+0.145)#436 | 2.1%(+0.188)#10,424 |
| 2. | 60462 | 2.3% | 2.2%(+0.073)#464 | 2.1%(+0.117)#10,853 |
1
Common Questions
What are the Top Zip Codes with the Highest Percentage of Population Employed in Security & Protection in Orland Park, IL?
Top Zip Codes with the Highest Percentage of Population Employed in Security & Protection in Orland Park, IL are:
What zip code has the Highest Percentage of Population Employed in Security & Protection in Orland Park, IL?
60467 has the Highest Percentage of Population Employed in Security & Protection in Orland Park, IL with 2.3%.
What is the Percentage of Population Employed in Security & Protection in Orland Park, IL?
Percentage of Population Employed in Security & Protection in Orland Park is 2.3%.
What is the Percentage of Population Employed in Security & Protection in Illinois?
Percentage of Population Employed in Security & Protection in Illinois is 2.2%.
What is the Percentage of Population Employed in Security & Protection in the United States?
Percentage of Population Employed in Security & Protection in the United States is 2.1%.