Zip Codes with the Highest Percentage of Population with a Degree in Literature and Languages in Idaho
RELATED REPORTS & OPTIONS
Literature and Languages
Idaho
Compare Zip Codes
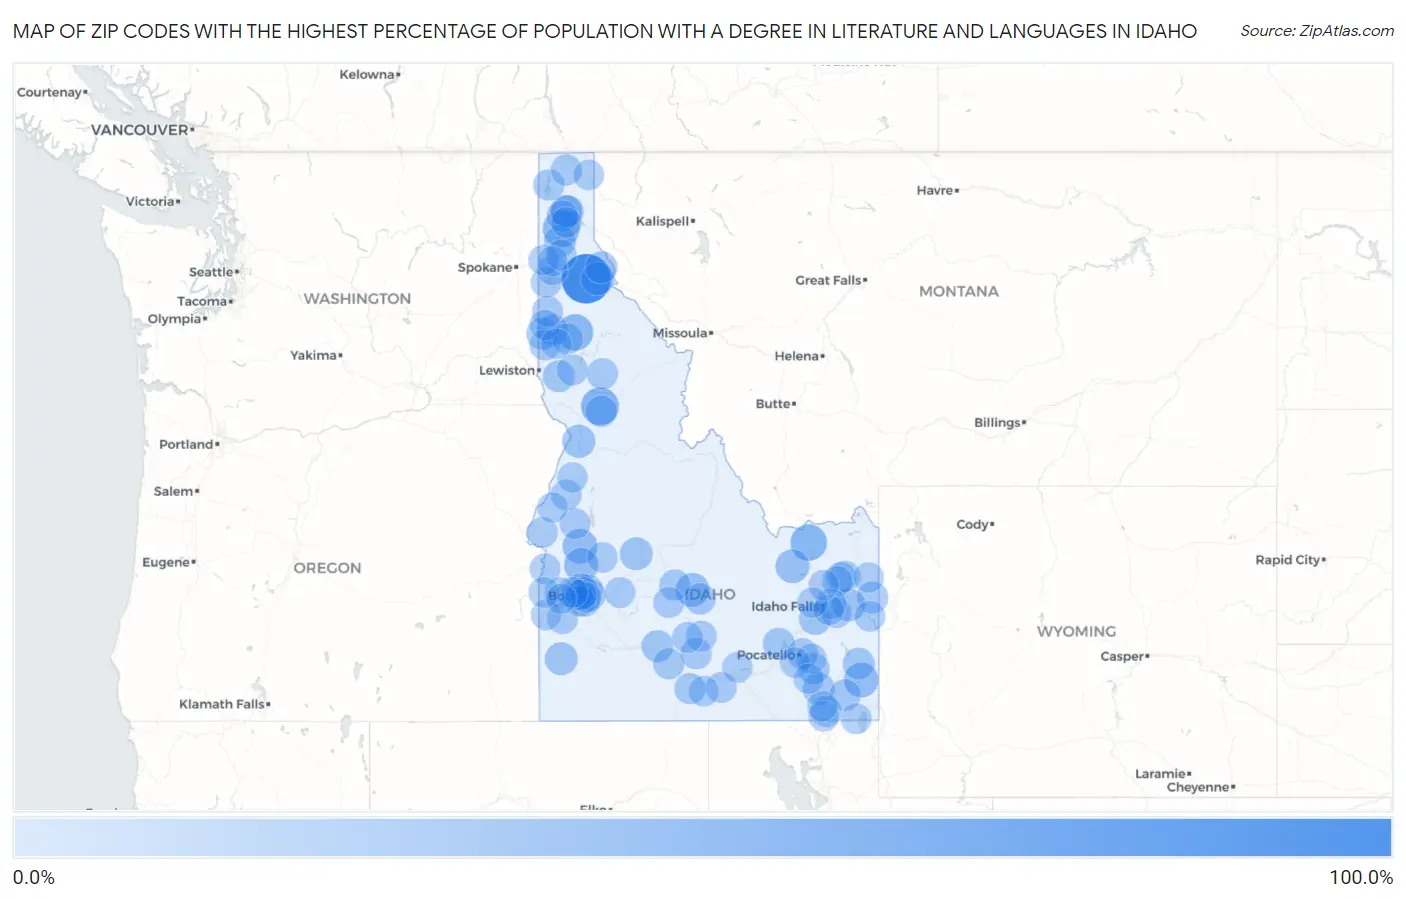
Map of Zip Codes with the Highest Percentage of Population with a Degree in Literature and Languages in Idaho
0.0%
100.0%
Zip Codes with the Highest Percentage of Population with a Degree in Literature and Languages in Idaho
| Zip Code | % Graduates | vs State | vs National | |
| 1. | 83868 | 100.0% | 3.9%(+96.1)#1 | 4.4%(+95.6)#2 |
| 2. | 83552 | 39.7% | 3.9%(+35.8)#2 | 4.4%(+35.3)#121 |
| 3. | 83813 | 34.8% | 3.9%(+30.9)#3 | 4.4%(+30.4)#151 |
| 4. | 83423 | 33.3% | 3.9%(+29.4)#4 | 4.4%(+28.9)#157 |
| 5. | 83806 | 33.3% | 3.9%(+29.4)#5 | 4.4%(+28.9)#164 |
| 6. | 83657 | 25.0% | 3.9%(+21.1)#6 | 4.4%(+20.6)#309 |
| 7. | 83239 | 24.3% | 3.9%(+20.4)#7 | 4.4%(+19.9)#325 |
| 8. | 83670 | 22.8% | 3.9%(+18.9)#8 | 4.4%(+18.4)#362 |
| 9. | 83353 | 20.9% | 3.9%(+16.9)#9 | 4.4%(+16.5)#444 |
| 10. | 83435 | 20.4% | 3.9%(+16.4)#10 | 4.4%(+16.0)#460 |
| 11. | 83849 | 16.7% | 3.9%(+12.7)#11 | 4.4%(+12.3)#648 |
| 12. | 83542 | 16.7% | 3.9%(+12.7)#12 | 4.4%(+12.3)#657 |
| 13. | 83650 | 15.7% | 3.9%(+11.8)#13 | 4.4%(+11.3)#753 |
| 14. | 83443 | 15.5% | 3.9%(+11.5)#14 | 4.4%(+11.1)#776 |
| 15. | 83637 | 15.4% | 3.9%(+11.5)#15 | 4.4%(+11.0)#783 |
| 16. | 83840 | 13.5% | 3.9%(+9.58)#16 | 4.4%(+9.10)#977 |
| 17. | 83218 | 12.5% | 3.9%(+8.57)#17 | 4.4%(+8.09)#1,143 |
| 18. | 83234 | 12.2% | 3.9%(+8.30)#18 | 4.4%(+7.82)#1,184 |
| 19. | 83873 | 12.1% | 3.9%(+8.20)#19 | 4.4%(+7.72)#1,196 |
| 20. | 83314 | 11.9% | 3.9%(+7.96)#20 | 4.4%(+7.48)#1,243 |
| 21. | 83872 | 11.8% | 3.9%(+7.88)#21 | 4.4%(+7.40)#1,253 |
| 22. | 83801 | 11.5% | 3.9%(+7.56)#22 | 4.4%(+7.08)#1,333 |
| 23. | 83852 | 11.0% | 3.9%(+7.10)#23 | 4.4%(+6.62)#1,466 |
| 24. | 83210 | 10.8% | 3.9%(+6.82)#24 | 4.4%(+6.34)#1,541 |
| 25. | 83524 | 10.6% | 3.9%(+6.69)#25 | 4.4%(+6.21)#1,588 |
| 26. | 83276 | 10.6% | 3.9%(+6.65)#26 | 4.4%(+6.18)#1,601 |
| 27. | 83283 | 9.8% | 3.9%(+5.83)#27 | 4.4%(+5.35)#1,933 |
| 28. | 83455 | 9.6% | 3.9%(+5.63)#28 | 4.4%(+5.15)#2,013 |
| 29. | 83825 | 9.1% | 3.9%(+5.16)#29 | 4.4%(+4.68)#2,280 |
| 30. | 83333 | 9.0% | 3.9%(+5.08)#30 | 4.4%(+4.60)#2,310 |
| 31. | 83250 | 8.4% | 3.9%(+4.47)#31 | 4.4%(+3.99)#2,681 |
| 32. | 83530 | 8.0% | 3.9%(+4.05)#32 | 4.4%(+3.57)#3,000 |
| 33. | 83857 | 7.8% | 3.9%(+3.85)#33 | 4.4%(+3.37)#3,182 |
| 34. | 83324 | 7.7% | 3.9%(+3.76)#34 | 4.4%(+3.28)#3,265 |
| 35. | 83712 | 7.6% | 3.9%(+3.69)#35 | 4.4%(+3.21)#3,339 |
| 36. | 83232 | 7.6% | 3.9%(+3.65)#36 | 4.4%(+3.17)#3,375 |
| 37. | 83355 | 7.4% | 3.9%(+3.51)#37 | 4.4%(+3.03)#3,509 |
| 38. | 83702 | 7.4% | 3.9%(+3.44)#38 | 4.4%(+2.96)#3,588 |
| 39. | 83821 | 7.3% | 3.9%(+3.39)#39 | 4.4%(+2.91)#3,648 |
| 40. | 83340 | 7.2% | 3.9%(+3.25)#40 | 4.4%(+2.77)#3,774 |
| 41. | 83805 | 7.1% | 3.9%(+3.16)#41 | 4.4%(+2.68)#3,880 |
| 42. | 83341 | 6.9% | 3.9%(+2.94)#42 | 4.4%(+2.46)#4,146 |
| 43. | 83553 | 6.9% | 3.9%(+2.93)#43 | 4.4%(+2.45)#4,159 |
| 44. | 83545 | 6.7% | 3.9%(+2.74)#44 | 4.4%(+2.26)#4,408 |
| 45. | 83201 | 6.3% | 3.9%(+2.38)#45 | 4.4%(+1.90)#4,913 |
| 46. | 83632 | 6.2% | 3.9%(+2.24)#46 | 4.4%(+1.76)#5,134 |
| 47. | 83427 | 6.1% | 3.9%(+2.20)#47 | 4.4%(+1.72)#5,204 |
| 48. | 83612 | 6.1% | 3.9%(+2.15)#48 | 4.4%(+1.67)#5,304 |
| 49. | 83327 | 6.0% | 3.9%(+2.03)#49 | 4.4%(+1.55)#5,477 |
| 50. | 83641 | 5.9% | 3.9%(+2.02)#50 | 4.4%(+1.54)#5,509 |
| 51. | 83349 | 5.9% | 3.9%(+1.95)#51 | 4.4%(+1.47)#5,630 |
| 52. | 83870 | 5.7% | 3.9%(+1.82)#52 | 4.4%(+1.34)#5,850 |
| 53. | 83451 | 5.7% | 3.9%(+1.81)#53 | 4.4%(+1.33)#5,867 |
| 54. | 83714 | 5.7% | 3.9%(+1.76)#54 | 4.4%(+1.28)#5,954 |
| 55. | 83352 | 5.5% | 3.9%(+1.58)#55 | 4.4%(+1.10)#6,295 |
| 56. | 83843 | 5.5% | 3.9%(+1.57)#56 | 4.4%(+1.09)#6,324 |
| 57. | 83823 | 5.4% | 3.9%(+1.51)#57 | 4.4%(+1.03)#6,428 |
| 58. | 83318 | 5.3% | 3.9%(+1.35)#58 | 4.4%(+0.866)#6,777 |
| 59. | 83716 | 5.2% | 3.9%(+1.26)#59 | 4.4%(+0.782)#6,965 |
| 60. | 83448 | 5.1% | 3.9%(+1.19)#60 | 4.4%(+0.714)#7,087 |
| 61. | 83287 | 5.1% | 3.9%(+1.17)#61 | 4.4%(+0.692)#7,120 |
| 62. | 83705 | 4.9% | 3.9%(+0.994)#62 | 4.4%(+0.515)#7,547 |
| 63. | 83619 | 4.8% | 3.9%(+0.874)#63 | 4.4%(+0.394)#7,875 |
| 64. | 83876 | 4.8% | 3.9%(+0.860)#64 | 4.4%(+0.381)#7,911 |
| 65. | 83672 | 4.7% | 3.9%(+0.819)#65 | 4.4%(+0.340)#8,048 |
| 66. | 83428 | 4.7% | 3.9%(+0.804)#66 | 4.4%(+0.324)#8,076 |
| 67. | 83703 | 4.6% | 3.9%(+0.707)#67 | 4.4%(+0.227)#8,337 |
| 68. | 83814 | 4.6% | 3.9%(+0.672)#68 | 4.4%(+0.192)#8,421 |
| 69. | 83854 | 4.5% | 3.9%(+0.607)#69 | 4.4%(+0.128)#8,626 |
| 70. | 83713 | 4.5% | 3.9%(+0.587)#70 | 4.4%(+0.107)#8,675 |
| 71. | 83855 | 4.5% | 3.9%(+0.555)#71 | 4.4%(+0.076)#8,752 |
| 72. | 83709 | 4.4% | 3.9%(+0.499)#72 | 4.4%(+0.019)#8,915 |
| 73. | 83845 | 4.4% | 3.9%(+0.469)#73 | 4.4%(-0.011)#8,995 |
| 74. | 83344 | 4.4% | 3.9%(+0.456)#74 | 4.4%(-0.024)#9,038 |
| 75. | 83605 | 4.3% | 3.9%(+0.374)#75 | 4.4%(-0.105)#9,285 |
| 76. | 83639 | 4.3% | 3.9%(+0.351)#76 | 4.4%(-0.128)#9,366 |
| 77. | 83706 | 4.3% | 3.9%(+0.328)#77 | 4.4%(-0.152)#9,430 |
| 78. | 83245 | 4.3% | 3.9%(+0.325)#78 | 4.4%(-0.154)#9,435 |
| 79. | 83622 | 4.2% | 3.9%(+0.282)#79 | 4.4%(-0.197)#9,565 |
| 80. | 83286 | 4.2% | 3.9%(+0.236)#80 | 4.4%(-0.243)#9,713 |
| 81. | 83860 | 4.2% | 3.9%(+0.228)#81 | 4.4%(-0.251)#9,747 |
| 82. | 83835 | 4.1% | 3.9%(+0.176)#82 | 4.4%(-0.303)#9,890 |
| 83. | 83704 | 4.1% | 3.9%(+0.161)#83 | 4.4%(-0.318)#9,939 |
| 84. | 83204 | 4.1% | 3.9%(+0.154)#84 | 4.4%(-0.325)#9,949 |
| 85. | 83646 | 4.0% | 3.9%(+0.108)#85 | 4.4%(-0.371)#10,081 |
| 86. | 83871 | 4.0% | 3.9%(+0.087)#86 | 4.4%(-0.392)#10,133 |
| 87. | 83676 | 4.0% | 3.9%(+0.024)#87 | 4.4%(-0.456)#10,320 |
| 88. | 83440 | 3.8% | 3.9%(-0.094)#88 | 4.4%(-0.574)#10,708 |
| 89. | 83401 | 3.7% | 3.9%(-0.193)#89 | 4.4%(-0.672)#11,034 |
| 90. | 83228 | 3.6% | 3.9%(-0.281)#90 | 4.4%(-0.760)#11,328 |
| 91. | 83815 | 3.6% | 3.9%(-0.298)#91 | 4.4%(-0.777)#11,374 |
| 92. | 83406 | 3.6% | 3.9%(-0.300)#92 | 4.4%(-0.780)#11,383 |
| 93. | 83434 | 3.6% | 3.9%(-0.320)#93 | 4.4%(-0.800)#11,458 |
| 94. | 83214 | 3.5% | 3.9%(-0.401)#94 | 4.4%(-0.880)#11,750 |
| 95. | 83610 | 3.5% | 3.9%(-0.458)#95 | 4.4%(-0.937)#11,945 |
| 96. | 83350 | 3.5% | 3.9%(-0.460)#96 | 4.4%(-0.939)#11,951 |
| 97. | 83402 | 3.4% | 3.9%(-0.506)#97 | 4.4%(-0.985)#12,101 |
| 98. | 83654 | 3.4% | 3.9%(-0.535)#98 | 4.4%(-1.01)#12,200 |
| 99. | 83651 | 3.4% | 3.9%(-0.578)#99 | 4.4%(-1.06)#12,338 |
| 100. | 83452 | 3.3% | 3.9%(-0.611)#100 | 4.4%(-1.09)#12,464 |
Common Questions
What are the Top 10 Zip Codes with the Highest Percentage of Population with a Degree in Literature and Languages in Idaho?
Top 10 Zip Codes with the Highest Percentage of Population with a Degree in Literature and Languages in Idaho are:
What zip code has the Highest Percentage of Population with a Degree in Literature and Languages in Idaho?
83868 has the Highest Percentage of Population with a Degree in Literature and Languages in Idaho with 100.0%.
What is the Percentage of Population with a Degree in Literature and Languages in the State of Idaho?
Percentage of Population with a Degree in Literature and Languages in Idaho is 3.9%.
What is the Percentage of Population with a Degree in Literature and Languages in the United States?
Percentage of Population with a Degree in Literature and Languages in the United States is 4.4%.