Zip Codes with the Highest Percentage of Population Employed in Installation, Maintenance & Repair in Idaho
RELATED REPORTS & OPTIONS
Installation, Maintenance & Repair
Idaho
Compare Zip Codes
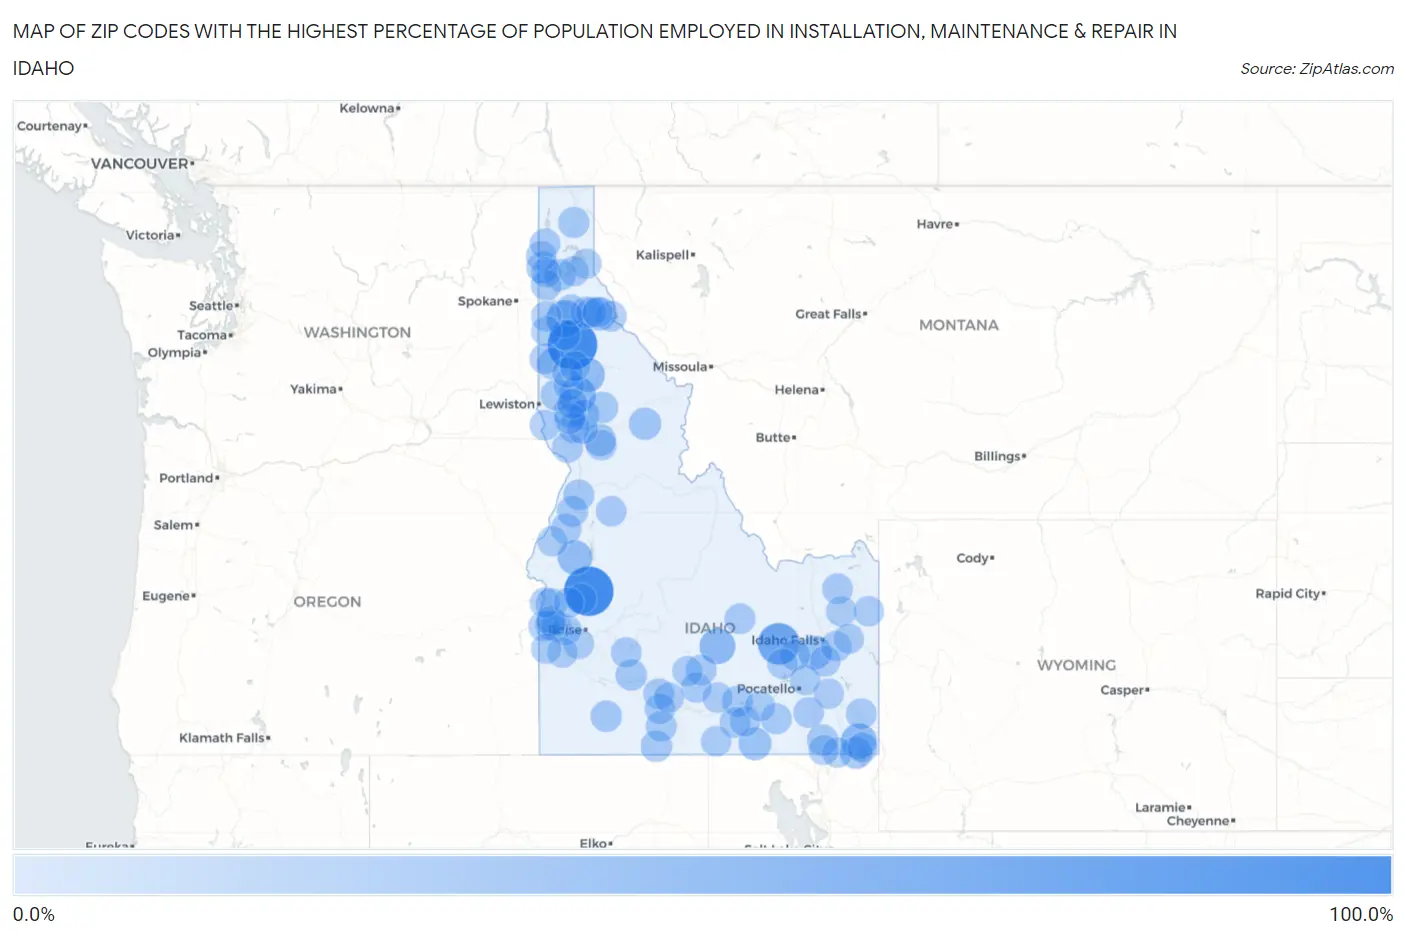
Map of Zip Codes with the Highest Percentage of Population Employed in Installation, Maintenance & Repair in Idaho
0.0%
100.0%
Zip Codes with the Highest Percentage of Population Employed in Installation, Maintenance & Repair in Idaho
| Zip Code | % Employed | vs State | vs National | |
| 1. | 83866 | 100.0% | 3.5%(+96.5)#1 | 3.1%(+96.9)#2 |
| 2. | 83602 | 100.0% | 3.5%(+96.5)#2 | 3.1%(+96.9)#13 |
| 3. | 83215 | 60.0% | 3.5%(+56.5)#3 | 3.1%(+56.9)#30 |
| 4. | 83842 | 38.1% | 3.5%(+34.6)#4 | 3.1%(+35.0)#105 |
| 5. | 83520 | 35.5% | 3.5%(+31.9)#5 | 3.1%(+32.4)#124 |
| 6. | 83223 | 31.1% | 3.5%(+27.6)#6 | 3.1%(+28.0)#158 |
| 7. | 83320 | 31.0% | 3.5%(+27.5)#7 | 3.1%(+28.0)#159 |
| 8. | 83827 | 25.3% | 3.5%(+21.8)#8 | 3.1%(+22.3)#237 |
| 9. | 83632 | 25.2% | 3.5%(+21.7)#9 | 3.1%(+22.1)#240 |
| 10. | 83867 | 20.4% | 3.5%(+16.8)#10 | 3.1%(+17.3)#372 |
| 11. | 83218 | 19.7% | 3.5%(+16.2)#11 | 3.1%(+16.7)#404 |
| 12. | 83342 | 17.5% | 3.5%(+13.9)#12 | 3.1%(+14.4)#557 |
| 13. | 83548 | 16.0% | 3.5%(+12.5)#13 | 3.1%(+12.9)#680 |
| 14. | 83287 | 15.8% | 3.5%(+12.3)#14 | 3.1%(+12.7)#705 |
| 15. | 83539 | 13.8% | 3.5%(+10.3)#15 | 3.1%(+10.8)#948 |
| 16. | 83552 | 13.1% | 3.5%(+9.56)#16 | 3.1%(+10.0)#1,079 |
| 17. | 83804 | 12.8% | 3.5%(+9.23)#17 | 3.1%(+9.70)#1,146 |
| 18. | 83801 | 11.1% | 3.5%(+7.60)#18 | 3.1%(+8.07)#1,574 |
| 19. | 83302 | 10.5% | 3.5%(+6.93)#19 | 3.1%(+7.40)#1,821 |
| 20. | 83868 | 9.9% | 3.5%(+6.36)#20 | 3.1%(+6.84)#2,065 |
| 21. | 83623 | 9.7% | 3.5%(+6.11)#21 | 3.1%(+6.58)#2,175 |
| 22. | 83604 | 9.6% | 3.5%(+6.05)#22 | 3.1%(+6.52)#2,207 |
| 23. | 83543 | 8.9% | 3.5%(+5.36)#23 | 3.1%(+5.83)#2,628 |
| 24. | 83535 | 8.8% | 3.5%(+5.28)#24 | 3.1%(+5.75)#2,684 |
| 25. | 83553 | 8.7% | 3.5%(+5.18)#25 | 3.1%(+5.65)#2,747 |
| 26. | 83655 | 8.6% | 3.5%(+5.05)#26 | 3.1%(+5.52)#2,827 |
| 27. | 83847 | 8.5% | 3.5%(+4.96)#27 | 3.1%(+5.43)#2,884 |
| 28. | 83228 | 8.5% | 3.5%(+4.94)#28 | 3.1%(+5.41)#2,898 |
| 29. | 83857 | 8.4% | 3.5%(+4.84)#29 | 3.1%(+5.31)#2,967 |
| 30. | 83350 | 8.1% | 3.5%(+4.53)#30 | 3.1%(+5.01)#3,242 |
| 31. | 83654 | 8.0% | 3.5%(+4.45)#31 | 3.1%(+4.92)#3,329 |
| 32. | 83321 | 7.8% | 3.5%(+4.27)#32 | 3.1%(+4.74)#3,511 |
| 33. | 83526 | 7.7% | 3.5%(+4.21)#33 | 3.1%(+4.68)#3,578 |
| 34. | 83547 | 7.6% | 3.5%(+4.08)#34 | 3.1%(+4.55)#3,710 |
| 35. | 83810 | 7.3% | 3.5%(+3.79)#35 | 3.1%(+4.26)#4,013 |
| 36. | 83271 | 7.3% | 3.5%(+3.73)#36 | 3.1%(+4.21)#4,083 |
| 37. | 83332 | 7.2% | 3.5%(+3.69)#37 | 3.1%(+4.16)#4,136 |
| 38. | 83537 | 7.2% | 3.5%(+3.67)#38 | 3.1%(+4.14)#4,163 |
| 39. | 83522 | 7.1% | 3.5%(+3.58)#39 | 3.1%(+4.05)#4,268 |
| 40. | 83846 | 7.1% | 3.5%(+3.52)#40 | 3.1%(+4.00)#4,343 |
| 41. | 83855 | 7.0% | 3.5%(+3.49)#41 | 3.1%(+3.97)#4,383 |
| 42. | 83255 | 6.9% | 3.5%(+3.40)#42 | 3.1%(+3.87)#4,528 |
| 43. | 83445 | 6.9% | 3.5%(+3.34)#43 | 3.1%(+3.81)#4,626 |
| 44. | 83311 | 6.9% | 3.5%(+3.32)#44 | 3.1%(+3.79)#4,658 |
| 45. | 83612 | 6.8% | 3.5%(+3.26)#45 | 3.1%(+3.73)#4,739 |
| 46. | 83530 | 6.6% | 3.5%(+3.06)#46 | 3.1%(+3.53)#5,053 |
| 47. | 83533 | 6.6% | 3.5%(+3.05)#47 | 3.1%(+3.53)#5,060 |
| 48. | 83349 | 6.5% | 3.5%(+2.98)#48 | 3.1%(+3.45)#5,150 |
| 49. | 83236 | 6.4% | 3.5%(+2.88)#49 | 3.1%(+3.35)#5,344 |
| 50. | 83427 | 6.4% | 3.5%(+2.85)#50 | 3.1%(+3.32)#5,398 |
| 51. | 83523 | 6.3% | 3.5%(+2.78)#51 | 3.1%(+3.25)#5,513 |
| 52. | 83239 | 6.2% | 3.5%(+2.69)#52 | 3.1%(+3.17)#5,669 |
| 53. | 83837 | 6.2% | 3.5%(+2.69)#53 | 3.1%(+3.16)#5,675 |
| 54. | 83316 | 6.1% | 3.5%(+2.57)#54 | 3.1%(+3.04)#5,890 |
| 55. | 83822 | 6.1% | 3.5%(+2.54)#55 | 3.1%(+3.01)#5,968 |
| 56. | 83214 | 6.1% | 3.5%(+2.53)#56 | 3.1%(+3.00)#5,979 |
| 57. | 83858 | 6.1% | 3.5%(+2.52)#57 | 3.1%(+2.99)#6,008 |
| 58. | 83670 | 5.9% | 3.5%(+2.39)#58 | 3.1%(+2.86)#6,285 |
| 59. | 83647 | 5.9% | 3.5%(+2.34)#59 | 3.1%(+2.81)#6,406 |
| 60. | 83324 | 5.9% | 3.5%(+2.32)#60 | 3.1%(+2.80)#6,423 |
| 61. | 83221 | 5.8% | 3.5%(+2.24)#61 | 3.1%(+2.71)#6,608 |
| 62. | 83638 | 5.8% | 3.5%(+2.22)#62 | 3.1%(+2.69)#6,658 |
| 63. | 83823 | 5.7% | 3.5%(+2.20)#63 | 3.1%(+2.67)#6,700 |
| 64. | 83501 | 5.7% | 3.5%(+2.14)#64 | 3.1%(+2.61)#6,828 |
| 65. | 83856 | 5.7% | 3.5%(+2.13)#65 | 3.1%(+2.60)#6,853 |
| 66. | 83346 | 5.5% | 3.5%(+1.94)#66 | 3.1%(+2.41)#7,330 |
| 67. | 83634 | 5.5% | 3.5%(+1.94)#67 | 3.1%(+2.41)#7,334 |
| 68. | 83676 | 5.4% | 3.5%(+1.87)#68 | 3.1%(+2.34)#7,508 |
| 69. | 83323 | 5.3% | 3.5%(+1.79)#69 | 3.1%(+2.26)#7,726 |
| 70. | 83607 | 5.3% | 3.5%(+1.75)#70 | 3.1%(+2.22)#7,832 |
| 71. | 83545 | 5.2% | 3.5%(+1.69)#71 | 3.1%(+2.16)#8,020 |
| 72. | 83448 | 5.2% | 3.5%(+1.68)#72 | 3.1%(+2.15)#8,041 |
| 73. | 83687 | 5.2% | 3.5%(+1.67)#73 | 3.1%(+2.14)#8,064 |
| 74. | 83861 | 5.1% | 3.5%(+1.58)#74 | 3.1%(+2.05)#8,329 |
| 75. | 83626 | 5.1% | 3.5%(+1.57)#75 | 3.1%(+2.04)#8,368 |
| 76. | 83610 | 5.1% | 3.5%(+1.55)#76 | 3.1%(+2.02)#8,426 |
| 77. | 83452 | 5.1% | 3.5%(+1.55)#77 | 3.1%(+2.02)#8,431 |
| 78. | 83641 | 5.1% | 3.5%(+1.51)#78 | 3.1%(+1.99)#8,554 |
| 79. | 83262 | 5.0% | 3.5%(+1.42)#79 | 3.1%(+1.89)#8,856 |
| 80. | 83355 | 4.9% | 3.5%(+1.37)#80 | 3.1%(+1.84)#9,004 |
| 81. | 83656 | 4.9% | 3.5%(+1.37)#81 | 3.1%(+1.84)#9,011 |
| 82. | 83619 | 4.8% | 3.5%(+1.27)#82 | 3.1%(+1.75)#9,306 |
| 83. | 83237 | 4.8% | 3.5%(+1.26)#83 | 3.1%(+1.74)#9,340 |
| 84. | 83217 | 4.8% | 3.5%(+1.23)#84 | 3.1%(+1.70)#9,422 |
| 85. | 83443 | 4.7% | 3.5%(+1.20)#85 | 3.1%(+1.67)#9,571 |
| 86. | 83211 | 4.7% | 3.5%(+1.17)#86 | 3.1%(+1.64)#9,644 |
| 87. | 83811 | 4.7% | 3.5%(+1.17)#87 | 3.1%(+1.64)#9,655 |
| 88. | 83876 | 4.7% | 3.5%(+1.16)#88 | 3.1%(+1.63)#9,679 |
| 89. | 83869 | 4.7% | 3.5%(+1.13)#89 | 3.1%(+1.60)#9,804 |
| 90. | 83347 | 4.6% | 3.5%(+1.09)#90 | 3.1%(+1.56)#9,961 |
| 91. | 83849 | 4.6% | 3.5%(+1.07)#91 | 3.1%(+1.54)#10,012 |
| 92. | 83202 | 4.6% | 3.5%(+1.06)#92 | 3.1%(+1.53)#10,048 |
| 93. | 83806 | 4.6% | 3.5%(+1.06)#93 | 3.1%(+1.53)#10,058 |
| 94. | 83272 | 4.6% | 3.5%(+1.04)#94 | 3.1%(+1.51)#10,121 |
| 95. | 83352 | 4.6% | 3.5%(+1.01)#95 | 3.1%(+1.49)#10,219 |
| 96. | 83639 | 4.5% | 3.5%(+0.979)#96 | 3.1%(+1.45)#10,350 |
| 97. | 83617 | 4.5% | 3.5%(+0.949)#97 | 3.1%(+1.42)#10,461 |
| 98. | 83803 | 4.5% | 3.5%(+0.938)#98 | 3.1%(+1.41)#10,509 |
| 99. | 83851 | 4.5% | 3.5%(+0.933)#99 | 3.1%(+1.40)#10,527 |
| 100. | 83286 | 4.4% | 3.5%(+0.844)#100 | 3.1%(+1.32)#10,833 |
Common Questions
What are the Top 10 Zip Codes with the Highest Percentage of Population Employed in Installation, Maintenance & Repair in Idaho?
Top 10 Zip Codes with the Highest Percentage of Population Employed in Installation, Maintenance & Repair in Idaho are:
What zip code has the Highest Percentage of Population Employed in Installation, Maintenance & Repair in Idaho?
83866 has the Highest Percentage of Population Employed in Installation, Maintenance & Repair in Idaho with 100.0%.
What is the Percentage of Population Employed in Installation, Maintenance & Repair in the State of Idaho?
Percentage of Population Employed in Installation, Maintenance & Repair in Idaho is 3.5%.
What is the Percentage of Population Employed in Installation, Maintenance & Repair in the United States?
Percentage of Population Employed in Installation, Maintenance & Repair in the United States is 3.1%.