Zip Codes with the Highest Percentage of Population with a Degree in Physical and Health Sciences in Idaho
RELATED REPORTS & OPTIONS
Physical and Health Sciences
Idaho
Compare Zip Codes
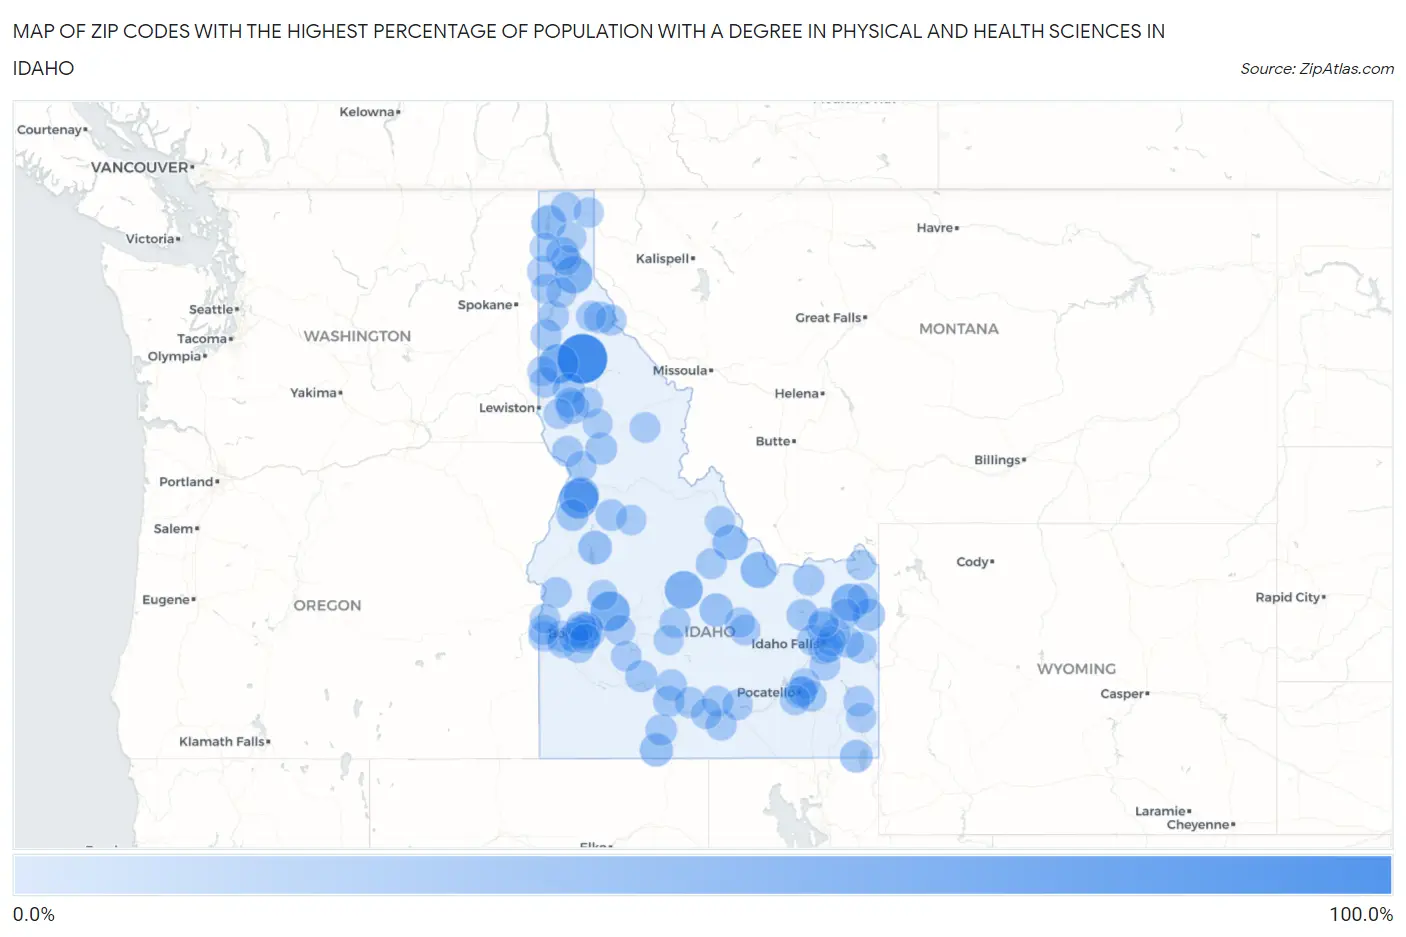
Map of Zip Codes with the Highest Percentage of Population with a Degree in Physical and Health Sciences in Idaho
0.0%
100.0%
Zip Codes with the Highest Percentage of Population with a Degree in Physical and Health Sciences in Idaho
| Zip Code | % Graduates | vs State | vs National | |
| 1. | 83812 | 100.0% | 3.2%(+96.8)#1 | 3.1%(+96.9)#18 |
| 2. | 83834 | 48.7% | 3.2%(+45.5)#2 | 3.1%(+45.6)#72 |
| 3. | 83631 | 48.2% | 3.2%(+45.0)#3 | 3.1%(+45.1)#77 |
| 4. | 83547 | 47.2% | 3.2%(+44.0)#4 | 3.1%(+44.1)#81 |
| 5. | 83227 | 40.8% | 3.2%(+37.6)#5 | 3.1%(+37.7)#100 |
| 6. | 83421 | 38.5% | 3.2%(+35.3)#6 | 3.1%(+35.4)#115 |
| 7. | 83803 | 37.9% | 3.2%(+34.8)#7 | 3.1%(+34.8)#118 |
| 8. | 83464 | 31.7% | 3.2%(+28.5)#8 | 3.1%(+28.6)#173 |
| 9. | 83549 | 28.6% | 3.2%(+25.4)#9 | 3.1%(+25.5)#204 |
| 10. | 83465 | 26.7% | 3.2%(+23.5)#10 | 3.1%(+23.6)#238 |
| 11. | 83821 | 25.2% | 3.2%(+22.0)#11 | 3.1%(+22.1)#267 |
| 12. | 83615 | 19.3% | 3.2%(+16.1)#12 | 3.1%(+16.2)#431 |
| 13. | 83302 | 18.2% | 3.2%(+15.0)#13 | 3.1%(+15.1)#486 |
| 14. | 83251 | 18.0% | 3.2%(+14.8)#14 | 3.1%(+14.9)#498 |
| 15. | 83825 | 15.6% | 3.2%(+12.4)#15 | 3.1%(+12.5)#624 |
| 16. | 83545 | 15.6% | 3.2%(+12.4)#16 | 3.1%(+12.5)#626 |
| 17. | 83287 | 15.3% | 3.2%(+12.1)#17 | 3.1%(+12.2)#650 |
| 18. | 83452 | 14.1% | 3.2%(+10.9)#18 | 3.1%(+11.0)#755 |
| 19. | 83633 | 11.8% | 3.2%(+8.57)#19 | 3.1%(+8.66)#1,040 |
| 20. | 83654 | 11.1% | 3.2%(+7.92)#20 | 3.1%(+8.01)#1,139 |
| 21. | 83431 | 11.0% | 3.2%(+7.78)#21 | 3.1%(+7.88)#1,168 |
| 22. | 83530 | 10.9% | 3.2%(+7.71)#22 | 3.1%(+7.80)#1,187 |
| 23. | 83867 | 10.6% | 3.2%(+7.40)#23 | 3.1%(+7.49)#1,244 |
| 24. | 83450 | 10.1% | 3.2%(+6.91)#24 | 3.1%(+7.00)#1,341 |
| 25. | 83537 | 9.5% | 3.2%(+6.33)#25 | 3.1%(+6.42)#1,485 |
| 26. | 83321 | 9.2% | 3.2%(+5.97)#26 | 3.1%(+6.07)#1,605 |
| 27. | 83638 | 9.1% | 3.2%(+5.88)#27 | 3.1%(+5.97)#1,643 |
| 28. | 83209 | 8.9% | 3.2%(+5.75)#28 | 3.1%(+5.84)#1,683 |
| 29. | 83330 | 7.8% | 3.2%(+4.63)#29 | 3.1%(+4.72)#2,090 |
| 30. | 83355 | 7.7% | 3.2%(+4.55)#30 | 3.1%(+4.64)#2,119 |
| 31. | 83423 | 7.7% | 3.2%(+4.50)#31 | 3.1%(+4.59)#2,149 |
| 32. | 83449 | 7.7% | 3.2%(+4.50)#32 | 3.1%(+4.59)#2,156 |
| 33. | 83851 | 7.0% | 3.2%(+3.80)#33 | 3.1%(+3.89)#2,511 |
| 34. | 83651 | 7.0% | 3.2%(+3.78)#34 | 3.1%(+3.87)#2,526 |
| 35. | 83846 | 6.8% | 3.2%(+3.66)#35 | 3.1%(+3.75)#2,600 |
| 36. | 83318 | 6.6% | 3.2%(+3.42)#36 | 3.1%(+3.51)#2,756 |
| 37. | 83420 | 6.6% | 3.2%(+3.41)#37 | 3.1%(+3.50)#2,766 |
| 38. | 83245 | 6.6% | 3.2%(+3.40)#38 | 3.1%(+3.50)#2,772 |
| 39. | 83338 | 6.5% | 3.2%(+3.36)#39 | 3.1%(+3.45)#2,796 |
| 40. | 83634 | 6.3% | 3.2%(+3.13)#40 | 3.1%(+3.22)#2,974 |
| 41. | 83226 | 6.2% | 3.2%(+2.97)#41 | 3.1%(+3.06)#3,110 |
| 42. | 83661 | 6.1% | 3.2%(+2.90)#42 | 3.1%(+2.99)#3,180 |
| 43. | 83340 | 6.0% | 3.2%(+2.77)#43 | 3.1%(+2.86)#3,302 |
| 44. | 83443 | 6.0% | 3.2%(+2.76)#44 | 3.1%(+2.85)#3,314 |
| 45. | 83347 | 5.9% | 3.2%(+2.72)#45 | 3.1%(+2.81)#3,349 |
| 46. | 83522 | 5.8% | 3.2%(+2.65)#46 | 3.1%(+2.74)#3,429 |
| 47. | 83213 | 5.7% | 3.2%(+2.51)#47 | 3.1%(+2.60)#3,568 |
| 48. | 83404 | 5.6% | 3.2%(+2.44)#48 | 3.1%(+2.53)#3,654 |
| 49. | 83843 | 5.5% | 3.2%(+2.34)#49 | 3.1%(+2.43)#3,789 |
| 50. | 83236 | 5.4% | 3.2%(+2.20)#50 | 3.1%(+2.29)#3,965 |
| 51. | 83712 | 5.3% | 3.2%(+2.07)#51 | 3.1%(+2.17)#4,127 |
| 52. | 83805 | 5.2% | 3.2%(+2.06)#52 | 3.1%(+2.15)#4,160 |
| 53. | 83554 | 5.2% | 3.2%(+2.02)#53 | 3.1%(+2.11)#4,217 |
| 54. | 83335 | 5.1% | 3.2%(+1.86)#54 | 3.1%(+1.96)#4,461 |
| 55. | 83276 | 5.0% | 3.2%(+1.82)#55 | 3.1%(+1.91)#4,515 |
| 56. | 83539 | 4.9% | 3.2%(+1.73)#56 | 3.1%(+1.82)#4,718 |
| 57. | 83804 | 4.9% | 3.2%(+1.73)#57 | 3.1%(+1.82)#4,720 |
| 58. | 83833 | 4.9% | 3.2%(+1.68)#58 | 3.1%(+1.77)#4,786 |
| 59. | 83628 | 4.8% | 3.2%(+1.58)#59 | 3.1%(+1.67)#4,975 |
| 60. | 83350 | 4.7% | 3.2%(+1.47)#60 | 3.1%(+1.56)#5,198 |
| 61. | 83544 | 4.6% | 3.2%(+1.41)#61 | 3.1%(+1.50)#5,326 |
| 62. | 83686 | 4.5% | 3.2%(+1.27)#62 | 3.1%(+1.36)#5,614 |
| 63. | 83716 | 4.4% | 3.2%(+1.22)#63 | 3.1%(+1.31)#5,740 |
| 64. | 83647 | 4.2% | 3.2%(+1.06)#64 | 3.1%(+1.15)#6,081 |
| 65. | 83541 | 4.2% | 3.2%(+1.06)#65 | 3.1%(+1.15)#6,090 |
| 66. | 83402 | 4.2% | 3.2%(+1.03)#66 | 3.1%(+1.12)#6,173 |
| 67. | 83858 | 4.2% | 3.2%(+1.02)#67 | 3.1%(+1.12)#6,175 |
| 68. | 83676 | 4.1% | 3.2%(+0.927)#68 | 3.1%(+1.02)#6,409 |
| 69. | 83442 | 4.1% | 3.2%(+0.922)#69 | 3.1%(+1.01)#6,424 |
| 70. | 83451 | 4.1% | 3.2%(+0.906)#70 | 3.1%(+0.999)#6,469 |
| 71. | 83837 | 4.1% | 3.2%(+0.890)#71 | 3.1%(+0.982)#6,518 |
| 72. | 83703 | 4.0% | 3.2%(+0.796)#72 | 3.1%(+0.888)#6,798 |
| 73. | 83202 | 3.9% | 3.2%(+0.697)#73 | 3.1%(+0.790)#7,078 |
| 74. | 83702 | 3.9% | 3.2%(+0.663)#74 | 3.1%(+0.755)#7,173 |
| 75. | 83706 | 3.8% | 3.2%(+0.612)#75 | 3.1%(+0.704)#7,355 |
| 76. | 83872 | 3.7% | 3.2%(+0.498)#76 | 3.1%(+0.590)#7,747 |
| 77. | 83622 | 3.7% | 3.2%(+0.471)#77 | 3.1%(+0.563)#7,838 |
| 78. | 83713 | 3.5% | 3.2%(+0.350)#78 | 3.1%(+0.443)#8,271 |
| 79. | 83524 | 3.5% | 3.2%(+0.348)#79 | 3.1%(+0.440)#8,283 |
| 80. | 83406 | 3.5% | 3.2%(+0.330)#80 | 3.1%(+0.423)#8,351 |
| 81. | 83611 | 3.5% | 3.2%(+0.321)#81 | 3.1%(+0.413)#8,380 |
| 82. | 83255 | 3.5% | 3.2%(+0.317)#82 | 3.1%(+0.409)#8,400 |
| 83. | 83864 | 3.5% | 3.2%(+0.305)#83 | 3.1%(+0.397)#8,442 |
| 84. | 83239 | 3.5% | 3.2%(+0.286)#84 | 3.1%(+0.379)#8,517 |
| 85. | 83660 | 3.4% | 3.2%(+0.236)#85 | 3.1%(+0.328)#8,699 |
| 86. | 83201 | 3.3% | 3.2%(+0.148)#86 | 3.1%(+0.240)#9,034 |
| 87. | 83835 | 3.3% | 3.2%(+0.136)#87 | 3.1%(+0.228)#9,088 |
| 88. | 83204 | 3.3% | 3.2%(+0.100)#88 | 3.1%(+0.192)#9,221 |
| 89. | 83860 | 3.2% | 3.2%(+0.054)#89 | 3.1%(+0.146)#9,415 |
| 90. | 83845 | 3.2% | 3.2%(+0.034)#90 | 3.1%(+0.126)#9,472 |
| 91. | 83429 | 3.1% | 3.2%(-0.056)#91 | 3.1%(+0.036)#9,829 |
| 92. | 83642 | 3.0% | 3.2%(-0.226)#92 | 3.1%(-0.134)#10,577 |
| 93. | 83467 | 2.9% | 3.2%(-0.248)#93 | 3.1%(-0.156)#10,669 |
| 94. | 83401 | 2.9% | 3.2%(-0.258)#94 | 3.1%(-0.166)#10,731 |
| 95. | 83714 | 2.9% | 3.2%(-0.278)#95 | 3.1%(-0.186)#10,797 |
| 96. | 83434 | 2.9% | 3.2%(-0.304)#96 | 3.1%(-0.212)#10,911 |
| 97. | 83705 | 2.9% | 3.2%(-0.312)#97 | 3.1%(-0.220)#10,944 |
| 98. | 83856 | 2.8% | 3.2%(-0.363)#98 | 3.1%(-0.271)#11,187 |
| 99. | 83536 | 2.8% | 3.2%(-0.375)#99 | 3.1%(-0.283)#11,233 |
| 100. | 83327 | 2.8% | 3.2%(-0.440)#100 | 3.1%(-0.347)#11,547 |
Common Questions
What are the Top 10 Zip Codes with the Highest Percentage of Population with a Degree in Physical and Health Sciences in Idaho?
Top 10 Zip Codes with the Highest Percentage of Population with a Degree in Physical and Health Sciences in Idaho are:
What zip code has the Highest Percentage of Population with a Degree in Physical and Health Sciences in Idaho?
83812 has the Highest Percentage of Population with a Degree in Physical and Health Sciences in Idaho with 100.0%.
What is the Percentage of Population with a Degree in Physical and Health Sciences in the State of Idaho?
Percentage of Population with a Degree in Physical and Health Sciences in Idaho is 3.2%.
What is the Percentage of Population with a Degree in Physical and Health Sciences in the United States?
Percentage of Population with a Degree in Physical and Health Sciences in the United States is 3.1%.