Zip Codes with the Highest Percentage of Population Employed in Education Instruction & Library in Idaho
RELATED REPORTS & OPTIONS
Education Instruction & Library
Idaho
Compare Zip Codes
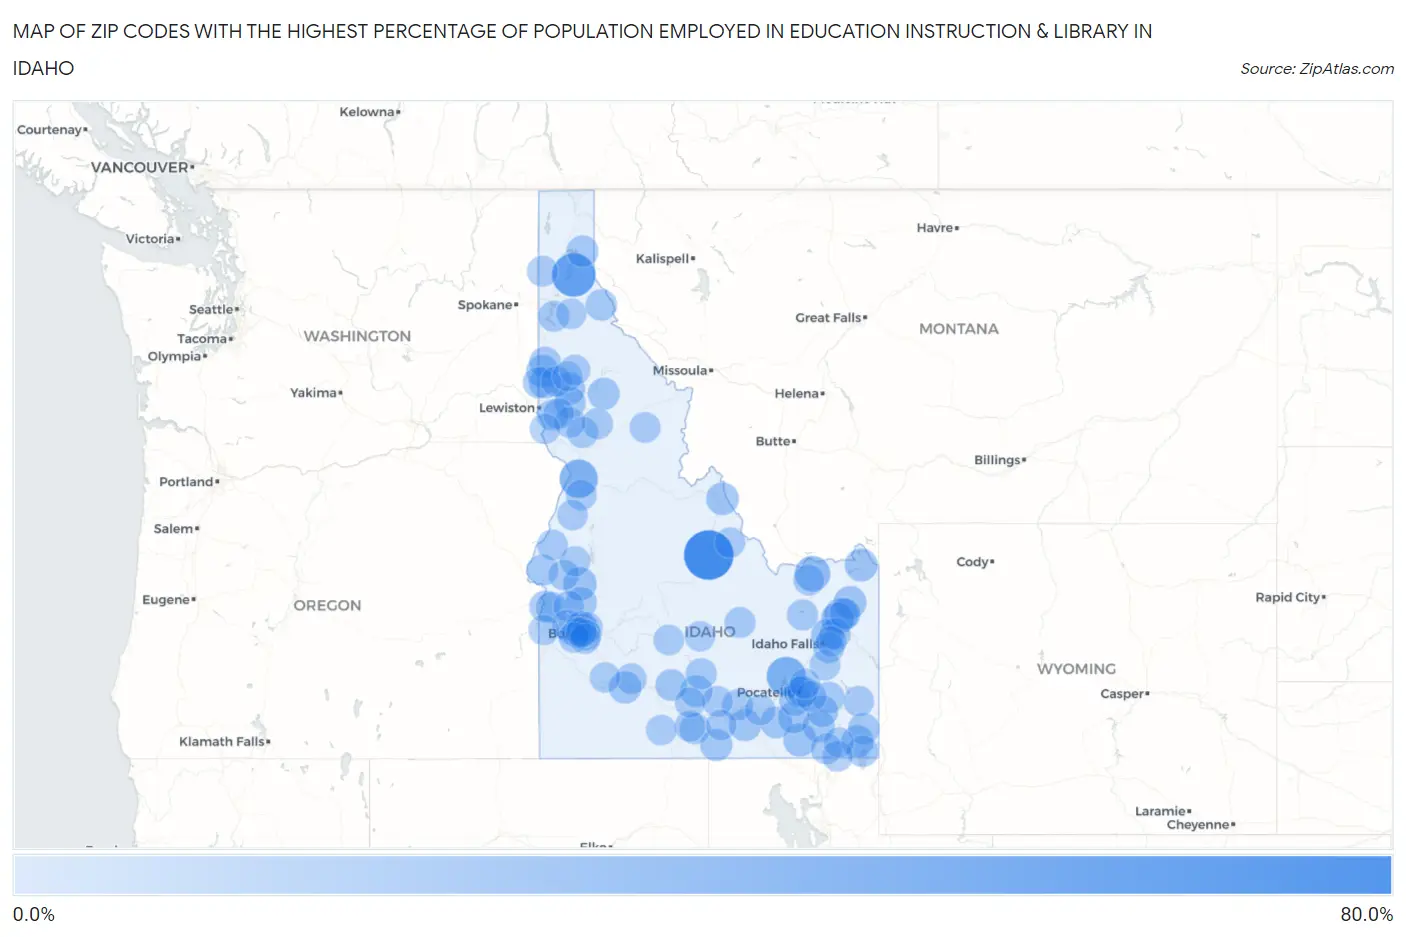
Map of Zip Codes with the Highest Percentage of Population Employed in Education Instruction & Library in Idaho
0.0%
80.0%
Zip Codes with the Highest Percentage of Population Employed in Education Instruction & Library in Idaho
| Zip Code | % Employed | vs State | vs National | |
| 1. | 83235 | 72.6% | 6.1%(+66.5)#1 | 6.2%(+66.4)#27 |
| 2. | 83803 | 51.1% | 6.1%(+45.1)#2 | 6.2%(+44.9)#64 |
| 3. | 83277 | 35.4% | 6.1%(+29.4)#3 | 6.2%(+29.3)#173 |
| 4. | 83542 | 32.5% | 6.1%(+26.4)#4 | 6.2%(+26.3)#218 |
| 5. | 83446 | 23.1% | 6.1%(+17.0)#5 | 6.2%(+16.9)#461 |
| 6. | 83448 | 17.9% | 6.1%(+11.8)#6 | 6.2%(+11.7)#851 |
| 7. | 83657 | 15.9% | 6.1%(+9.81)#7 | 6.2%(+9.69)#1,115 |
| 8. | 83252 | 15.5% | 6.1%(+9.47)#8 | 6.2%(+9.35)#1,181 |
| 9. | 83421 | 14.4% | 6.1%(+8.31)#9 | 6.2%(+8.19)#1,425 |
| 10. | 83429 | 14.3% | 6.1%(+8.23)#10 | 6.2%(+8.10)#1,448 |
| 11. | 83440 | 14.2% | 6.1%(+8.14)#11 | 6.2%(+8.01)#1,483 |
| 12. | 83462 | 13.7% | 6.1%(+7.61)#12 | 6.2%(+7.49)#1,652 |
| 13. | 83454 | 13.5% | 6.1%(+7.47)#13 | 6.2%(+7.35)#1,700 |
| 14. | 83872 | 13.0% | 6.1%(+6.94)#14 | 6.2%(+6.81)#1,902 |
| 15. | 83537 | 12.6% | 6.1%(+6.50)#15 | 6.2%(+6.37)#2,090 |
| 16. | 83323 | 12.5% | 6.1%(+6.45)#16 | 6.2%(+6.33)#2,110 |
| 17. | 83627 | 12.5% | 6.1%(+6.44)#17 | 6.2%(+6.32)#2,115 |
| 18. | 83346 | 11.7% | 6.1%(+5.68)#18 | 6.2%(+5.55)#2,544 |
| 19. | 83261 | 11.5% | 6.1%(+5.45)#19 | 6.2%(+5.32)#2,693 |
| 20. | 83234 | 11.3% | 6.1%(+5.20)#20 | 6.2%(+5.08)#2,882 |
| 21. | 83546 | 11.3% | 6.1%(+5.20)#21 | 6.2%(+5.07)#2,886 |
| 22. | 83324 | 11.1% | 6.1%(+5.01)#22 | 6.2%(+4.89)#3,011 |
| 23. | 83271 | 10.9% | 6.1%(+4.85)#23 | 6.2%(+4.73)#3,126 |
| 24. | 83843 | 10.9% | 6.1%(+4.85)#24 | 6.2%(+4.73)#3,128 |
| 25. | 83212 | 10.8% | 6.1%(+4.76)#25 | 6.2%(+4.64)#3,188 |
| 26. | 83204 | 10.8% | 6.1%(+4.71)#26 | 6.2%(+4.59)#3,227 |
| 27. | 83330 | 10.5% | 6.1%(+4.40)#27 | 6.2%(+4.28)#3,488 |
| 28. | 83836 | 10.4% | 6.1%(+4.32)#28 | 6.2%(+4.20)#3,564 |
| 29. | 83209 | 10.3% | 6.1%(+4.24)#29 | 6.2%(+4.12)#3,645 |
| 30. | 83541 | 10.2% | 6.1%(+4.10)#30 | 6.2%(+3.98)#3,768 |
| 31. | 83254 | 10.1% | 6.1%(+4.04)#31 | 6.2%(+3.92)#3,829 |
| 32. | 83855 | 9.9% | 6.1%(+3.83)#32 | 6.2%(+3.71)#4,065 |
| 33. | 83217 | 9.7% | 6.1%(+3.68)#33 | 6.2%(+3.56)#4,241 |
| 34. | 83844 | 9.6% | 6.1%(+3.58)#34 | 6.2%(+3.46)#4,347 |
| 35. | 83873 | 9.6% | 6.1%(+3.57)#35 | 6.2%(+3.44)#4,364 |
| 36. | 83246 | 9.5% | 6.1%(+3.43)#36 | 6.2%(+3.31)#4,534 |
| 37. | 83646 | 9.4% | 6.1%(+3.33)#37 | 6.2%(+3.21)#4,655 |
| 38. | 83619 | 9.3% | 6.1%(+3.25)#38 | 6.2%(+3.13)#4,777 |
| 39. | 83655 | 9.3% | 6.1%(+3.21)#39 | 6.2%(+3.09)#4,844 |
| 40. | 83442 | 9.3% | 6.1%(+3.19)#40 | 6.2%(+3.07)#4,868 |
| 41. | 83272 | 9.2% | 6.1%(+3.10)#41 | 6.2%(+2.98)#4,984 |
| 42. | 83672 | 8.8% | 6.1%(+2.77)#42 | 6.2%(+2.65)#5,498 |
| 43. | 83533 | 8.8% | 6.1%(+2.73)#43 | 6.2%(+2.61)#5,556 |
| 44. | 83670 | 8.8% | 6.1%(+2.70)#44 | 6.2%(+2.57)#5,613 |
| 45. | 83406 | 8.7% | 6.1%(+2.68)#45 | 6.2%(+2.56)#5,645 |
| 46. | 83349 | 8.7% | 6.1%(+2.64)#46 | 6.2%(+2.51)#5,733 |
| 47. | 83703 | 8.5% | 6.1%(+2.46)#47 | 6.2%(+2.34)#6,052 |
| 48. | 83451 | 8.4% | 6.1%(+2.37)#48 | 6.2%(+2.25)#6,214 |
| 49. | 83450 | 8.4% | 6.1%(+2.31)#49 | 6.2%(+2.18)#6,365 |
| 50. | 83540 | 8.3% | 6.1%(+2.24)#50 | 6.2%(+2.12)#6,518 |
| 51. | 83350 | 8.3% | 6.1%(+2.20)#51 | 6.2%(+2.08)#6,589 |
| 52. | 83833 | 8.1% | 6.1%(+2.07)#52 | 6.2%(+1.95)#6,865 |
| 53. | 83536 | 8.1% | 6.1%(+2.00)#53 | 6.2%(+1.88)#7,005 |
| 54. | 83334 | 8.0% | 6.1%(+1.99)#54 | 6.2%(+1.87)#7,043 |
| 55. | 83255 | 7.9% | 6.1%(+1.83)#55 | 6.2%(+1.71)#7,387 |
| 56. | 83201 | 7.8% | 6.1%(+1.78)#56 | 6.2%(+1.66)#7,536 |
| 57. | 83341 | 7.7% | 6.1%(+1.66)#57 | 6.2%(+1.54)#7,834 |
| 58. | 83423 | 7.7% | 6.1%(+1.63)#58 | 6.2%(+1.51)#7,920 |
| 59. | 83617 | 7.7% | 6.1%(+1.62)#59 | 6.2%(+1.50)#7,958 |
| 60. | 83539 | 7.6% | 6.1%(+1.58)#60 | 6.2%(+1.46)#8,071 |
| 61. | 83610 | 7.6% | 6.1%(+1.57)#61 | 6.2%(+1.45)#8,092 |
| 62. | 83804 | 7.6% | 6.1%(+1.54)#62 | 6.2%(+1.42)#8,179 |
| 63. | 83245 | 7.5% | 6.1%(+1.47)#63 | 6.2%(+1.35)#8,336 |
| 64. | 83523 | 7.5% | 6.1%(+1.41)#64 | 6.2%(+1.29)#8,492 |
| 65. | 83232 | 7.5% | 6.1%(+1.41)#65 | 6.2%(+1.29)#8,504 |
| 66. | 83524 | 7.4% | 6.1%(+1.31)#66 | 6.2%(+1.18)#8,808 |
| 67. | 83669 | 7.3% | 6.1%(+1.25)#67 | 6.2%(+1.12)#8,961 |
| 68. | 83623 | 7.3% | 6.1%(+1.21)#68 | 6.2%(+1.09)#9,077 |
| 69. | 83549 | 7.3% | 6.1%(+1.21)#69 | 6.2%(+1.09)#9,078 |
| 70. | 83211 | 7.1% | 6.1%(+1.02)#70 | 6.2%(+0.899)#9,663 |
| 71. | 83645 | 7.0% | 6.1%(+0.978)#71 | 6.2%(+0.855)#9,775 |
| 72. | 83714 | 7.0% | 6.1%(+0.960)#72 | 6.2%(+0.837)#9,840 |
| 73. | 83237 | 7.0% | 6.1%(+0.926)#73 | 6.2%(+0.803)#9,952 |
| 74. | 83871 | 7.0% | 6.1%(+0.914)#74 | 6.2%(+0.791)#9,998 |
| 75. | 83806 | 6.9% | 6.1%(+0.836)#75 | 6.2%(+0.713)#10,236 |
| 76. | 83347 | 6.8% | 6.1%(+0.731)#76 | 6.2%(+0.608)#10,601 |
| 77. | 83276 | 6.7% | 6.1%(+0.610)#77 | 6.2%(+0.487)#10,998 |
| 78. | 83702 | 6.7% | 6.1%(+0.597)#78 | 6.2%(+0.474)#11,054 |
| 79. | 83706 | 6.6% | 6.1%(+0.589)#79 | 6.2%(+0.466)#11,075 |
| 80. | 83327 | 6.5% | 6.1%(+0.447)#80 | 6.2%(+0.324)#11,595 |
| 81. | 83401 | 6.5% | 6.1%(+0.445)#81 | 6.2%(+0.322)#11,600 |
| 82. | 83465 | 6.5% | 6.1%(+0.391)#82 | 6.2%(+0.268)#11,786 |
| 83. | 83318 | 6.4% | 6.1%(+0.388)#83 | 6.2%(+0.265)#11,792 |
| 84. | 83713 | 6.4% | 6.1%(+0.367)#84 | 6.2%(+0.244)#11,862 |
| 85. | 83654 | 6.4% | 6.1%(+0.353)#85 | 6.2%(+0.230)#11,928 |
| 86. | 83810 | 6.4% | 6.1%(+0.350)#86 | 6.2%(+0.227)#11,935 |
| 87. | 83321 | 6.3% | 6.1%(+0.281)#87 | 6.2%(+0.158)#12,196 |
| 88. | 83236 | 6.3% | 6.1%(+0.240)#88 | 6.2%(+0.117)#12,368 |
| 89. | 83632 | 6.3% | 6.1%(+0.239)#89 | 6.2%(+0.116)#12,371 |
| 90. | 83501 | 6.3% | 6.1%(+0.197)#90 | 6.2%(+0.075)#12,535 |
| 91. | 83648 | 6.2% | 6.1%(+0.174)#91 | 6.2%(+0.052)#12,625 |
| 92. | 83642 | 6.2% | 6.1%(+0.095)#92 | 6.2%(-0.028)#12,930 |
| 93. | 83263 | 6.0% | 6.1%(-0.027)#93 | 6.2%(-0.150)#13,357 |
| 94. | 83333 | 6.0% | 6.1%(-0.071)#94 | 6.2%(-0.194)#13,536 |
| 95. | 83338 | 6.0% | 6.1%(-0.077)#95 | 6.2%(-0.200)#13,568 |
| 96. | 83676 | 5.9% | 6.1%(-0.181)#96 | 6.2%(-0.303)#13,977 |
| 97. | 83705 | 5.8% | 6.1%(-0.211)#97 | 6.2%(-0.334)#14,107 |
| 98. | 83202 | 5.8% | 6.1%(-0.218)#98 | 6.2%(-0.341)#14,133 |
| 99. | 83704 | 5.8% | 6.1%(-0.242)#99 | 6.2%(-0.365)#14,237 |
| 100. | 83823 | 5.7% | 6.1%(-0.320)#100 | 6.2%(-0.443)#14,569 |
Common Questions
What are the Top 10 Zip Codes with the Highest Percentage of Population Employed in Education Instruction & Library in Idaho?
Top 10 Zip Codes with the Highest Percentage of Population Employed in Education Instruction & Library in Idaho are:
What zip code has the Highest Percentage of Population Employed in Education Instruction & Library in Idaho?
83235 has the Highest Percentage of Population Employed in Education Instruction & Library in Idaho with 72.6%.
What is the Percentage of Population Employed in Education Instruction & Library in the State of Idaho?
Percentage of Population Employed in Education Instruction & Library in Idaho is 6.1%.
What is the Percentage of Population Employed in Education Instruction & Library in the United States?
Percentage of Population Employed in Education Instruction & Library in the United States is 6.2%.