Zip Codes with the Highest Percentage of Population Employed in Legal Services & Support in Idaho
RELATED REPORTS & OPTIONS
Legal Services & Support
Idaho
Compare Zip Codes
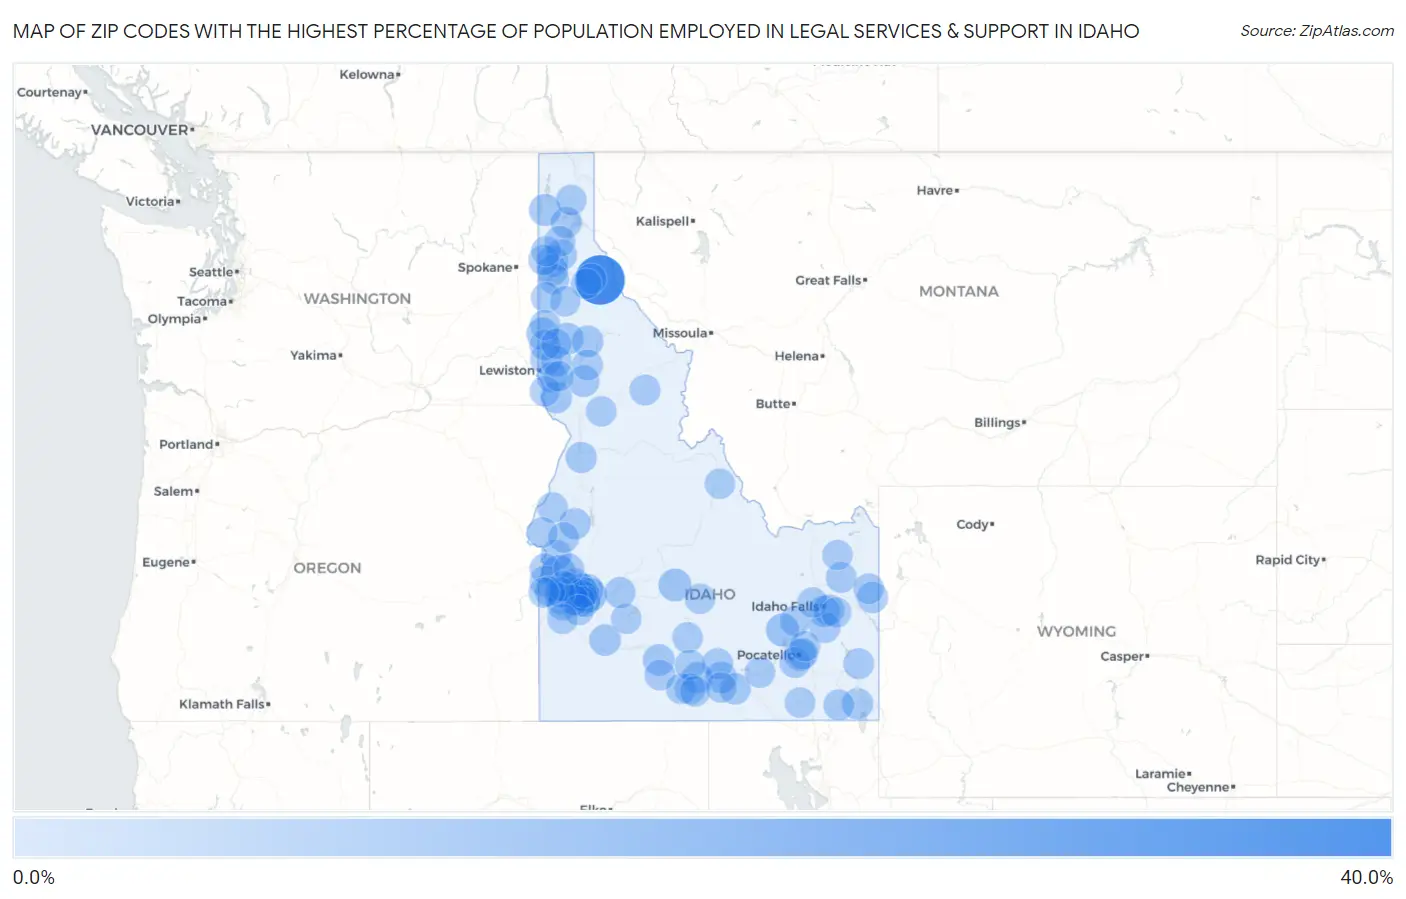
Map of Zip Codes with the Highest Percentage of Population Employed in Legal Services & Support in Idaho
0.0%
40.0%
Zip Codes with the Highest Percentage of Population Employed in Legal Services & Support in Idaho
| Zip Code | % Employed | vs State | vs National | |
| 1. | 83867 | 35.8% | 0.88%(+34.9)#1 | 1.2%(+34.6)#18 |
| 2. | 83636 | 7.2% | 0.88%(+6.30)#2 | 1.2%(+5.99)#325 |
| 3. | 83712 | 5.6% | 0.88%(+4.71)#3 | 1.2%(+4.40)#584 |
| 4. | 83262 | 5.0% | 0.88%(+4.08)#4 | 1.2%(+3.77)#732 |
| 5. | 83340 | 4.4% | 0.88%(+3.52)#5 | 1.2%(+3.21)#940 |
| 6. | 83872 | 3.4% | 0.88%(+2.57)#6 | 1.2%(+2.26)#1,472 |
| 7. | 83702 | 3.2% | 0.88%(+2.28)#7 | 1.2%(+1.97)#1,690 |
| 8. | 83856 | 2.9% | 0.88%(+2.05)#8 | 1.2%(+1.75)#1,930 |
| 9. | 83823 | 2.7% | 0.88%(+1.84)#9 | 1.2%(+1.54)#2,182 |
| 10. | 83827 | 2.7% | 0.88%(+1.79)#10 | 1.2%(+1.48)#2,252 |
| 11. | 83332 | 2.6% | 0.88%(+1.73)#11 | 1.2%(+1.43)#2,340 |
| 12. | 83832 | 2.5% | 0.88%(+1.62)#12 | 1.2%(+1.32)#2,506 |
| 13. | 83209 | 2.4% | 0.88%(+1.55)#13 | 1.2%(+1.25)#2,621 |
| 14. | 83648 | 2.4% | 0.88%(+1.52)#14 | 1.2%(+1.21)#2,687 |
| 15. | 83555 | 2.2% | 0.88%(+1.31)#15 | 1.2%(+1.01)#3,055 |
| 16. | 83336 | 2.2% | 0.88%(+1.30)#16 | 1.2%(+0.992)#3,081 |
| 17. | 83311 | 2.2% | 0.88%(+1.29)#17 | 1.2%(+0.982)#3,102 |
| 18. | 83543 | 2.1% | 0.88%(+1.24)#18 | 1.2%(+0.935)#3,197 |
| 19. | 83713 | 2.0% | 0.88%(+1.16)#19 | 1.2%(+0.854)#3,369 |
| 20. | 83261 | 2.0% | 0.88%(+1.11)#20 | 1.2%(+0.800)#3,529 |
| 21. | 83632 | 2.0% | 0.88%(+1.09)#21 | 1.2%(+0.785)#3,559 |
| 22. | 83455 | 1.9% | 0.88%(+1.06)#22 | 1.2%(+0.752)#3,639 |
| 23. | 83815 | 1.9% | 0.88%(+1.03)#23 | 1.2%(+0.730)#3,693 |
| 24. | 83651 | 1.8% | 0.88%(+0.890)#24 | 1.2%(+0.585)#4,087 |
| 25. | 83860 | 1.7% | 0.88%(+0.817)#25 | 1.2%(+0.513)#4,325 |
| 26. | 83404 | 1.7% | 0.88%(+0.813)#26 | 1.2%(+0.508)#4,343 |
| 27. | 83835 | 1.6% | 0.88%(+0.738)#27 | 1.2%(+0.433)#4,619 |
| 28. | 83347 | 1.6% | 0.88%(+0.711)#28 | 1.2%(+0.406)#4,707 |
| 29. | 83616 | 1.6% | 0.88%(+0.701)#29 | 1.2%(+0.396)#4,747 |
| 30. | 83714 | 1.6% | 0.88%(+0.678)#30 | 1.2%(+0.373)#4,820 |
| 31. | 83325 | 1.5% | 0.88%(+0.669)#31 | 1.2%(+0.364)#4,852 |
| 32. | 83669 | 1.4% | 0.88%(+0.547)#32 | 1.2%(+0.242)#5,343 |
| 33. | 83716 | 1.4% | 0.88%(+0.521)#33 | 1.2%(+0.216)#5,479 |
| 34. | 83814 | 1.4% | 0.88%(+0.490)#34 | 1.2%(+0.185)#5,615 |
| 35. | 83406 | 1.4% | 0.88%(+0.485)#35 | 1.2%(+0.180)#5,635 |
| 36. | 83549 | 1.4% | 0.88%(+0.485)#36 | 1.2%(+0.180)#5,639 |
| 37. | 83540 | 1.3% | 0.88%(+0.426)#37 | 1.2%(+0.121)#5,915 |
| 38. | 83535 | 1.3% | 0.88%(+0.411)#38 | 1.2%(+0.107)#5,978 |
| 39. | 83843 | 1.2% | 0.88%(+0.370)#39 | 1.2%(+0.065)#6,216 |
| 40. | 83201 | 1.2% | 0.88%(+0.309)#40 | 1.2%(+0.004)#6,584 |
| 41. | 83544 | 1.2% | 0.88%(+0.287)#41 | 1.2%(-0.018)#6,733 |
| 42. | 83706 | 1.1% | 0.88%(+0.269)#42 | 1.2%(-0.036)#6,835 |
| 43. | 83263 | 1.1% | 0.88%(+0.227)#43 | 1.2%(-0.078)#7,128 |
| 44. | 83801 | 1.1% | 0.88%(+0.206)#44 | 1.2%(-0.099)#7,271 |
| 45. | 83704 | 1.1% | 0.88%(+0.182)#45 | 1.2%(-0.123)#7,428 |
| 46. | 83833 | 1.1% | 0.88%(+0.175)#46 | 1.2%(-0.130)#7,462 |
| 47. | 83539 | 1.1% | 0.88%(+0.175)#47 | 1.2%(-0.130)#7,463 |
| 48. | 83661 | 1.0% | 0.88%(+0.155)#48 | 1.2%(-0.150)#7,592 |
| 49. | 83660 | 1.0% | 0.88%(+0.152)#49 | 1.2%(-0.153)#7,611 |
| 50. | 83236 | 1.0% | 0.88%(+0.152)#50 | 1.2%(-0.153)#7,612 |
| 51. | 83705 | 1.0% | 0.88%(+0.148)#51 | 1.2%(-0.157)#7,639 |
| 52. | 83204 | 1.0% | 0.88%(+0.126)#52 | 1.2%(-0.179)#7,792 |
| 53. | 83341 | 0.95% | 0.88%(+0.074)#53 | 1.2%(-0.231)#8,186 |
| 54. | 83276 | 0.95% | 0.88%(+0.074)#54 | 1.2%(-0.231)#8,188 |
| 55. | 83619 | 0.93% | 0.88%(+0.055)#55 | 1.2%(-0.250)#8,326 |
| 56. | 83864 | 0.90% | 0.88%(+0.019)#56 | 1.2%(-0.286)#8,618 |
| 57. | 83316 | 0.87% | 0.88%(-0.006)#57 | 1.2%(-0.311)#8,835 |
| 58. | 83686 | 0.87% | 0.88%(-0.012)#58 | 1.2%(-0.317)#8,885 |
| 59. | 83448 | 0.84% | 0.88%(-0.035)#59 | 1.2%(-0.340)#9,066 |
| 60. | 83709 | 0.83% | 0.88%(-0.050)#60 | 1.2%(-0.355)#9,198 |
| 61. | 83646 | 0.82% | 0.88%(-0.064)#61 | 1.2%(-0.369)#9,313 |
| 62. | 83642 | 0.79% | 0.88%(-0.085)#62 | 1.2%(-0.390)#9,506 |
| 63. | 83422 | 0.76% | 0.88%(-0.115)#63 | 1.2%(-0.420)#9,785 |
| 64. | 83645 | 0.73% | 0.88%(-0.151)#64 | 1.2%(-0.456)#10,120 |
| 65. | 83644 | 0.72% | 0.88%(-0.158)#65 | 1.2%(-0.463)#10,192 |
| 66. | 83318 | 0.70% | 0.88%(-0.180)#66 | 1.2%(-0.485)#10,417 |
| 67. | 83703 | 0.70% | 0.88%(-0.182)#67 | 1.2%(-0.487)#10,447 |
| 68. | 83301 | 0.69% | 0.88%(-0.187)#68 | 1.2%(-0.492)#10,491 |
| 69. | 83352 | 0.68% | 0.88%(-0.202)#69 | 1.2%(-0.507)#10,644 |
| 70. | 83530 | 0.66% | 0.88%(-0.215)#70 | 1.2%(-0.520)#10,797 |
| 71. | 83837 | 0.62% | 0.88%(-0.256)#71 | 1.2%(-0.561)#11,208 |
| 72. | 83501 | 0.62% | 0.88%(-0.257)#72 | 1.2%(-0.562)#11,222 |
| 73. | 83211 | 0.61% | 0.88%(-0.269)#73 | 1.2%(-0.574)#11,355 |
| 74. | 83221 | 0.59% | 0.88%(-0.286)#74 | 1.2%(-0.591)#11,536 |
| 75. | 83605 | 0.58% | 0.88%(-0.301)#75 | 1.2%(-0.606)#11,708 |
| 76. | 83851 | 0.57% | 0.88%(-0.306)#76 | 1.2%(-0.610)#11,775 |
| 77. | 83854 | 0.57% | 0.88%(-0.312)#77 | 1.2%(-0.617)#11,862 |
| 78. | 83252 | 0.56% | 0.88%(-0.318)#78 | 1.2%(-0.623)#11,923 |
| 79. | 83467 | 0.52% | 0.88%(-0.362)#79 | 1.2%(-0.667)#12,411 |
| 80. | 83610 | 0.51% | 0.88%(-0.370)#80 | 1.2%(-0.675)#12,515 |
| 81. | 83338 | 0.50% | 0.88%(-0.383)#81 | 1.2%(-0.688)#12,684 |
| 82. | 83626 | 0.49% | 0.88%(-0.385)#82 | 1.2%(-0.690)#12,702 |
| 83. | 83850 | 0.49% | 0.88%(-0.393)#83 | 1.2%(-0.697)#12,802 |
| 84. | 83617 | 0.49% | 0.88%(-0.394)#84 | 1.2%(-0.699)#12,819 |
| 85. | 83402 | 0.48% | 0.88%(-0.397)#85 | 1.2%(-0.702)#12,860 |
| 86. | 83334 | 0.47% | 0.88%(-0.405)#86 | 1.2%(-0.710)#12,968 |
| 87. | 83672 | 0.47% | 0.88%(-0.409)#87 | 1.2%(-0.714)#13,010 |
| 88. | 83634 | 0.46% | 0.88%(-0.416)#88 | 1.2%(-0.721)#13,099 |
| 89. | 83855 | 0.44% | 0.88%(-0.439)#89 | 1.2%(-0.744)#13,362 |
| 90. | 83202 | 0.42% | 0.88%(-0.455)#90 | 1.2%(-0.760)#13,564 |
| 91. | 83647 | 0.36% | 0.88%(-0.516)#91 | 1.2%(-0.821)#14,300 |
| 92. | 83861 | 0.36% | 0.88%(-0.521)#92 | 1.2%(-0.826)#14,354 |
| 93. | 83641 | 0.36% | 0.88%(-0.522)#93 | 1.2%(-0.826)#14,369 |
| 94. | 83676 | 0.35% | 0.88%(-0.526)#94 | 1.2%(-0.831)#14,419 |
| 95. | 83871 | 0.29% | 0.88%(-0.584)#95 | 1.2%(-0.889)#15,100 |
| 96. | 83333 | 0.28% | 0.88%(-0.596)#96 | 1.2%(-0.901)#15,219 |
| 97. | 83427 | 0.28% | 0.88%(-0.597)#97 | 1.2%(-0.902)#15,236 |
| 98. | 83445 | 0.27% | 0.88%(-0.606)#98 | 1.2%(-0.911)#15,357 |
| 99. | 83524 | 0.26% | 0.88%(-0.616)#99 | 1.2%(-0.921)#15,477 |
| 100. | 83858 | 0.22% | 0.88%(-0.661)#100 | 1.2%(-0.966)#16,001 |
Common Questions
What are the Top 10 Zip Codes with the Highest Percentage of Population Employed in Legal Services & Support in Idaho?
Top 10 Zip Codes with the Highest Percentage of Population Employed in Legal Services & Support in Idaho are:
What zip code has the Highest Percentage of Population Employed in Legal Services & Support in Idaho?
83867 has the Highest Percentage of Population Employed in Legal Services & Support in Idaho with 35.8%.
What is the Percentage of Population Employed in Legal Services & Support in the State of Idaho?
Percentage of Population Employed in Legal Services & Support in Idaho is 0.88%.
What is the Percentage of Population Employed in Legal Services & Support in the United States?
Percentage of Population Employed in Legal Services & Support in the United States is 1.2%.