Zip Codes with the Highest Percentage of Population Enrolled in Nursery / Preschool in Idaho
RELATED REPORTS & OPTIONS
Nursery / Preschool
Idaho
Compare Zip Codes
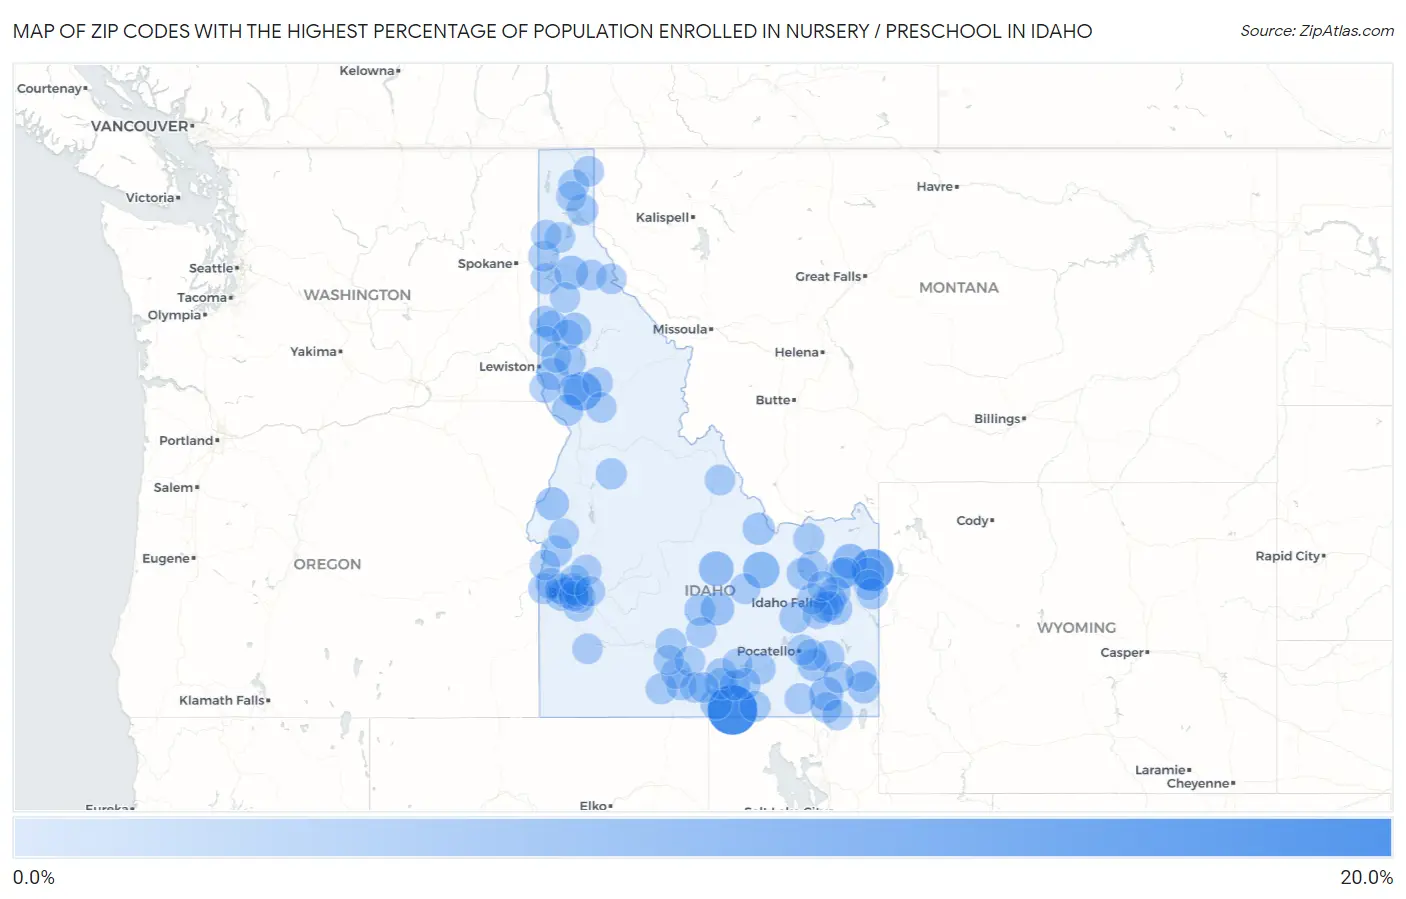
Map of Zip Codes with the Highest Percentage of Population Enrolled in Nursery / Preschool in Idaho
0.0%
20.0%
Zip Codes with the Highest Percentage of Population Enrolled in Nursery / Preschool in Idaho
| Zip Code | % in Nursery | vs State | vs National | |
| 1. | 83312 | 16.1% | 1.3%(+14.8)#1 | 1.4%(+14.7)#37 |
| 2. | 83424 | 10.3% | 1.3%(+9.03)#2 | 1.4%(+8.90)#122 |
| 3. | 83533 | 7.3% | 1.3%(+6.00)#3 | 1.4%(+5.87)#272 |
| 4. | 83244 | 5.8% | 1.3%(+4.47)#4 | 1.4%(+4.34)#472 |
| 5. | 83251 | 4.6% | 1.3%(+3.25)#5 | 1.4%(+3.12)#794 |
| 6. | 83421 | 4.5% | 1.3%(+3.21)#6 | 1.4%(+3.08)#805 |
| 7. | 83281 | 3.8% | 1.3%(+2.53)#7 | 1.4%(+2.40)#1,192 |
| 8. | 83810 | 3.8% | 1.3%(+2.44)#8 | 1.4%(+2.31)#1,264 |
| 9. | 83320 | 3.6% | 1.3%(+2.32)#9 | 1.4%(+2.19)#1,373 |
| 10. | 83610 | 3.3% | 1.3%(+1.99)#10 | 1.4%(+1.86)#1,729 |
| 11. | 83452 | 2.7% | 1.3%(+1.42)#11 | 1.4%(+1.29)#2,784 |
| 12. | 83250 | 2.7% | 1.3%(+1.38)#12 | 1.4%(+1.25)#2,898 |
| 13. | 83806 | 2.7% | 1.3%(+1.36)#13 | 1.4%(+1.23)#2,948 |
| 14. | 83427 | 2.7% | 1.3%(+1.35)#14 | 1.4%(+1.22)#2,978 |
| 15. | 83464 | 2.7% | 1.3%(+1.35)#15 | 1.4%(+1.22)#2,982 |
| 16. | 83540 | 2.6% | 1.3%(+1.24)#16 | 1.4%(+1.11)#3,334 |
| 17. | 83541 | 2.5% | 1.3%(+1.15)#17 | 1.4%(+1.02)#3,629 |
| 18. | 83346 | 2.4% | 1.3%(+1.11)#18 | 1.4%(+0.980)#3,790 |
| 19. | 83254 | 2.4% | 1.3%(+1.08)#19 | 1.4%(+0.954)#3,900 |
| 20. | 83450 | 2.3% | 1.3%(+1.02)#20 | 1.4%(+0.889)#4,188 |
| 21. | 83526 | 2.2% | 1.3%(+0.904)#21 | 1.4%(+0.774)#4,711 |
| 22. | 83522 | 2.2% | 1.3%(+0.861)#22 | 1.4%(+0.731)#4,947 |
| 23. | 83836 | 2.2% | 1.3%(+0.859)#23 | 1.4%(+0.729)#4,956 |
| 24. | 83448 | 2.2% | 1.3%(+0.840)#24 | 1.4%(+0.709)#5,068 |
| 25. | 83318 | 2.1% | 1.3%(+0.817)#25 | 1.4%(+0.687)#5,182 |
| 26. | 83221 | 2.1% | 1.3%(+0.812)#26 | 1.4%(+0.682)#5,214 |
| 27. | 83217 | 2.1% | 1.3%(+0.782)#27 | 1.4%(+0.652)#5,417 |
| 28. | 83651 | 2.1% | 1.3%(+0.741)#28 | 1.4%(+0.611)#5,705 |
| 29. | 83313 | 2.1% | 1.3%(+0.733)#29 | 1.4%(+0.602)#5,759 |
| 30. | 83451 | 2.0% | 1.3%(+0.731)#30 | 1.4%(+0.601)#5,769 |
| 31. | 83211 | 2.0% | 1.3%(+0.718)#31 | 1.4%(+0.588)#5,848 |
| 32. | 83661 | 2.0% | 1.3%(+0.714)#32 | 1.4%(+0.584)#5,874 |
| 33. | 83323 | 2.0% | 1.3%(+0.694)#33 | 1.4%(+0.564)#6,013 |
| 34. | 83239 | 2.0% | 1.3%(+0.678)#34 | 1.4%(+0.547)#6,162 |
| 35. | 83245 | 2.0% | 1.3%(+0.640)#35 | 1.4%(+0.510)#6,441 |
| 36. | 83442 | 2.0% | 1.3%(+0.639)#36 | 1.4%(+0.509)#6,444 |
| 37. | 83857 | 1.9% | 1.3%(+0.625)#37 | 1.4%(+0.495)#6,542 |
| 38. | 83321 | 1.9% | 1.3%(+0.581)#38 | 1.4%(+0.451)#6,850 |
| 39. | 83404 | 1.8% | 1.3%(+0.516)#39 | 1.4%(+0.385)#7,419 |
| 40. | 83336 | 1.8% | 1.3%(+0.512)#40 | 1.4%(+0.382)#7,460 |
| 41. | 83656 | 1.8% | 1.3%(+0.503)#41 | 1.4%(+0.373)#7,529 |
| 42. | 83423 | 1.8% | 1.3%(+0.503)#42 | 1.4%(+0.373)#7,538 |
| 43. | 83855 | 1.8% | 1.3%(+0.472)#43 | 1.4%(+0.342)#7,823 |
| 44. | 83646 | 1.8% | 1.3%(+0.468)#44 | 1.4%(+0.337)#7,877 |
| 45. | 83455 | 1.8% | 1.3%(+0.450)#45 | 1.4%(+0.320)#8,046 |
| 46. | 83342 | 1.8% | 1.3%(+0.446)#46 | 1.4%(+0.316)#8,092 |
| 47. | 83847 | 1.8% | 1.3%(+0.439)#47 | 1.4%(+0.309)#8,147 |
| 48. | 83232 | 1.7% | 1.3%(+0.421)#48 | 1.4%(+0.291)#8,325 |
| 49. | 83823 | 1.7% | 1.3%(+0.412)#49 | 1.4%(+0.282)#8,413 |
| 50. | 83638 | 1.7% | 1.3%(+0.411)#50 | 1.4%(+0.281)#8,424 |
| 51. | 83876 | 1.7% | 1.3%(+0.391)#51 | 1.4%(+0.260)#8,607 |
| 52. | 83854 | 1.7% | 1.3%(+0.376)#52 | 1.4%(+0.246)#8,762 |
| 53. | 83330 | 1.7% | 1.3%(+0.375)#53 | 1.4%(+0.245)#8,771 |
| 54. | 83425 | 1.7% | 1.3%(+0.354)#54 | 1.4%(+0.223)#9,038 |
| 55. | 83241 | 1.7% | 1.3%(+0.333)#55 | 1.4%(+0.203)#9,284 |
| 56. | 83201 | 1.6% | 1.3%(+0.331)#56 | 1.4%(+0.201)#9,311 |
| 57. | 83252 | 1.6% | 1.3%(+0.316)#57 | 1.4%(+0.186)#9,461 |
| 58. | 83687 | 1.6% | 1.3%(+0.315)#58 | 1.4%(+0.185)#9,477 |
| 59. | 83676 | 1.6% | 1.3%(+0.305)#59 | 1.4%(+0.175)#9,577 |
| 60. | 83401 | 1.6% | 1.3%(+0.296)#60 | 1.4%(+0.166)#9,677 |
| 61. | 83837 | 1.6% | 1.3%(+0.284)#61 | 1.4%(+0.153)#9,824 |
| 62. | 83301 | 1.6% | 1.3%(+0.267)#62 | 1.4%(+0.136)#10,007 |
| 63. | 83634 | 1.6% | 1.3%(+0.257)#63 | 1.4%(+0.126)#10,113 |
| 64. | 83311 | 1.6% | 1.3%(+0.245)#64 | 1.4%(+0.115)#10,240 |
| 65. | 83501 | 1.6% | 1.3%(+0.244)#65 | 1.4%(+0.114)#10,257 |
| 66. | 83213 | 1.6% | 1.3%(+0.241)#66 | 1.4%(+0.111)#10,294 |
| 67. | 83406 | 1.5% | 1.3%(+0.208)#67 | 1.4%(+0.078)#10,678 |
| 68. | 83467 | 1.5% | 1.3%(+0.199)#68 | 1.4%(+0.069)#10,786 |
| 69. | 83845 | 1.5% | 1.3%(+0.195)#69 | 1.4%(+0.065)#10,832 |
| 70. | 83402 | 1.5% | 1.3%(+0.192)#70 | 1.4%(+0.062)#10,863 |
| 71. | 83237 | 1.5% | 1.3%(+0.190)#71 | 1.4%(+0.060)#10,887 |
| 72. | 83605 | 1.5% | 1.3%(+0.137)#72 | 1.4%(+0.007)#11,546 |
| 73. | 83328 | 1.4% | 1.3%(+0.132)#73 | 1.4%(+0.002)#11,605 |
| 74. | 83846 | 1.4% | 1.3%(+0.127)#74 | 1.4%(-0.003)#11,669 |
| 75. | 83709 | 1.4% | 1.3%(+0.113)#75 | 1.4%(-0.017)#11,850 |
| 76. | 83713 | 1.4% | 1.3%(+0.111)#76 | 1.4%(-0.020)#11,873 |
| 77. | 83349 | 1.4% | 1.3%(+0.104)#77 | 1.4%(-0.026)#11,966 |
| 78. | 83536 | 1.4% | 1.3%(+0.102)#78 | 1.4%(-0.028)#11,995 |
| 79. | 83645 | 1.4% | 1.3%(+0.087)#79 | 1.4%(-0.043)#12,184 |
| 80. | 83530 | 1.4% | 1.3%(+0.063)#80 | 1.4%(-0.067)#12,491 |
| 81. | 83843 | 1.4% | 1.3%(+0.036)#81 | 1.4%(-0.094)#12,822 |
| 82. | 83864 | 1.4% | 1.3%(+0.036)#82 | 1.4%(-0.094)#12,826 |
| 83. | 83338 | 1.3% | 1.3%(+0.030)#83 | 1.4%(-0.100)#12,909 |
| 84. | 83801 | 1.3% | 1.3%(+0.030)#84 | 1.4%(-0.100)#12,910 |
| 85. | 83629 | 1.3% | 1.3%(+0.022)#85 | 1.4%(-0.109)#13,016 |
| 86. | 83624 | 1.3% | 1.3%(+0.021)#86 | 1.4%(-0.109)#13,021 |
| 87. | 83642 | 1.3% | 1.3%(+0.015)#87 | 1.4%(-0.115)#13,096 |
| 88. | 83869 | 1.3% | 1.3%(+0.011)#88 | 1.4%(-0.119)#13,155 |
| 89. | 83334 | 1.3% | 1.3%(+0.005)#89 | 1.4%(-0.125)#13,221 |
| 90. | 83619 | 1.3% | 1.3%(+0.004)#90 | 1.4%(-0.126)#13,232 |
| 91. | 83535 | 1.3% | 1.3%(-0.002)#91 | 1.4%(-0.132)#13,306 |
| 92. | 83344 | 1.3% | 1.3%(-0.004)#92 | 1.4%(-0.134)#13,341 |
| 93. | 83422 | 1.3% | 1.3%(-0.024)#93 | 1.4%(-0.154)#13,627 |
| 94. | 83274 | 1.3% | 1.3%(-0.030)#94 | 1.4%(-0.160)#13,706 |
| 95. | 83431 | 1.3% | 1.3%(-0.031)#95 | 1.4%(-0.161)#13,719 |
| 96. | 83861 | 1.3% | 1.3%(-0.033)#96 | 1.4%(-0.163)#13,752 |
| 97. | 83350 | 1.3% | 1.3%(-0.034)#97 | 1.4%(-0.165)#13,762 |
| 98. | 83355 | 1.3% | 1.3%(-0.035)#98 | 1.4%(-0.166)#13,778 |
| 99. | 83616 | 1.3% | 1.3%(-0.057)#99 | 1.4%(-0.187)#14,065 |
| 100. | 83712 | 1.2% | 1.3%(-0.087)#100 | 1.4%(-0.217)#14,476 |
Common Questions
What are the Top 10 Zip Codes with the Highest Percentage of Population Enrolled in Nursery / Preschool in Idaho?
Top 10 Zip Codes with the Highest Percentage of Population Enrolled in Nursery / Preschool in Idaho are:
What zip code has the Highest Percentage of Population Enrolled in Nursery / Preschool in Idaho?
83312 has the Highest Percentage of Population Enrolled in Nursery / Preschool in Idaho with 16.1%.
What is the Percentage of Population Enrolled in Nursery / Preschool in the State of Idaho?
Percentage of Population Enrolled in Nursery / Preschool in Idaho is 1.3%.
What is the Percentage of Population Enrolled in Nursery / Preschool in the United States?
Percentage of Population Enrolled in Nursery / Preschool in the United States is 1.4%.