Zip Codes with the Lowest Median Property Prices in Idaho
RELATED REPORTS & OPTIONS
Lowest Property Prices
Idaho
Compare Zip Codes
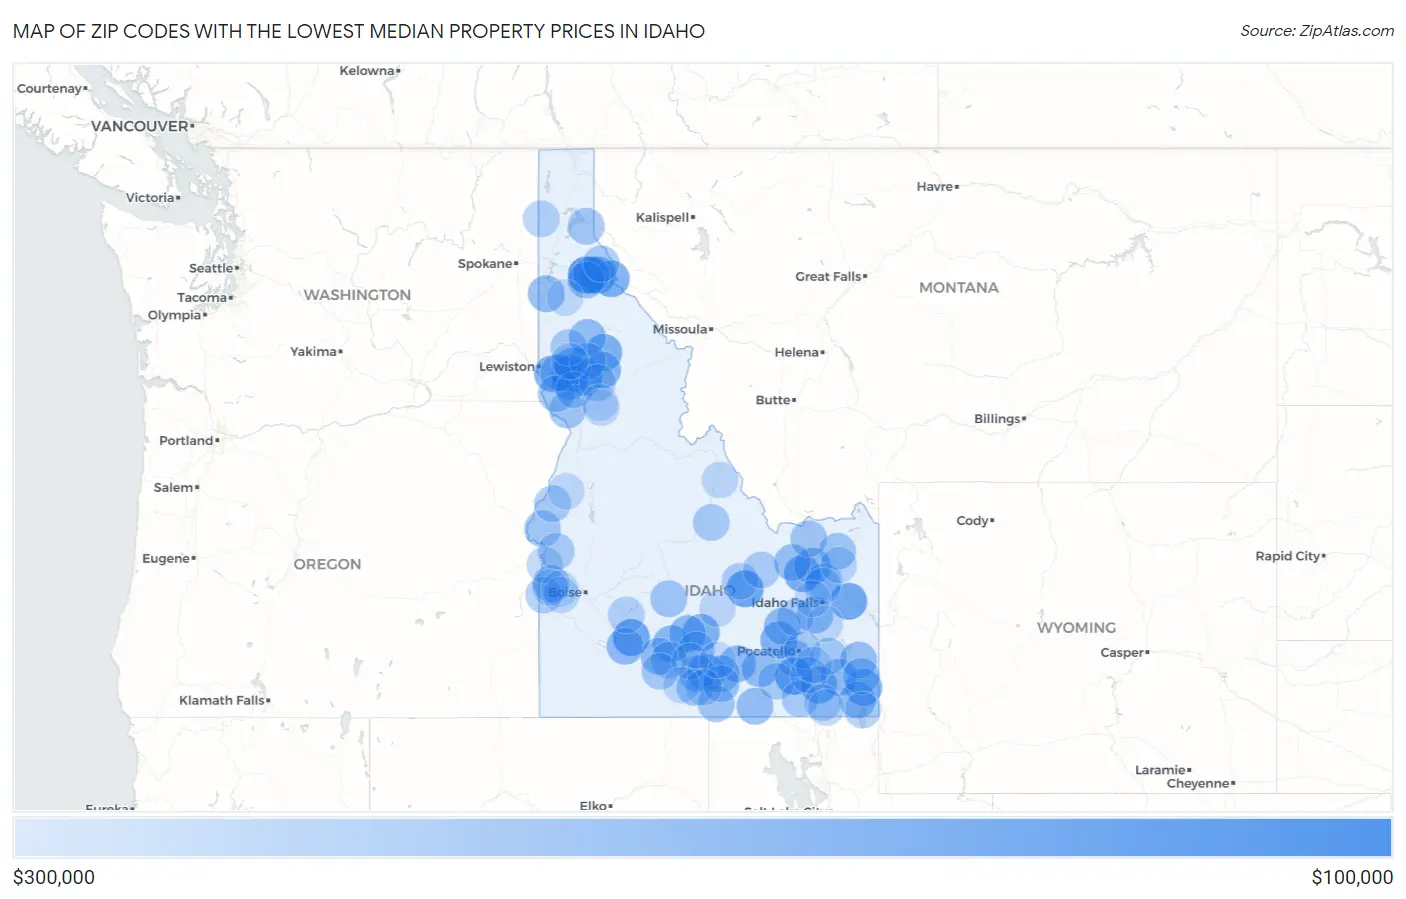
Map of Zip Codes with the Lowest Median Property Prices in Idaho
$300,000
$100,000
Zip Codes with the Lowest Median Property Prices in Idaho
| Zip Code | Avg Property Price | vs State | vs National | |
| 1. | 83868 | $103,444 | $329,430(-226k)#1 | $281,181(-178k)#3,275 |
| 2. | 83212 | $130,310 | $329,430(-199k)#2 | $281,181(-151k)#6,478 |
| 3. | 83213 | $136,656 | $329,430(-193k)#3 | $281,181(-145k)#7,229 |
| 4. | 83623 | $142,585 | $329,430(-187k)#4 | $281,181(-139k)#7,932 |
| 5. | 83443 | $145,749 | $329,430(-184k)#5 | $281,181(-135k)#8,274 |
| 6. | 83548 | $148,611 | $329,430(-181k)#6 | $281,181(-133k)#8,599 |
| 7. | 83849 | $150,288 | $329,430(-179k)#7 | $281,181(-131k)#8,783 |
| 8. | 83543 | $153,492 | $329,430(-176k)#8 | $281,181(-128k)#9,164 |
| 9. | 83450 | $154,021 | $329,430(-175k)#9 | $281,181(-127k)#9,227 |
| 10. | 83546 | $155,747 | $329,430(-174k)#10 | $281,181(-125k)#9,430 |
| 11. | 83846 | $157,935 | $329,430(-171k)#11 | $281,181(-123k)#9,684 |
| 12. | 83540 | $158,670 | $329,430(-171k)#12 | $281,181(-123k)#9,775 |
| 13. | 83210 | $164,046 | $329,430(-165k)#13 | $281,181(-117k)#10,340 |
| 14. | 83234 | $164,518 | $329,430(-165k)#14 | $281,181(-117k)#10,393 |
| 15. | 83349 | $165,171 | $329,430(-164k)#15 | $281,181(-116k)#10,469 |
| 16. | 83254 | $165,477 | $329,430(-164k)#16 | $281,181(-116k)#10,492 |
| 17. | 83837 | $165,607 | $329,430(-164k)#17 | $281,181(-116k)#10,503 |
| 18. | 83335 | $166,250 | $329,430(-163k)#18 | $281,181(-115k)#10,576 |
| 19. | 83425 | $176,460 | $329,430(-153k)#19 | $281,181(-105k)#11,599 |
| 20. | 83553 | $177,592 | $329,430(-152k)#20 | $281,181(-104k)#11,703 |
| 21. | 83330 | $180,212 | $329,430(-149k)#21 | $281,181(-101k)#11,979 |
| 22. | 83352 | $181,523 | $329,430(-148k)#22 | $281,181(-99.7k)#12,088 |
| 23. | 83523 | $181,625 | $329,430(-148k)#23 | $281,181(-99.6k)#12,098 |
| 24. | 83545 | $182,263 | $329,430(-147k)#24 | $281,181(-98.9k)#12,168 |
| 25. | 83262 | $184,845 | $329,430(-145k)#25 | $281,181(-96.3k)#12,441 |
| 26. | 83350 | $187,252 | $329,430(-142k)#26 | $281,181(-93.9k)#12,650 |
| 27. | 83627 | $189,115 | $329,430(-140k)#27 | $281,181(-92.1k)#12,813 |
| 28. | 83241 | $189,248 | $329,430(-140k)#28 | $281,181(-91.9k)#12,824 |
| 29. | 83336 | $190,693 | $329,430(-139k)#29 | $281,181(-90.5k)#12,958 |
| 30. | 83827 | $191,403 | $329,430(-138k)#30 | $281,181(-89.8k)#13,029 |
| 31. | 83851 | $192,155 | $329,430(-137k)#31 | $281,181(-89.0k)#13,106 |
| 32. | 83332 | $192,797 | $329,430(-137k)#32 | $281,181(-88.4k)#13,160 |
| 33. | 83211 | $192,920 | $329,430(-137k)#33 | $281,181(-88.3k)#13,168 |
| 34. | 83261 | $194,118 | $329,430(-135k)#34 | $281,181(-87.1k)#13,267 |
| 35. | 83342 | $194,830 | $329,430(-135k)#35 | $281,181(-86.4k)#13,318 |
| 36. | 83656 | $195,800 | $329,430(-134k)#36 | $281,181(-85.4k)#13,410 |
| 37. | 83218 | $197,282 | $329,430(-132k)#37 | $281,181(-83.9k)#13,538 |
| 38. | 83276 | $197,692 | $329,430(-132k)#38 | $281,181(-83.5k)#13,569 |
| 39. | 83435 | $198,126 | $329,430(-131k)#39 | $281,181(-83.1k)#13,604 |
| 40. | 83239 | $198,762 | $329,430(-131k)#40 | $281,181(-82.4k)#13,659 |
| 41. | 83850 | $201,921 | $329,430(-128k)#41 | $281,181(-79.3k)#13,947 |
| 42. | 83325 | $203,741 | $329,430(-126k)#42 | $281,181(-77.4k)#14,107 |
| 43. | 83524 | $204,981 | $329,430(-124k)#43 | $281,181(-76.2k)#14,199 |
| 44. | 83204 | $205,354 | $329,430(-124k)#44 | $281,181(-75.8k)#14,226 |
| 45. | 83324 | $205,757 | $329,430(-124k)#45 | $281,181(-75.4k)#14,254 |
| 46. | 83334 | $206,860 | $329,430(-123k)#46 | $281,181(-74.3k)#14,337 |
| 47. | 83445 | $207,054 | $329,430(-122k)#47 | $281,181(-74.1k)#14,357 |
| 48. | 83327 | $208,613 | $329,430(-121k)#48 | $281,181(-72.6k)#14,476 |
| 49. | 83346 | $210,422 | $329,430(-119k)#49 | $281,181(-70.8k)#14,601 |
| 50. | 83423 | $212,486 | $329,430(-117k)#50 | $281,181(-68.7k)#14,733 |
| 51. | 83318 | $212,529 | $329,430(-117k)#51 | $281,181(-68.7k)#14,740 |
| 52. | 83522 | $212,607 | $329,430(-117k)#52 | $281,181(-68.6k)#14,751 |
| 53. | 83672 | $213,383 | $329,430(-116k)#53 | $281,181(-67.8k)#14,812 |
| 54. | 83811 | $214,171 | $329,430(-115k)#54 | $281,181(-67.0k)#14,878 |
| 55. | 83544 | $214,998 | $329,430(-114k)#55 | $281,181(-66.2k)#14,954 |
| 56. | 83355 | $215,541 | $329,430(-114k)#56 | $281,181(-65.6k)#15,001 |
| 57. | 83555 | $215,887 | $329,430(-114k)#57 | $281,181(-65.3k)#15,027 |
| 58. | 83217 | $217,044 | $329,430(-112k)#58 | $281,181(-64.1k)#15,113 |
| 59. | 83316 | $219,359 | $329,430(-110k)#59 | $281,181(-61.8k)#15,289 |
| 60. | 83201 | $219,629 | $329,430(-110k)#60 | $281,181(-61.6k)#15,305 |
| 61. | 83434 | $220,186 | $329,430(-109k)#61 | $281,181(-61.0k)#15,348 |
| 62. | 83526 | $221,100 | $329,430(-108k)#62 | $281,181(-60.1k)#15,423 |
| 63. | 83873 | $222,887 | $329,430(-107k)#63 | $281,181(-58.3k)#15,542 |
| 64. | 83537 | $222,894 | $329,430(-107k)#64 | $281,181(-58.3k)#15,544 |
| 65. | 83271 | $223,098 | $329,430(-106k)#65 | $281,181(-58.1k)#15,562 |
| 66. | 83431 | $223,626 | $329,430(-106k)#66 | $281,181(-57.6k)#15,593 |
| 67. | 83661 | $223,883 | $329,430(-106k)#67 | $281,181(-57.3k)#15,606 |
| 68. | 83610 | $224,750 | $329,430(-105k)#68 | $281,181(-56.4k)#15,679 |
| 69. | 83226 | $225,081 | $329,430(-104k)#69 | $281,181(-56.1k)#15,704 |
| 70. | 83252 | $225,300 | $329,430(-104k)#70 | $281,181(-55.9k)#15,717 |
| 71. | 83628 | $225,726 | $329,430(-104k)#71 | $281,181(-55.5k)#15,739 |
| 72. | 83221 | $226,273 | $329,430(-103k)#72 | $281,181(-54.9k)#15,786 |
| 73. | 83214 | $226,755 | $329,430(-103k)#73 | $281,181(-54.4k)#15,821 |
| 74. | 83255 | $227,902 | $329,430(-102k)#74 | $281,181(-53.3k)#15,910 |
| 75. | 83244 | $228,232 | $329,430(-101k)#75 | $281,181(-52.9k)#15,931 |
| 76. | 83536 | $231,762 | $329,430(-97.7k)#76 | $281,181(-49.4k)#16,177 |
| 77. | 83272 | $234,620 | $329,430(-94.8k)#77 | $281,181(-46.6k)#16,392 |
| 78. | 83822 | $237,422 | $329,430(-92.0k)#78 | $281,181(-43.8k)#16,566 |
| 79. | 83647 | $237,519 | $329,430(-91.9k)#79 | $281,181(-43.7k)#16,573 |
| 80. | 83338 | $238,638 | $329,430(-90.8k)#80 | $281,181(-42.5k)#16,633 |
| 81. | 83228 | $239,448 | $329,430(-90.0k)#81 | $281,181(-41.7k)#16,672 |
| 82. | 83541 | $240,584 | $329,430(-88.8k)#82 | $281,181(-40.6k)#16,737 |
| 83. | 83619 | $245,050 | $329,430(-84.4k)#83 | $281,181(-36.1k)#17,017 |
| 84. | 83232 | $245,190 | $329,430(-84.2k)#84 | $281,181(-36.0k)#17,023 |
| 85. | 83438 | $245,844 | $329,430(-83.6k)#85 | $281,181(-35.3k)#17,058 |
| 86. | 83320 | $251,068 | $329,430(-78.4k)#86 | $281,181(-30.1k)#17,371 |
| 87. | 83467 | $252,547 | $329,430(-76.9k)#87 | $281,181(-28.6k)#17,442 |
| 88. | 83344 | $252,948 | $329,430(-76.5k)#88 | $281,181(-28.2k)#17,458 |
| 89. | 83236 | $253,140 | $329,430(-76.3k)#89 | $281,181(-28.0k)#17,460 |
| 90. | 83605 | $254,513 | $329,430(-74.9k)#90 | $281,181(-26.7k)#17,529 |
| 91. | 83612 | $254,556 | $329,430(-74.9k)#91 | $281,181(-26.6k)#17,532 |
| 92. | 83301 | $255,300 | $329,430(-74.1k)#92 | $281,181(-25.9k)#17,580 |
| 93. | 83552 | $258,190 | $329,430(-71.2k)#93 | $281,181(-23.0k)#17,723 |
| 94. | 83530 | $258,601 | $329,430(-70.8k)#94 | $281,181(-22.6k)#17,751 |
| 95. | 83861 | $260,087 | $329,430(-69.3k)#95 | $281,181(-21.1k)#17,819 |
| 96. | 83651 | $260,231 | $329,430(-69.2k)#96 | $281,181(-20.9k)#17,826 |
| 97. | 83626 | $260,831 | $329,430(-68.6k)#97 | $281,181(-20.3k)#17,853 |
| 98. | 83347 | $261,098 | $329,430(-68.3k)#98 | $281,181(-20.1k)#17,869 |
| 99. | 83250 | $261,706 | $329,430(-67.7k)#99 | $281,181(-19.5k)#17,901 |
| 100. | 83402 | $261,854 | $329,430(-67.6k)#100 | $281,181(-19.3k)#17,907 |
Common Questions
What are the Top 10 Zip Codes with the Lowest Median Property Prices in Idaho?
Top 10 Zip Codes with the Lowest Median Property Prices in Idaho are:
What zip code has the Lowest Median Property Prices in Idaho?
83868 has the Lowest Median Property Prices in Idaho with $103,444.
What is the Median Property Prices in the State of Idaho?
Median Property Prices in Idaho is $329,430.
What is the Median Property Prices in the United States?
Median Property Prices in the United States is $281,181.