Immigrants from Poland vs Immigrants from Brazil GED/Equivalency

COMPARE

Immigrants from Poland
Race
Ancestry
AfghanAfricanAlaska NativeAlaskan AthabascanAlbanianAleutAlsatianAmericanApacheArabArapahoArgentineanArmenianAssyrian/Chaldean/SyriacAustralianAustrianBahamianBangladeshiBarbadianBasqueBelgianBelizeanBermudanBhutaneseBlackfeetBolivianBrazilianBritishBritish West IndianBulgarianBurmeseCajunCambodianCanadianCape VerdeanCarpatho RusynCelticCentral AmericanCentral American IndianCherokeeCheyenneChickasawChileanChineseChippewaChoctawColombianColvilleComancheCosta RicanCreeCreekCroatianCrowCubanCypriotCzechCzechoslovakianDanishDelawareDominicanDutchDutch West IndianEastern EuropeanEcuadorianEgyptianEnglishEstonianEthiopianEuropeanFijianFilipinoFinnishFrenchFrench American IndianFrench CanadianGermanGerman RussianGhanaianGreekGuamanian/ChamorroGuatemalanGuyaneseHaitianHmongHonduranHopiHoumaHungarianIcelanderIndian (Asian)IndonesianInupiatIranianIraqiIrishIroquoisIsraeliItalianJamaicanJapaneseJordanianKenyanKiowaKoreanLaotianLatvianLebaneseLiberianLithuanianLumbeeLuxembourgerMacedonianMalaysianMalteseMarshalleseMenomineeMexicanMexican American IndianMongolianMoroccanNative HawaiianNavajoNepaleseNew ZealanderNicaraguanNigerianNorthern EuropeanNorwegianOkinawanOsageOttawaPaiutePakistaniPalestinianPanamanianParaguayanPennsylvania GermanPeruvianPimaPolishPortuguesePotawatomiPuebloPuerto RicanPuget Sound SalishRomanianRussianSalvadoranSamoanScandinavianScotch-IrishScottishSeminoleSenegaleseSerbianShoshoneSierra LeoneanSiouxSlavicSlovakSloveneSomaliSouth AfricanSouth AmericanSouth American IndianSoviet UnionSpaniardSpanishSpanish AmericanSpanish American IndianSri LankanSubsaharan AfricanSudaneseSwedishSwissSyrianTaiwaneseThaiTlingit-HaidaTohono O'OdhamTonganTrinidadian and TobagonianTsimshianTurkishU.S. Virgin IslanderUgandanUkrainianUruguayanUteVenezuelanVietnameseWelshWest IndianYakamaYaquiYugoslavianYumanYup'ikZimbabwean
Immigration
NonimmigrantsImmigrantsAfghanistanAfricaAlbaniaArgentinaArmeniaAsiaAustraliaAustriaBahamasBangladeshBarbadosBelarusBelgiumBelizeBoliviaBosnia and HerzegovinaBulgariaBurma/MyanmarCabo VerdeCambodiaCameroonCanadaCaribbeanCentral AmericaChileChinaColombiaCongoCosta RicaCroatiaCubaCzechoslovakiaDenmarkDominicaDominican RepublicEastern AfricaEastern AsiaEastern EuropeEcuadorEgyptEl SalvadorEnglandEritreaEthiopiaEuropeFijiFranceGermanyGhanaGreeceGrenadaGuatemalaGuyanaHaitiHondurasHong KongHungaryIndiaIndonesiaIranIraqIrelandIsraelItalyJamaicaJapanJordanKazakhstanKenyaKoreaKuwaitLaosLatin AmericaLatviaLebanonLiberiaLithuaniaMalaysiaMexicoMicronesiaMiddle AfricaMoldovaMoroccoNepalNetherlandsNicaraguaNigeriaNorth AmericaNorth MacedoniaNorthern AfricaNorthern EuropeNorwayOceaniaPakistanPanamaPeruPhilippinesPolandPortugalRomaniaRussiaSaudi ArabiaScotlandSenegalSerbiaSierra LeoneSingaporeSomaliaSouth AfricaSouth AmericaSouth Central AsiaSouth Eastern AsiaSouthern EuropeSpainSri LankaSt. Vincent and the GrenadinesSudanSwedenSwitzerlandSyriaTaiwanThailandTrinidad and TobagoTurkeyUgandaUkraineUruguayUzbekistanVenezuelaVietnamWest IndiesWestern AfricaWestern AsiaWestern EuropeYemenZaireZimbabweAzores
Immigrants from Brazil
Race
Ancestry
AfghanAfricanAlaska NativeAlaskan AthabascanAlbanianAleutAlsatianAmericanApacheArabArapahoArgentineanArmenianAssyrian/Chaldean/SyriacAustralianAustrianBahamianBangladeshiBarbadianBasqueBelgianBelizeanBermudanBhutaneseBlackfeetBolivianBrazilianBritishBritish West IndianBulgarianBurmeseCajunCambodianCanadianCape VerdeanCarpatho RusynCelticCentral AmericanCentral American IndianCherokeeCheyenneChickasawChileanChineseChippewaChoctawColombianColvilleComancheCosta RicanCreeCreekCroatianCrowCubanCypriotCzechCzechoslovakianDanishDelawareDominicanDutchDutch West IndianEastern EuropeanEcuadorianEgyptianEnglishEstonianEthiopianEuropeanFijianFilipinoFinnishFrenchFrench American IndianFrench CanadianGermanGerman RussianGhanaianGreekGuamanian/ChamorroGuatemalanGuyaneseHaitianHmongHonduranHopiHoumaHungarianIcelanderIndian (Asian)IndonesianInupiatIranianIraqiIrishIroquoisIsraeliItalianJamaicanJapaneseJordanianKenyanKiowaKoreanLaotianLatvianLebaneseLiberianLithuanianLumbeeLuxembourgerMacedonianMalaysianMalteseMarshalleseMenomineeMexicanMexican American IndianMongolianMoroccanNative HawaiianNavajoNepaleseNew ZealanderNicaraguanNigerianNorthern EuropeanNorwegianOkinawanOsageOttawaPaiutePakistaniPalestinianPanamanianParaguayanPennsylvania GermanPeruvianPimaPolishPortuguesePotawatomiPuebloPuerto RicanPuget Sound SalishRomanianRussianSalvadoranSamoanScandinavianScotch-IrishScottishSeminoleSenegaleseSerbianShoshoneSierra LeoneanSiouxSlavicSlovakSloveneSomaliSouth AfricanSouth AmericanSouth American IndianSoviet UnionSpaniardSpanishSpanish AmericanSpanish American IndianSri LankanSubsaharan AfricanSudaneseSwedishSwissSyrianTaiwaneseThaiTlingit-HaidaTohono O'OdhamTonganTrinidadian and TobagonianTsimshianTurkishU.S. Virgin IslanderUgandanUkrainianUruguayanUteVenezuelanVietnameseWelshWest IndianYakamaYaquiYugoslavianYumanYup'ikZimbabwean
Immigration
NonimmigrantsImmigrantsAfghanistanAfricaAlbaniaArgentinaArmeniaAsiaAustraliaAustriaBahamasBangladeshBarbadosBelarusBelgiumBelizeBoliviaBosnia and HerzegovinaBrazilBulgariaBurma/MyanmarCabo VerdeCambodiaCameroonCanadaCaribbeanCentral AmericaChileChinaColombiaCongoCosta RicaCroatiaCubaCzechoslovakiaDenmarkDominicaDominican RepublicEastern AfricaEastern AsiaEastern EuropeEcuadorEgyptEl SalvadorEnglandEritreaEthiopiaEuropeFijiFranceGermanyGhanaGreeceGrenadaGuatemalaGuyanaHaitiHondurasHong KongHungaryIndiaIndonesiaIranIraqIrelandIsraelItalyJamaicaJapanJordanKazakhstanKenyaKoreaKuwaitLaosLatin AmericaLatviaLebanonLiberiaLithuaniaMalaysiaMexicoMicronesiaMiddle AfricaMoldovaMoroccoNepalNetherlandsNicaraguaNigeriaNorth AmericaNorth MacedoniaNorthern AfricaNorthern EuropeNorwayOceaniaPakistanPanamaPeruPhilippinesPortugalRomaniaRussiaSaudi ArabiaScotlandSenegalSerbiaSierra LeoneSingaporeSomaliaSouth AfricaSouth AmericaSouth Central AsiaSouth Eastern AsiaSouthern EuropeSpainSri LankaSt. Vincent and the GrenadinesSudanSwedenSwitzerlandSyriaTaiwanThailandTrinidad and TobagoTurkeyUgandaUkraineUruguayUzbekistanVenezuelaVietnamWest IndiesWestern AfricaWestern AsiaWestern EuropeYemenZaireZimbabweAzores
GED/Equivalency
Income
Poverty
Unemployment
Labor Participation
Family Structure
Vehicle Availability
Education Level
Disability

GED/Equivalency Comparison

Immigrants from Poland

Immigrants from Brazil

Good
Excellent
86.3%
GED/EQUIVALENCY
79.3/ 100
METRIC RATING
148th/ 347
METRIC RANK
86.6%
GED/EQUIVALENCY
88.4/ 100
METRIC RATING
132nd/ 347
METRIC RANK

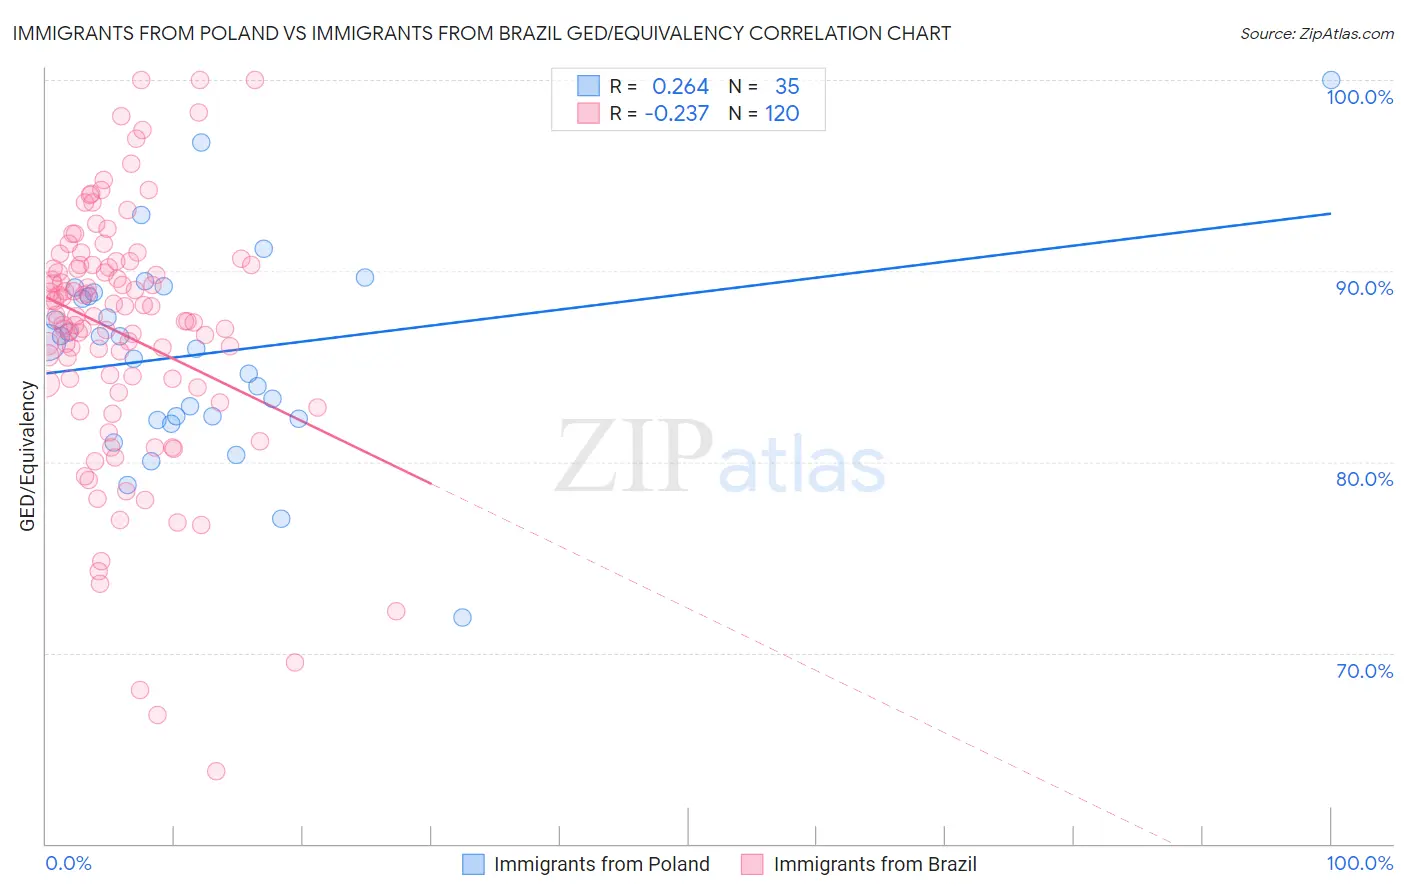
Immigrants from Poland vs Immigrants from Brazil GED/Equivalency Correlation Chart

The statistical analysis conducted on geographies consisting of 304,861,877 people shows a weak positive correlation between the proportion of Immigrants from Poland and percentage of population with at least ged/equivalency education in the United States with a correlation coefficient (R) of 0.264 and weighted average of 86.3%. Similarly, the statistical analysis conducted on geographies consisting of 343,008,543 people shows a weak negative correlation between the proportion of Immigrants from Brazil and percentage of population with at least ged/equivalency education in the United States with a correlation coefficient (R) of -0.237 and weighted average of 86.6%, a difference of 0.35%.
Immigrants from Poland vs Immigrants from Brazil GED/Equivalency

GED/Equivalency Correlation Summary

MeasurementImmigrants from PolandImmigrants from Brazil
Minimum71.9%63.8%
Maximum100.0%100.0%
Range28.1%36.2%
Mean85.7%86.7%
Median86.2%87.6%
Interquartile 25% (IQ1)82.3%84.0%
Interquartile 75% (IQ3)88.9%90.3%
Interquartile Range (IQR)6.6%6.3%
Standard Deviation (Sample)5.4%6.6%
Standard Deviation (Population)5.3%6.6%

Demographics Similar to Immigrants from Poland and Immigrants from Brazil by GED/Equivalency

In terms of ged/equivalency, the demographic groups most similar to Immigrants from Poland are Basque (86.4%, a difference of 0.0%), Immigrants from Northern Africa (86.3%, a difference of 0.0%), Menominee (86.3%, a difference of 0.0%), Immigrants from Western Asia (86.3%, a difference of 0.020%), and Pakistani (86.4%, a difference of 0.030%). Similarly, the demographic groups most similar to Immigrants from Brazil are Immigrants from Spain (86.7%, a difference of 0.0%), Tsimshian (86.6%, a difference of 0.0%), Immigrants from Germany (86.7%, a difference of 0.020%), Albanian (86.6%, a difference of 0.030%), and Immigrants from Asia (86.6%, a difference of 0.050%).
DemographicsRating | RankGED/Equivalency
Immigrants | Germany
88.8
/100
|
#130
Excellent
86.7%
Immigrants | Spain
88.5
/100
|
#131
Excellent
86.7%
Immigrants | Brazil
88.4
/100
|
#132
Excellent
86.6%
Tsimshian
88.3
/100
|
#133
Excellent
86.6%
Albanians
87.7
/100
|
#134
Excellent
86.6%
Immigrants | Asia
87.4
/100
|
#135
Excellent
86.6%
Chileans
86.9
/100
|
#136
Excellent
86.6%
Arabs
86.7
/100
|
#137
Excellent
86.6%
Immigrants | Argentina
86.5
/100
|
#138
Excellent
86.6%
Immigrants | Malaysia
85.0
/100
|
#139
Excellent
86.5%
Paraguayans
84.1
/100
|
#140
Excellent
86.5%
Laotians
83.2
/100
|
#141
Excellent
86.5%
Immigrants | Indonesia
82.4
/100
|
#142
Excellent
86.4%
Immigrants | Pakistan
82.4
/100
|
#143
Excellent
86.4%
Bolivians
82.1
/100
|
#144
Excellent
86.4%
Pakistanis
80.4
/100
|
#145
Excellent
86.4%
Basques
79.5
/100
|
#146
Good
86.4%
Immigrants | Northern Africa
79.3
/100
|
#147
Good
86.3%
Immigrants | Poland
79.3
/100
|
#148
Good
86.3%
Menominee
79.3
/100
|
#149
Good
86.3%
Immigrants | Western Asia
78.8
/100
|
#150
Good
86.3%