Immigrants from Poland vs Immigrants from Eastern Europe GED/Equivalency
COMPARE
Immigrants from Poland
Immigrants from Eastern Europe
GED/Equivalency
GED/Equivalency Comparison
Immigrants from Poland
Immigrants from Eastern Europe
86.3%
GED/EQUIVALENCY
79.3/ 100
METRIC RATING
148th/ 347
METRIC RANK
87.1%
GED/EQUIVALENCY
95.5/ 100
METRIC RATING
109th/ 347
METRIC RANK
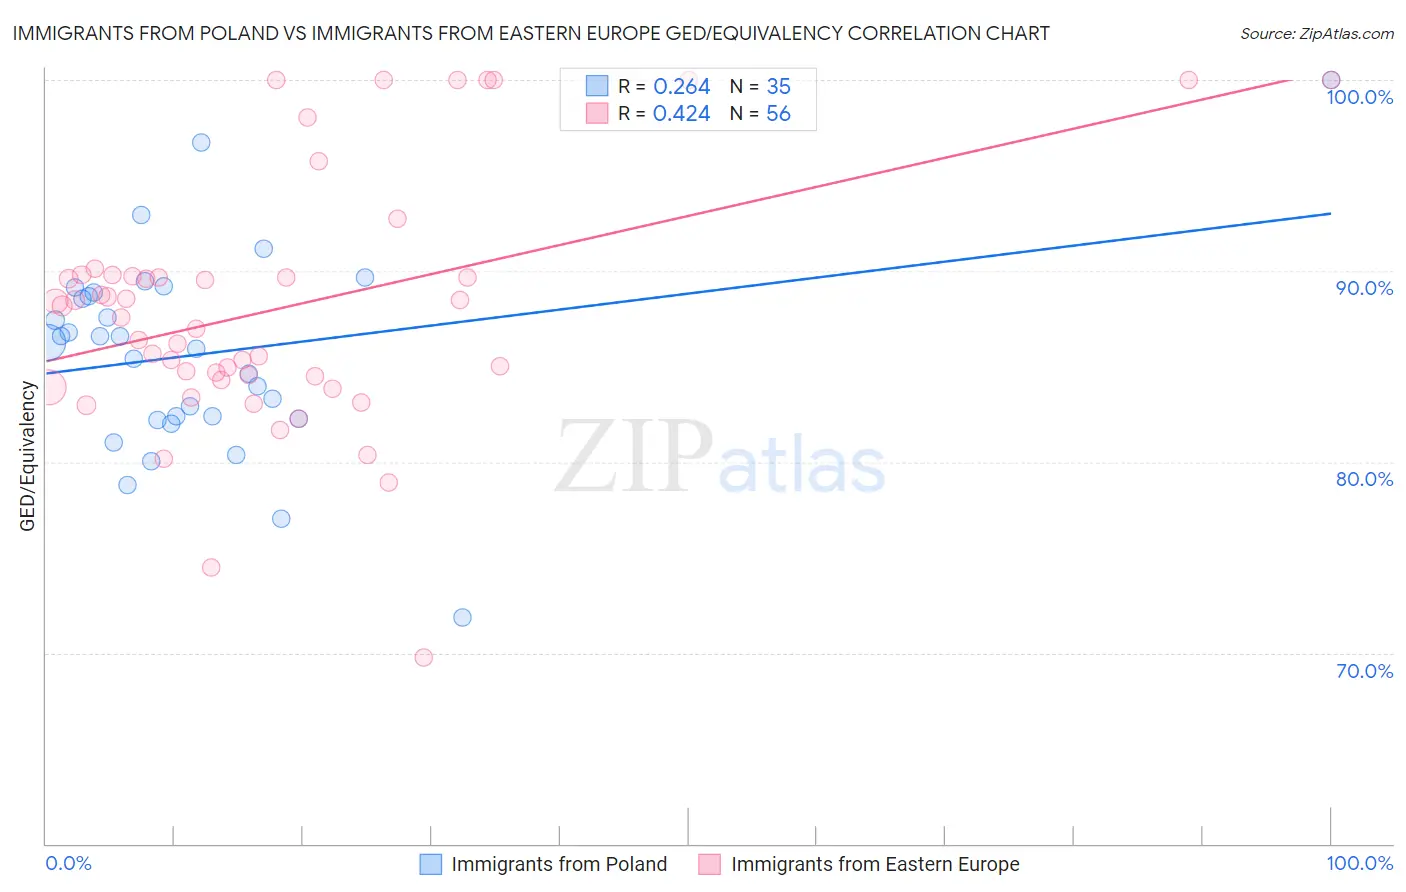
Immigrants from Poland vs Immigrants from Eastern Europe GED/Equivalency Correlation Chart
The statistical analysis conducted on geographies consisting of 304,861,877 people shows a weak positive correlation between the proportion of Immigrants from Poland and percentage of population with at least ged/equivalency education in the United States with a correlation coefficient (R) of 0.264 and weighted average of 86.3%. Similarly, the statistical analysis conducted on geographies consisting of 475,879,420 people shows a moderate positive correlation between the proportion of Immigrants from Eastern Europe and percentage of population with at least ged/equivalency education in the United States with a correlation coefficient (R) of 0.424 and weighted average of 87.1%, a difference of 0.88%.
GED/Equivalency Correlation Summary
| Measurement | Immigrants from Poland | Immigrants from Eastern Europe |
| Minimum | 71.9% | 69.7% |
| Maximum | 100.0% | 100.0% |
| Range | 28.1% | 30.3% |
| Mean | 85.7% | 88.1% |
| Median | 86.2% | 87.9% |
| Interquartile 25% (IQ1) | 82.3% | 84.4% |
| Interquartile 75% (IQ3) | 88.9% | 89.7% |
| Interquartile Range (IQR) | 6.6% | 5.4% |
| Standard Deviation (Sample) | 5.4% | 6.6% |
| Standard Deviation (Population) | 5.3% | 6.5% |
Similar Demographics by GED/Equivalency
Demographics Similar to Immigrants from Poland by GED/Equivalency
In terms of ged/equivalency, the demographic groups most similar to Immigrants from Poland are Basque (86.4%, a difference of 0.0%), Immigrants from Northern Africa (86.3%, a difference of 0.0%), Menominee (86.3%, a difference of 0.0%), Immigrants from Western Asia (86.3%, a difference of 0.020%), and Pakistani (86.4%, a difference of 0.030%).
| Demographics | Rating | Rank | GED/Equivalency |
| Laotians | 83.2 /100 | #141 | Excellent 86.5% |
| Immigrants | Indonesia | 82.4 /100 | #142 | Excellent 86.4% |
| Immigrants | Pakistan | 82.4 /100 | #143 | Excellent 86.4% |
| Bolivians | 82.1 /100 | #144 | Excellent 86.4% |
| Pakistanis | 80.4 /100 | #145 | Excellent 86.4% |
| Basques | 79.5 /100 | #146 | Good 86.4% |
| Immigrants | Northern Africa | 79.3 /100 | #147 | Good 86.3% |
| Immigrants | Poland | 79.3 /100 | #148 | Good 86.3% |
| Menominee | 79.3 /100 | #149 | Good 86.3% |
| Immigrants | Western Asia | 78.8 /100 | #150 | Good 86.3% |
| Immigrants | Bosnia and Herzegovina | 77.9 /100 | #151 | Good 86.3% |
| Brazilians | 77.2 /100 | #152 | Good 86.3% |
| Kenyans | 76.6 /100 | #153 | Good 86.3% |
| Armenians | 76.4 /100 | #154 | Good 86.3% |
| Iraqis | 75.2 /100 | #155 | Good 86.2% |
Demographics Similar to Immigrants from Eastern Europe by GED/Equivalency
In terms of ged/equivalency, the demographic groups most similar to Immigrants from Eastern Europe are Canadian (87.1%, a difference of 0.010%), Icelander (87.1%, a difference of 0.030%), Egyptian (87.1%, a difference of 0.030%), French (87.1%, a difference of 0.030%), and Immigrants from Zimbabwe (87.1%, a difference of 0.040%).
| Demographics | Rating | Rank | GED/Equivalency |
| Lebanese | 96.2 /100 | #102 | Exceptional 87.2% |
| Jordanians | 96.1 /100 | #103 | Exceptional 87.2% |
| Immigrants | Hungary | 96.0 /100 | #104 | Exceptional 87.2% |
| Indians (Asian) | 95.9 /100 | #105 | Exceptional 87.1% |
| Immigrants | Zimbabwe | 95.8 /100 | #106 | Exceptional 87.1% |
| Icelanders | 95.7 /100 | #107 | Exceptional 87.1% |
| Canadians | 95.6 /100 | #108 | Exceptional 87.1% |
| Immigrants | Eastern Europe | 95.5 /100 | #109 | Exceptional 87.1% |
| Egyptians | 95.3 /100 | #110 | Exceptional 87.1% |
| French | 95.2 /100 | #111 | Exceptional 87.1% |
| Tlingit-Haida | 94.8 /100 | #112 | Exceptional 87.0% |
| Assyrians/Chaldeans/Syriacs | 94.8 /100 | #113 | Exceptional 87.0% |
| Immigrants | Kazakhstan | 94.7 /100 | #114 | Exceptional 87.0% |
| Mongolians | 94.6 /100 | #115 | Exceptional 87.0% |
| Swiss | 94.5 /100 | #116 | Exceptional 87.0% |