Immigrants from Honduras vs Puget Sound Salish GED/Equivalency
COMPARE
Immigrants from Honduras
Puget Sound Salish
GED/Equivalency
GED/Equivalency Comparison
Immigrants from Honduras
Puget Sound Salish
78.7%
GED/EQUIVALENCY
0.0/ 100
METRIC RATING
331st/ 347
METRIC RANK
85.2%
GED/EQUIVALENCY
20.8/ 100
METRIC RATING
194th/ 347
METRIC RANK
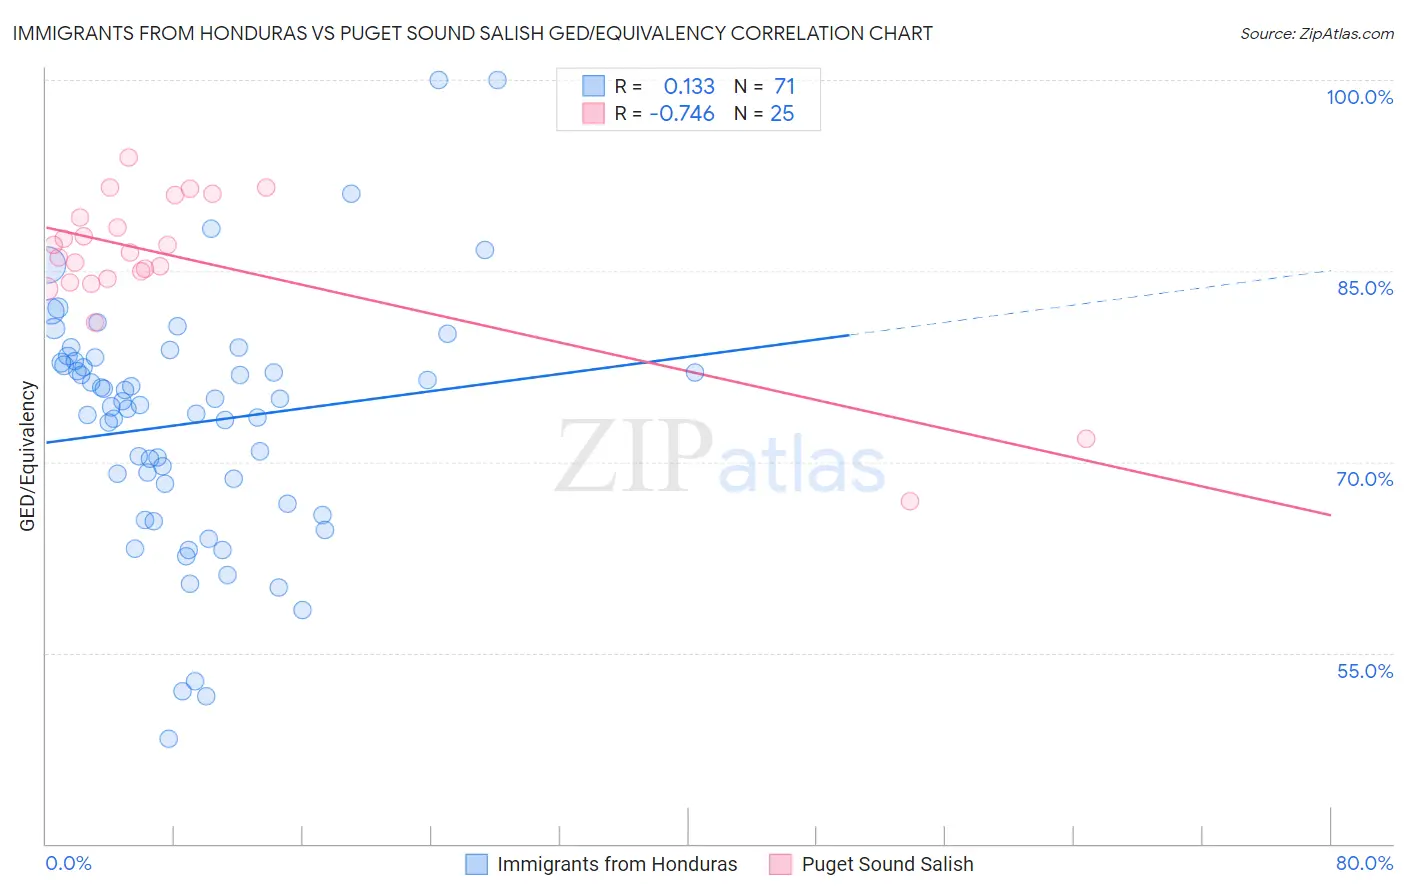
Immigrants from Honduras vs Puget Sound Salish GED/Equivalency Correlation Chart
The statistical analysis conducted on geographies consisting of 322,637,196 people shows a poor positive correlation between the proportion of Immigrants from Honduras and percentage of population with at least ged/equivalency education in the United States with a correlation coefficient (R) of 0.133 and weighted average of 78.7%. Similarly, the statistical analysis conducted on geographies consisting of 46,155,775 people shows a strong negative correlation between the proportion of Puget Sound Salish and percentage of population with at least ged/equivalency education in the United States with a correlation coefficient (R) of -0.746 and weighted average of 85.2%, a difference of 8.2%.
GED/Equivalency Correlation Summary
| Measurement | Immigrants from Honduras | Puget Sound Salish |
| Minimum | 48.2% | 66.9% |
| Maximum | 100.0% | 93.9% |
| Range | 51.8% | 26.9% |
| Mean | 73.0% | 85.9% |
| Median | 74.5% | 86.5% |
| Interquartile 25% (IQ1) | 66.7% | 84.3% |
| Interquartile 75% (IQ3) | 78.0% | 90.1% |
| Interquartile Range (IQR) | 11.2% | 5.8% |
| Standard Deviation (Sample) | 9.7% | 5.9% |
| Standard Deviation (Population) | 9.7% | 5.8% |
Similar Demographics by GED/Equivalency
Demographics Similar to Immigrants from Honduras by GED/Equivalency
In terms of ged/equivalency, the demographic groups most similar to Immigrants from Honduras are Immigrants from the Azores (78.7%, a difference of 0.11%), Salvadoran (78.6%, a difference of 0.22%), Immigrants from Cabo Verde (78.9%, a difference of 0.24%), Guatemalan (78.5%, a difference of 0.31%), and Immigrants from Latin America (78.5%, a difference of 0.33%).
| Demographics | Rating | Rank | GED/Equivalency |
| Mexican American Indians | 0.0 /100 | #324 | Tragic 79.4% |
| Hondurans | 0.0 /100 | #325 | Tragic 79.3% |
| Yuman | 0.0 /100 | #326 | Tragic 79.2% |
| Central Americans | 0.0 /100 | #327 | Tragic 79.2% |
| Hispanics or Latinos | 0.0 /100 | #328 | Tragic 79.1% |
| Dominicans | 0.0 /100 | #329 | Tragic 79.1% |
| Immigrants | Cabo Verde | 0.0 /100 | #330 | Tragic 78.9% |
| Immigrants | Honduras | 0.0 /100 | #331 | Tragic 78.7% |
| Immigrants | Azores | 0.0 /100 | #332 | Tragic 78.7% |
| Salvadorans | 0.0 /100 | #333 | Tragic 78.6% |
| Guatemalans | 0.0 /100 | #334 | Tragic 78.5% |
| Immigrants | Latin America | 0.0 /100 | #335 | Tragic 78.5% |
| Immigrants | Dominican Republic | 0.0 /100 | #336 | Tragic 78.0% |
| Immigrants | Yemen | 0.0 /100 | #337 | Tragic 77.9% |
| Immigrants | Guatemala | 0.0 /100 | #338 | Tragic 77.9% |
Demographics Similar to Puget Sound Salish by GED/Equivalency
In terms of ged/equivalency, the demographic groups most similar to Puget Sound Salish are Chippewa (85.2%, a difference of 0.0%), Tongan (85.2%, a difference of 0.0%), Costa Rican (85.2%, a difference of 0.010%), Delaware (85.2%, a difference of 0.040%), and South American Indian (85.2%, a difference of 0.060%).
| Demographics | Rating | Rank | GED/Equivalency |
| Immigrants | Afghanistan | 29.8 /100 | #187 | Fair 85.4% |
| Immigrants | Sierra Leone | 29.0 /100 | #188 | Fair 85.4% |
| Guamanians/Chamorros | 28.4 /100 | #189 | Fair 85.3% |
| Alaskan Athabascans | 27.5 /100 | #190 | Fair 85.3% |
| South American Indians | 22.8 /100 | #191 | Fair 85.2% |
| Immigrants | Nonimmigrants | 22.7 /100 | #192 | Fair 85.2% |
| Delaware | 22.2 /100 | #193 | Fair 85.2% |
| Puget Sound Salish | 20.8 /100 | #194 | Fair 85.2% |
| Chippewa | 20.8 /100 | #195 | Fair 85.2% |
| Tongans | 20.7 /100 | #196 | Fair 85.2% |
| Costa Ricans | 20.4 /100 | #197 | Fair 85.2% |
| Immigrants | Africa | 17.5 /100 | #198 | Poor 85.1% |
| Somalis | 16.4 /100 | #199 | Poor 85.0% |
| Uruguayans | 16.0 /100 | #200 | Poor 85.0% |
| Portuguese | 15.9 /100 | #201 | Poor 85.0% |