Immigrants from Honduras vs Lumbee GED/Equivalency
COMPARE
Immigrants from Honduras
Lumbee
GED/Equivalency
GED/Equivalency Comparison
Immigrants from Honduras
Lumbee
78.7%
GED/EQUIVALENCY
0.0/ 100
METRIC RATING
331st/ 347
METRIC RANK
80.0%
GED/EQUIVALENCY
0.0/ 100
METRIC RATING
322nd/ 347
METRIC RANK
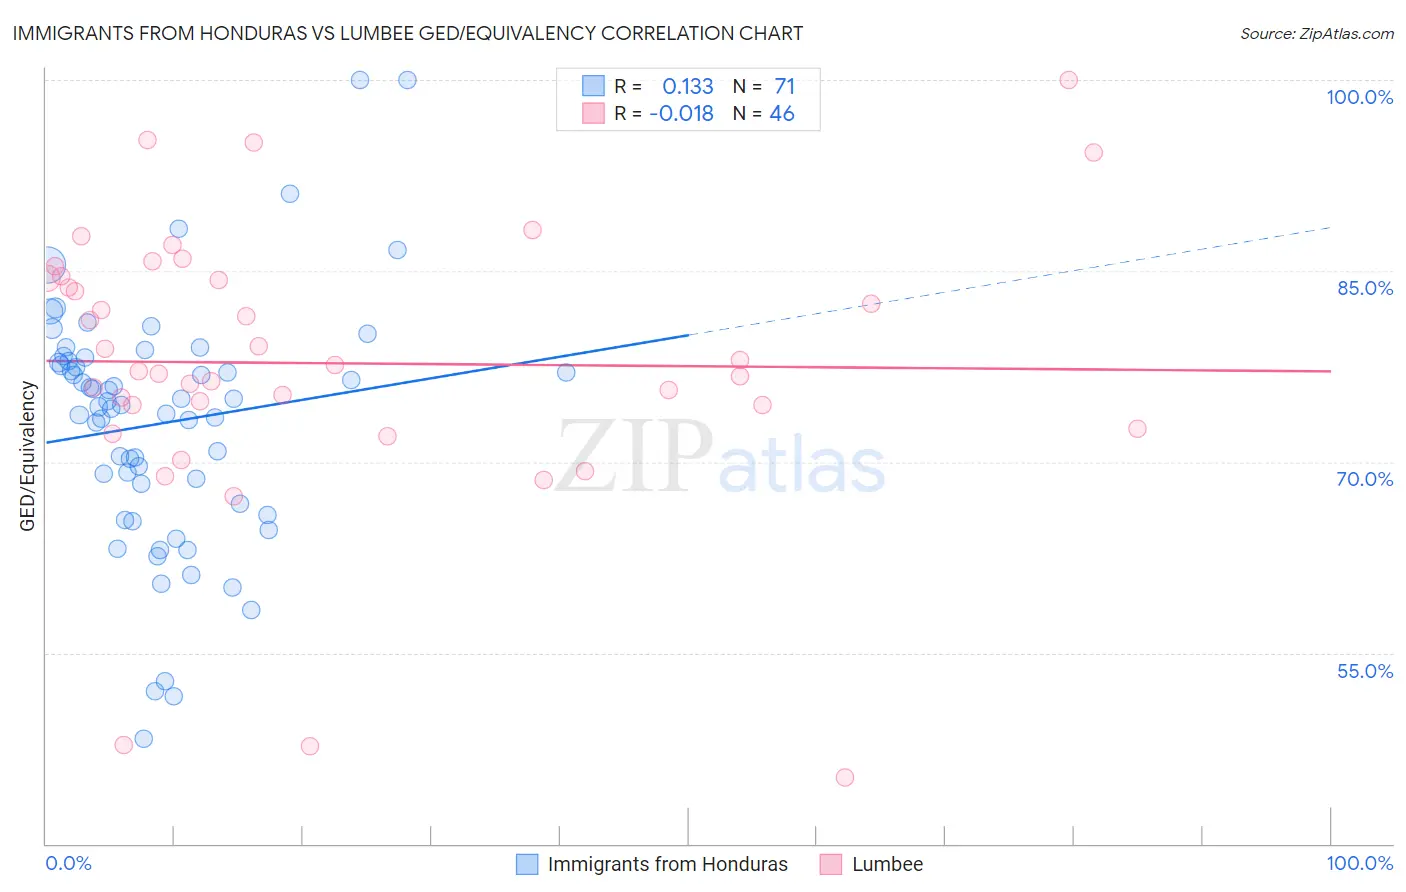
Immigrants from Honduras vs Lumbee GED/Equivalency Correlation Chart
The statistical analysis conducted on geographies consisting of 322,637,196 people shows a poor positive correlation between the proportion of Immigrants from Honduras and percentage of population with at least ged/equivalency education in the United States with a correlation coefficient (R) of 0.133 and weighted average of 78.7%. Similarly, the statistical analysis conducted on geographies consisting of 92,299,068 people shows no correlation between the proportion of Lumbee and percentage of population with at least ged/equivalency education in the United States with a correlation coefficient (R) of -0.018 and weighted average of 80.0%, a difference of 1.6%.
GED/Equivalency Correlation Summary
| Measurement | Immigrants from Honduras | Lumbee |
| Minimum | 48.2% | 45.2% |
| Maximum | 100.0% | 100.0% |
| Range | 51.8% | 54.8% |
| Mean | 73.0% | 77.7% |
| Median | 74.5% | 77.4% |
| Interquartile 25% (IQ1) | 66.7% | 74.5% |
| Interquartile 75% (IQ3) | 78.0% | 84.4% |
| Interquartile Range (IQR) | 11.2% | 10.0% |
| Standard Deviation (Sample) | 9.7% | 11.1% |
| Standard Deviation (Population) | 9.7% | 11.0% |
Demographics Similar to Immigrants from Honduras and Lumbee by GED/Equivalency
In terms of ged/equivalency, the demographic groups most similar to Immigrants from Honduras are Immigrants from the Azores (78.7%, a difference of 0.11%), Salvadoran (78.6%, a difference of 0.22%), Immigrants from Cabo Verde (78.9%, a difference of 0.24%), Guatemalan (78.5%, a difference of 0.31%), and Immigrants from Latin America (78.5%, a difference of 0.33%). Similarly, the demographic groups most similar to Lumbee are Yup'ik (80.0%, a difference of 0.070%), Immigrants from Nicaragua (79.9%, a difference of 0.12%), Immigrants from Cuba (80.2%, a difference of 0.24%), Yaqui (80.5%, a difference of 0.65%), and Immigrants from Belize (80.5%, a difference of 0.65%).
| Demographics | Rating | Rank | GED/Equivalency |
| Central American Indians | 0.0 /100 | #316 | Tragic 80.6% |
| Immigrants | Caribbean | 0.0 /100 | #317 | Tragic 80.5% |
| Yaqui | 0.0 /100 | #318 | Tragic 80.5% |
| Immigrants | Belize | 0.0 /100 | #319 | Tragic 80.5% |
| Immigrants | Cuba | 0.0 /100 | #320 | Tragic 80.2% |
| Yup'ik | 0.0 /100 | #321 | Tragic 80.0% |
| Lumbee | 0.0 /100 | #322 | Tragic 80.0% |
| Immigrants | Nicaragua | 0.0 /100 | #323 | Tragic 79.9% |
| Mexican American Indians | 0.0 /100 | #324 | Tragic 79.4% |
| Hondurans | 0.0 /100 | #325 | Tragic 79.3% |
| Yuman | 0.0 /100 | #326 | Tragic 79.2% |
| Central Americans | 0.0 /100 | #327 | Tragic 79.2% |
| Hispanics or Latinos | 0.0 /100 | #328 | Tragic 79.1% |
| Dominicans | 0.0 /100 | #329 | Tragic 79.1% |
| Immigrants | Cabo Verde | 0.0 /100 | #330 | Tragic 78.9% |
| Immigrants | Honduras | 0.0 /100 | #331 | Tragic 78.7% |
| Immigrants | Azores | 0.0 /100 | #332 | Tragic 78.7% |
| Salvadorans | 0.0 /100 | #333 | Tragic 78.6% |
| Guatemalans | 0.0 /100 | #334 | Tragic 78.5% |
| Immigrants | Latin America | 0.0 /100 | #335 | Tragic 78.5% |
| Immigrants | Dominican Republic | 0.0 /100 | #336 | Tragic 78.0% |