Immigrants from Honduras vs Alaska Native GED/Equivalency
COMPARE
Immigrants from Honduras
Alaska Native
GED/Equivalency
GED/Equivalency Comparison
Immigrants from Honduras
Alaska Natives
78.7%
GED/EQUIVALENCY
0.0/ 100
METRIC RATING
331st/ 347
METRIC RANK
84.7%
GED/EQUIVALENCY
8.6/ 100
METRIC RATING
218th/ 347
METRIC RANK
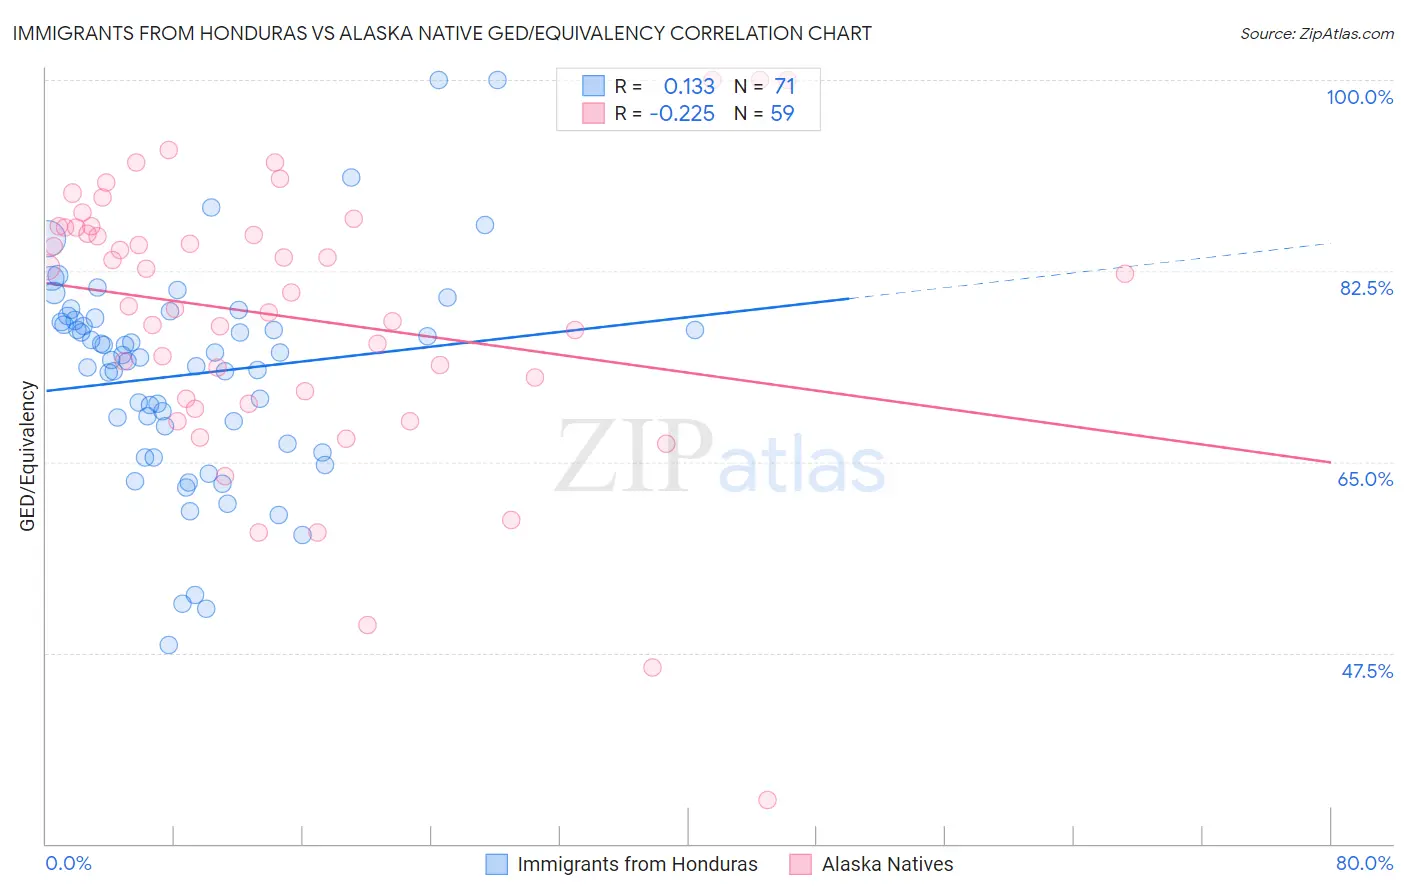
Immigrants from Honduras vs Alaska Native GED/Equivalency Correlation Chart
The statistical analysis conducted on geographies consisting of 322,637,196 people shows a poor positive correlation between the proportion of Immigrants from Honduras and percentage of population with at least ged/equivalency education in the United States with a correlation coefficient (R) of 0.133 and weighted average of 78.7%. Similarly, the statistical analysis conducted on geographies consisting of 76,778,887 people shows a weak negative correlation between the proportion of Alaska Natives and percentage of population with at least ged/equivalency education in the United States with a correlation coefficient (R) of -0.225 and weighted average of 84.7%, a difference of 7.6%.
GED/Equivalency Correlation Summary
| Measurement | Immigrants from Honduras | Alaska Native |
| Minimum | 48.2% | 34.0% |
| Maximum | 100.0% | 100.0% |
| Range | 51.8% | 66.0% |
| Mean | 73.0% | 78.3% |
| Median | 74.5% | 80.5% |
| Interquartile 25% (IQ1) | 66.7% | 70.8% |
| Interquartile 75% (IQ3) | 78.0% | 86.5% |
| Interquartile Range (IQR) | 11.2% | 15.7% |
| Standard Deviation (Sample) | 9.7% | 12.9% |
| Standard Deviation (Population) | 9.7% | 12.7% |
Similar Demographics by GED/Equivalency
Demographics Similar to Immigrants from Honduras by GED/Equivalency
In terms of ged/equivalency, the demographic groups most similar to Immigrants from Honduras are Immigrants from the Azores (78.7%, a difference of 0.11%), Salvadoran (78.6%, a difference of 0.22%), Immigrants from Cabo Verde (78.9%, a difference of 0.24%), Guatemalan (78.5%, a difference of 0.31%), and Immigrants from Latin America (78.5%, a difference of 0.33%).
| Demographics | Rating | Rank | GED/Equivalency |
| Mexican American Indians | 0.0 /100 | #324 | Tragic 79.4% |
| Hondurans | 0.0 /100 | #325 | Tragic 79.3% |
| Yuman | 0.0 /100 | #326 | Tragic 79.2% |
| Central Americans | 0.0 /100 | #327 | Tragic 79.2% |
| Hispanics or Latinos | 0.0 /100 | #328 | Tragic 79.1% |
| Dominicans | 0.0 /100 | #329 | Tragic 79.1% |
| Immigrants | Cabo Verde | 0.0 /100 | #330 | Tragic 78.9% |
| Immigrants | Honduras | 0.0 /100 | #331 | Tragic 78.7% |
| Immigrants | Azores | 0.0 /100 | #332 | Tragic 78.7% |
| Salvadorans | 0.0 /100 | #333 | Tragic 78.6% |
| Guatemalans | 0.0 /100 | #334 | Tragic 78.5% |
| Immigrants | Latin America | 0.0 /100 | #335 | Tragic 78.5% |
| Immigrants | Dominican Republic | 0.0 /100 | #336 | Tragic 78.0% |
| Immigrants | Yemen | 0.0 /100 | #337 | Tragic 77.9% |
| Immigrants | Guatemala | 0.0 /100 | #338 | Tragic 77.9% |
Demographics Similar to Alaska Natives by GED/Equivalency
In terms of ged/equivalency, the demographic groups most similar to Alaska Natives are Immigrants from Micronesia (84.7%, a difference of 0.0%), Nigerian (84.7%, a difference of 0.0%), Peruvian (84.7%, a difference of 0.030%), Potawatomi (84.7%, a difference of 0.030%), and American (84.7%, a difference of 0.030%).
| Demographics | Rating | Rank | GED/Equivalency |
| South Americans | 10.9 /100 | #211 | Poor 84.8% |
| Immigrants | Somalia | 10.6 /100 | #212 | Poor 84.8% |
| Immigrants | Philippines | 10.0 /100 | #213 | Poor 84.8% |
| Osage | 9.5 /100 | #214 | Tragic 84.8% |
| Peruvians | 9.2 /100 | #215 | Tragic 84.7% |
| Immigrants | Micronesia | 8.7 /100 | #216 | Tragic 84.7% |
| Nigerians | 8.6 /100 | #217 | Tragic 84.7% |
| Alaska Natives | 8.6 /100 | #218 | Tragic 84.7% |
| Potawatomi | 8.2 /100 | #219 | Tragic 84.7% |
| Americans | 8.2 /100 | #220 | Tragic 84.7% |
| Taiwanese | 8.1 /100 | #221 | Tragic 84.7% |
| Iroquois | 7.5 /100 | #222 | Tragic 84.6% |
| Immigrants | Uzbekistan | 7.1 /100 | #223 | Tragic 84.6% |
| French American Indians | 6.3 /100 | #224 | Tragic 84.6% |
| Immigrants | Thailand | 5.8 /100 | #225 | Tragic 84.5% |