Immigrants from Honduras vs Immigrants from Syria GED/Equivalency
COMPARE
Immigrants from Honduras
Immigrants from Syria
GED/Equivalency
GED/Equivalency Comparison
Immigrants from Honduras
Immigrants from Syria
78.7%
GED/EQUIVALENCY
0.0/ 100
METRIC RATING
331st/ 347
METRIC RANK
86.1%
GED/EQUIVALENCY
69.3/ 100
METRIC RATING
161st/ 347
METRIC RANK
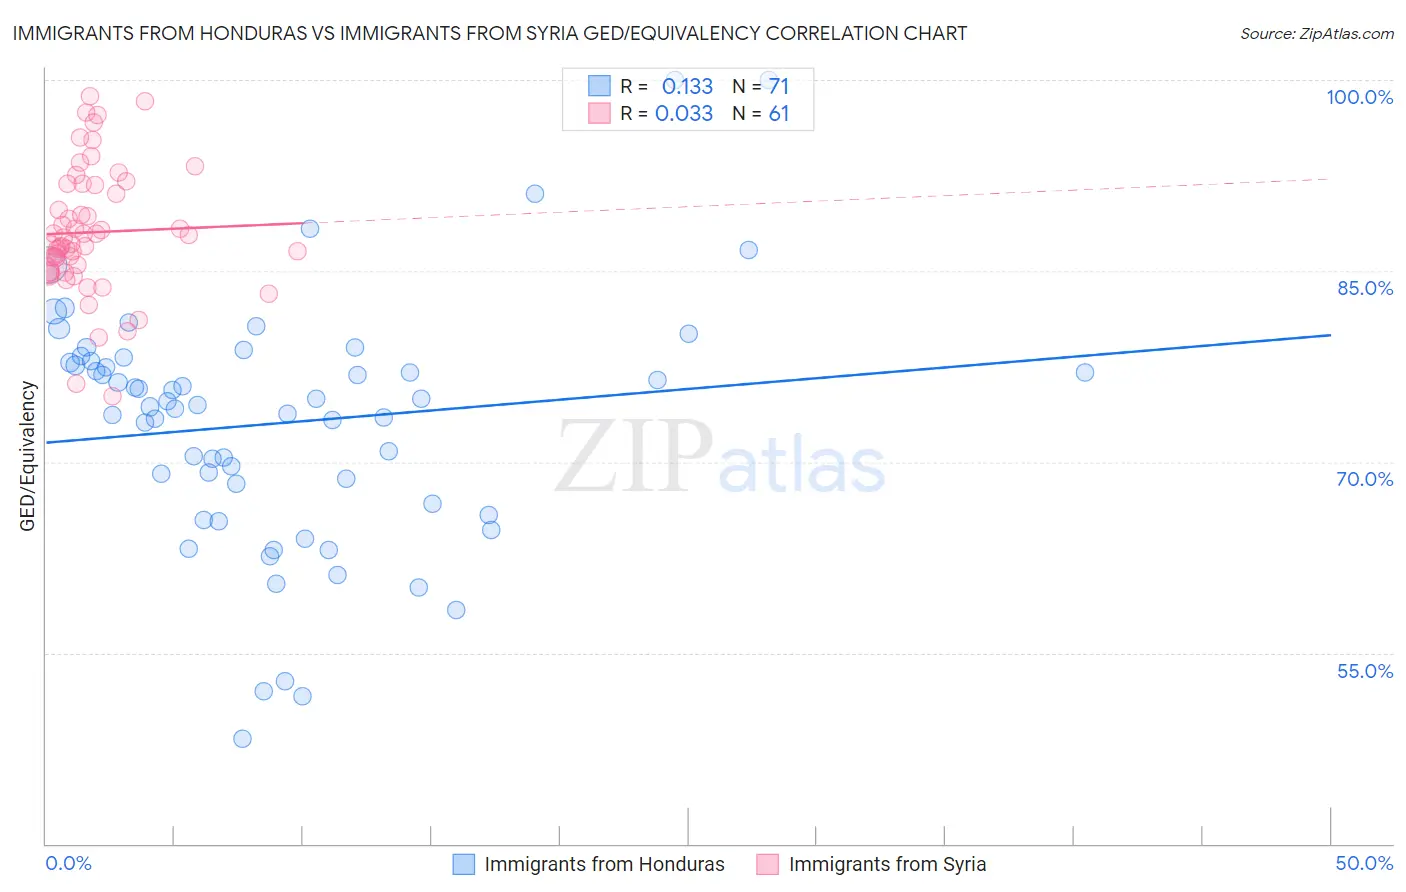
Immigrants from Honduras vs Immigrants from Syria GED/Equivalency Correlation Chart
The statistical analysis conducted on geographies consisting of 322,637,196 people shows a poor positive correlation between the proportion of Immigrants from Honduras and percentage of population with at least ged/equivalency education in the United States with a correlation coefficient (R) of 0.133 and weighted average of 78.7%. Similarly, the statistical analysis conducted on geographies consisting of 174,108,882 people shows no correlation between the proportion of Immigrants from Syria and percentage of population with at least ged/equivalency education in the United States with a correlation coefficient (R) of 0.033 and weighted average of 86.1%, a difference of 9.4%.
GED/Equivalency Correlation Summary
| Measurement | Immigrants from Honduras | Immigrants from Syria |
| Minimum | 48.2% | 75.1% |
| Maximum | 100.0% | 98.7% |
| Range | 51.8% | 23.5% |
| Mean | 73.0% | 88.0% |
| Median | 74.5% | 87.1% |
| Interquartile 25% (IQ1) | 66.7% | 85.0% |
| Interquartile 75% (IQ3) | 78.0% | 91.8% |
| Interquartile Range (IQR) | 11.2% | 6.7% |
| Standard Deviation (Sample) | 9.7% | 5.0% |
| Standard Deviation (Population) | 9.7% | 4.9% |
Similar Demographics by GED/Equivalency
Demographics Similar to Immigrants from Honduras by GED/Equivalency
In terms of ged/equivalency, the demographic groups most similar to Immigrants from Honduras are Immigrants from the Azores (78.7%, a difference of 0.11%), Salvadoran (78.6%, a difference of 0.22%), Immigrants from Cabo Verde (78.9%, a difference of 0.24%), Guatemalan (78.5%, a difference of 0.31%), and Immigrants from Latin America (78.5%, a difference of 0.33%).
| Demographics | Rating | Rank | GED/Equivalency |
| Mexican American Indians | 0.0 /100 | #324 | Tragic 79.4% |
| Hondurans | 0.0 /100 | #325 | Tragic 79.3% |
| Yuman | 0.0 /100 | #326 | Tragic 79.2% |
| Central Americans | 0.0 /100 | #327 | Tragic 79.2% |
| Hispanics or Latinos | 0.0 /100 | #328 | Tragic 79.1% |
| Dominicans | 0.0 /100 | #329 | Tragic 79.1% |
| Immigrants | Cabo Verde | 0.0 /100 | #330 | Tragic 78.9% |
| Immigrants | Honduras | 0.0 /100 | #331 | Tragic 78.7% |
| Immigrants | Azores | 0.0 /100 | #332 | Tragic 78.7% |
| Salvadorans | 0.0 /100 | #333 | Tragic 78.6% |
| Guatemalans | 0.0 /100 | #334 | Tragic 78.5% |
| Immigrants | Latin America | 0.0 /100 | #335 | Tragic 78.5% |
| Immigrants | Dominican Republic | 0.0 /100 | #336 | Tragic 78.0% |
| Immigrants | Yemen | 0.0 /100 | #337 | Tragic 77.9% |
| Immigrants | Guatemala | 0.0 /100 | #338 | Tragic 77.9% |
Demographics Similar to Immigrants from Syria by GED/Equivalency
In terms of ged/equivalency, the demographic groups most similar to Immigrants from Syria are Immigrants from Morocco (86.1%, a difference of 0.010%), Immigrants from Iraq (86.1%, a difference of 0.030%), Immigrants from Kenya (86.2%, a difference of 0.060%), White/Caucasian (86.2%, a difference of 0.070%), and German Russian (86.2%, a difference of 0.070%).
| Demographics | Rating | Rank | GED/Equivalency |
| Armenians | 76.4 /100 | #154 | Good 86.3% |
| Iraqis | 75.2 /100 | #155 | Good 86.2% |
| Immigrants | Nepal | 73.3 /100 | #156 | Good 86.2% |
| Whites/Caucasians | 72.2 /100 | #157 | Good 86.2% |
| German Russians | 72.1 /100 | #158 | Good 86.2% |
| Immigrants | Kenya | 71.8 /100 | #159 | Good 86.2% |
| Immigrants | Morocco | 69.5 /100 | #160 | Good 86.1% |
| Immigrants | Syria | 69.3 /100 | #161 | Good 86.1% |
| Immigrants | Iraq | 68.1 /100 | #162 | Good 86.1% |
| Ugandans | 66.3 /100 | #163 | Good 86.1% |
| Venezuelans | 65.5 /100 | #164 | Good 86.0% |
| Alsatians | 64.3 /100 | #165 | Good 86.0% |
| Immigrants | Albania | 64.2 /100 | #166 | Good 86.0% |
| Ethiopians | 63.7 /100 | #167 | Good 86.0% |
| Sierra Leoneans | 61.8 /100 | #168 | Good 86.0% |