Anvik, AK Map & Demographics
Anvik Map
Anvik Overview
$23,576
PER CAPITA INCOME
$61,042
AVG FAMILY INCOME
$58,750
AVG HOUSEHOLD INCOME
74.0%
WAGE / INCOME GAP [ % ]
26.0¢/ $1
WAGE / INCOME GAP [ $ ]
0.30
INEQUALITY / GINI INDEX
74
TOTAL POPULATION
38
MALE POPULATION
36
FEMALE POPULATION
105.56
MALES / 100 FEMALES
94.74
FEMALES / 100 MALES
24.5
MEDIAN AGE
2.7
AVG FAMILY SIZE
2.5
AVG HOUSEHOLD SIZE
39
LABOR FORCE [ PEOPLE ]
67.2%
PERCENT IN LABOR FORCE
12.8%
UNEMPLOYMENT RATE
Anvik Zip Codes
Anvik Area Codes
Income in Anvik
Income Overview in Anvik
Per Capita Income in Anvik is $23,576, while median incomes of families and households are $61,042 and $58,750 respectively.
| Characteristic | Number | Measure |
| Per Capita Income | 74 | $23,576 |
| Median Family Income | 19 | $61,042 |
| Mean Family Income | 19 | $58,705 |
| Median Household Income | 30 | $58,750 |
| Mean Household Income | 30 | $57,057 |
| Income Deficit | 19 | $0 |
| Wage / Income Gap (%) | 74 | 74.02% |
| Wage / Income Gap ($) | 74 | 25.98¢ per $1 |
| Gini / Inequality Index | 74 | 0.30 |
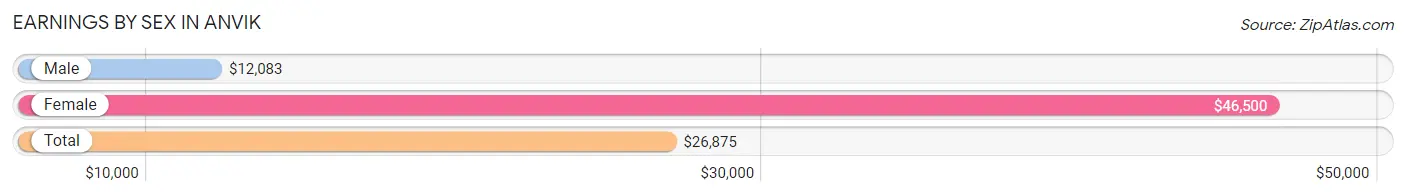
Earnings by Sex in Anvik
Average Earnings in Anvik are $26,875, $12,083 for men and $46,500 for women, a difference of 74.0%.
| Sex | Number | Average Earnings |
| Male | 20 (47.6%) | $12,083 |
| Female | 22 (52.4%) | $46,500 |
| Total | 42 (100.0%) | $26,875 |
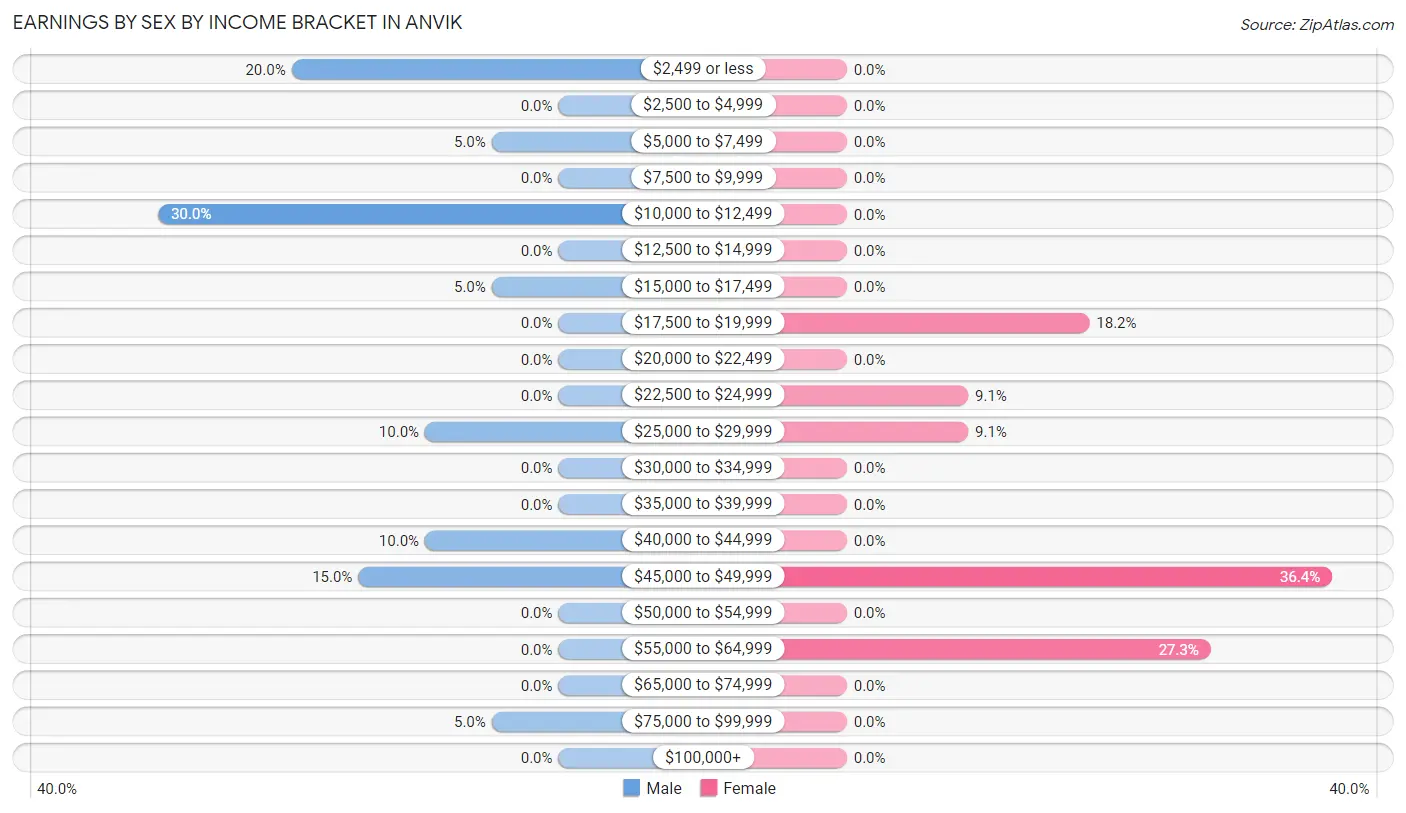
Earnings by Sex by Income Bracket in Anvik
The most common earnings brackets in Anvik are $10,000 to $12,499 for men (6 | 30.0%) and $45,000 to $49,999 for women (8 | 36.4%).
| Income | Male | Female |
| $2,499 or less | 4 (20.0%) | 0 (0.0%) |
| $2,500 to $4,999 | 0 (0.0%) | 0 (0.0%) |
| $5,000 to $7,499 | 1 (5.0%) | 0 (0.0%) |
| $7,500 to $9,999 | 0 (0.0%) | 0 (0.0%) |
| $10,000 to $12,499 | 6 (30.0%) | 0 (0.0%) |
| $12,500 to $14,999 | 0 (0.0%) | 0 (0.0%) |
| $15,000 to $17,499 | 1 (5.0%) | 0 (0.0%) |
| $17,500 to $19,999 | 0 (0.0%) | 4 (18.2%) |
| $20,000 to $22,499 | 0 (0.0%) | 0 (0.0%) |
| $22,500 to $24,999 | 0 (0.0%) | 2 (9.1%) |
| $25,000 to $29,999 | 2 (10.0%) | 2 (9.1%) |
| $30,000 to $34,999 | 0 (0.0%) | 0 (0.0%) |
| $35,000 to $39,999 | 0 (0.0%) | 0 (0.0%) |
| $40,000 to $44,999 | 2 (10.0%) | 0 (0.0%) |
| $45,000 to $49,999 | 3 (15.0%) | 8 (36.4%) |
| $50,000 to $54,999 | 0 (0.0%) | 0 (0.0%) |
| $55,000 to $64,999 | 0 (0.0%) | 6 (27.3%) |
| $65,000 to $74,999 | 0 (0.0%) | 0 (0.0%) |
| $75,000 to $99,999 | 1 (5.0%) | 0 (0.0%) |
| $100,000+ | 0 (0.0%) | 0 (0.0%) |
| Total | 20 (100.0%) | 22 (100.0%) |
Earnings by Sex by Educational Attainment in Anvik
| Educational Attainment | Male Income | Female Income |
| Less than High School | - | - |
| High School Diploma | - | - |
| College or Associate's Degree | - | - |
| Bachelor's Degree | - | - |
| Graduate Degree | - | - |
| Total | - | - |
Family Income in Anvik
Family Income Brackets in Anvik
According to the Anvik family income data, there are 10 families falling into the $50,000 to $74,999 income range, which is the most common income bracket and makes up 52.6% of all families.
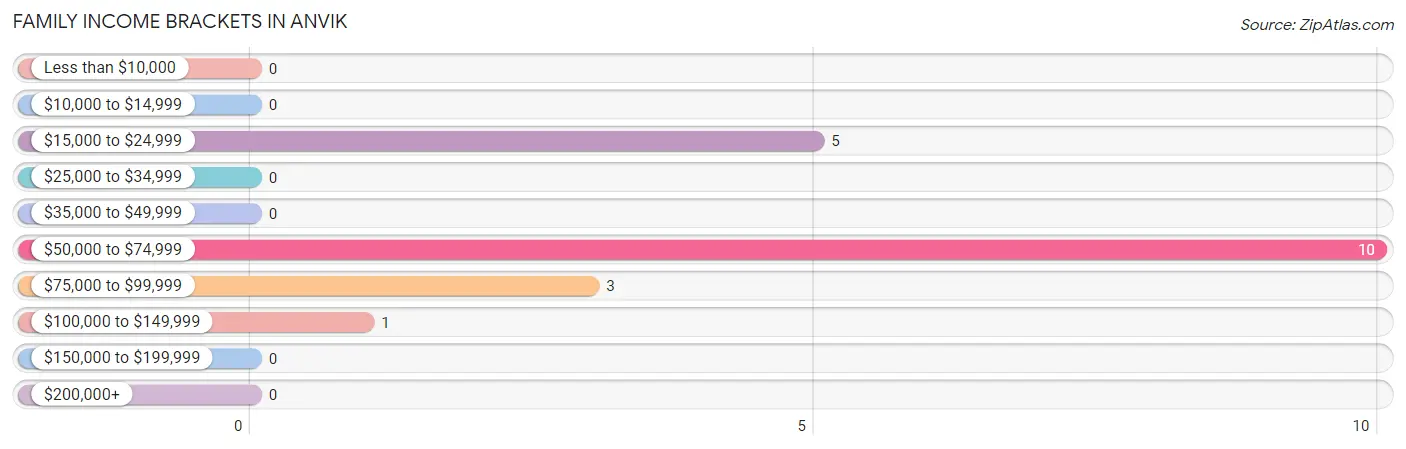
| Income Bracket | # Families | % Families |
| Less than $10,000 | 0 | 0.0% |
| $10,000 to $14,999 | 0 | 0.0% |
| $15,000 to $24,999 | 5 | 26.3% |
| $25,000 to $34,999 | 0 | 0.0% |
| $35,000 to $49,999 | 0 | 0.0% |
| $50,000 to $74,999 | 10 | 52.6% |
| $75,000 to $99,999 | 3 | 15.8% |
| $100,000 to $149,999 | 1 | 5.3% |
| $150,000 to $199,999 | 0 | 0.0% |
| $200,000+ | 0 | 0.0% |
Family Income by Famaliy Size in Anvik
| Income Bracket | # Families | Median Income |
| 2-Person Families | 8 (42.1%) | $0 |
| 3-Person Families | 1 (5.3%) | $0 |
| 4-Person Families | 10 (52.6%) | $0 |
| 5-Person Families | 0 (0.0%) | $0 |
| 6-Person Families | 0 (0.0%) | $0 |
| 7+ Person Families | 0 (0.0%) | $0 |
| Total | 19 (100.0%) | $61,042 |
Family Income by Number of Earners in Anvik
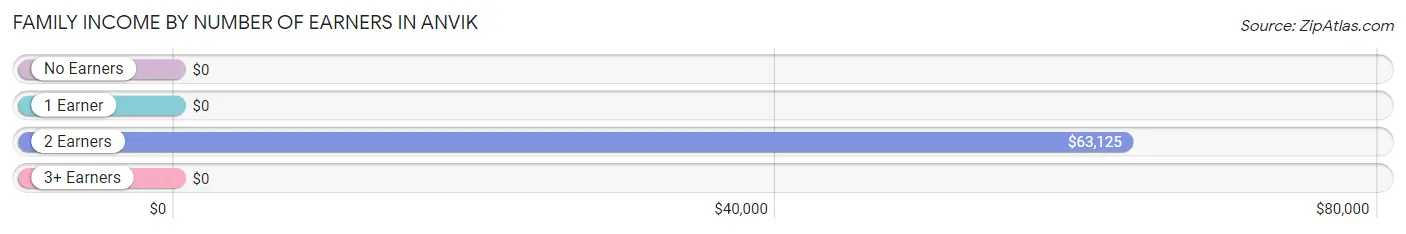
| Number of Earners | # Families | Median Income |
| No Earners | 5 (26.3%) | $0 |
| 1 Earner | 6 (31.6%) | $0 |
| 2 Earners | 5 (26.3%) | $63,125 |
| 3+ Earners | 3 (15.8%) | $0 |
| Total | 19 (100.0%) | $61,042 |
Household Income in Anvik
Household Income Brackets in Anvik
With 13 households falling in the category, the $50,000 to $74,999 income range is the most frequent in Anvik, accounting for 43.3% of all households.
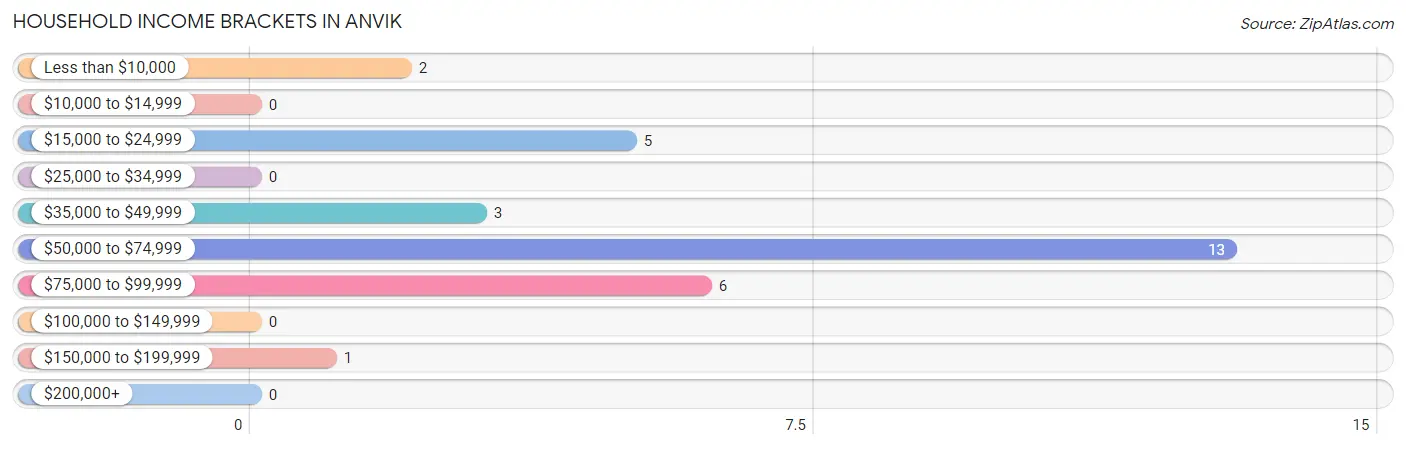
| Income Bracket | # Households | % Households |
| Less than $10,000 | 2 | 6.7% |
| $10,000 to $14,999 | 0 | 0.0% |
| $15,000 to $24,999 | 5 | 16.7% |
| $25,000 to $34,999 | 0 | 0.0% |
| $35,000 to $49,999 | 3 | 10.0% |
| $50,000 to $74,999 | 13 | 43.3% |
| $75,000 to $99,999 | 6 | 20.0% |
| $100,000 to $149,999 | 0 | 0.0% |
| $150,000 to $199,999 | 1 | 3.3% |
| $200,000+ | 0 | 0.0% |
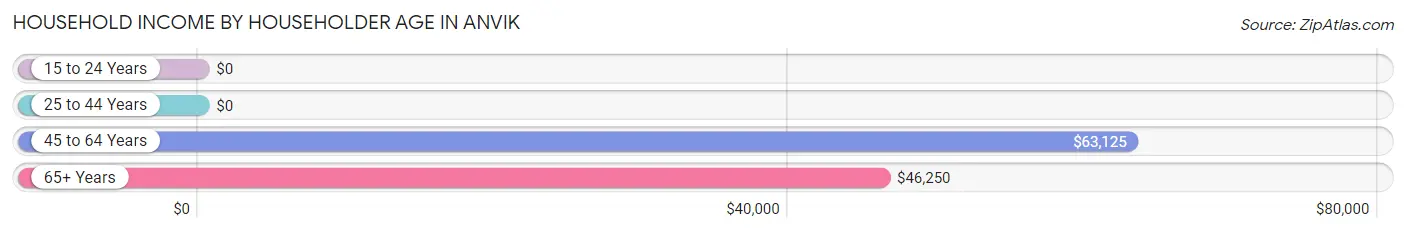
Household Income by Householder Age in Anvik
The median household income in Anvik is $58,750, with the highest median household income of $63,125 found in the 45 to 64 years age bracket for the primary householder. A total of 11 households (36.7%) fall into this category. Meanwhile, the 15 to 24 years age bracket for the primary householder has the lowest median household income of $0, with 9 households (30.0%) in this group.
| Income Bracket | # Households | Median Income |
| 15 to 24 Years | 9 (30.0%) | $0 |
| 25 to 44 Years | 2 (6.7%) | $0 |
| 45 to 64 Years | 11 (36.7%) | $63,125 |
| 65+ Years | 8 (26.7%) | $46,250 |
| Total | 30 (100.0%) | $58,750 |
Poverty in Anvik
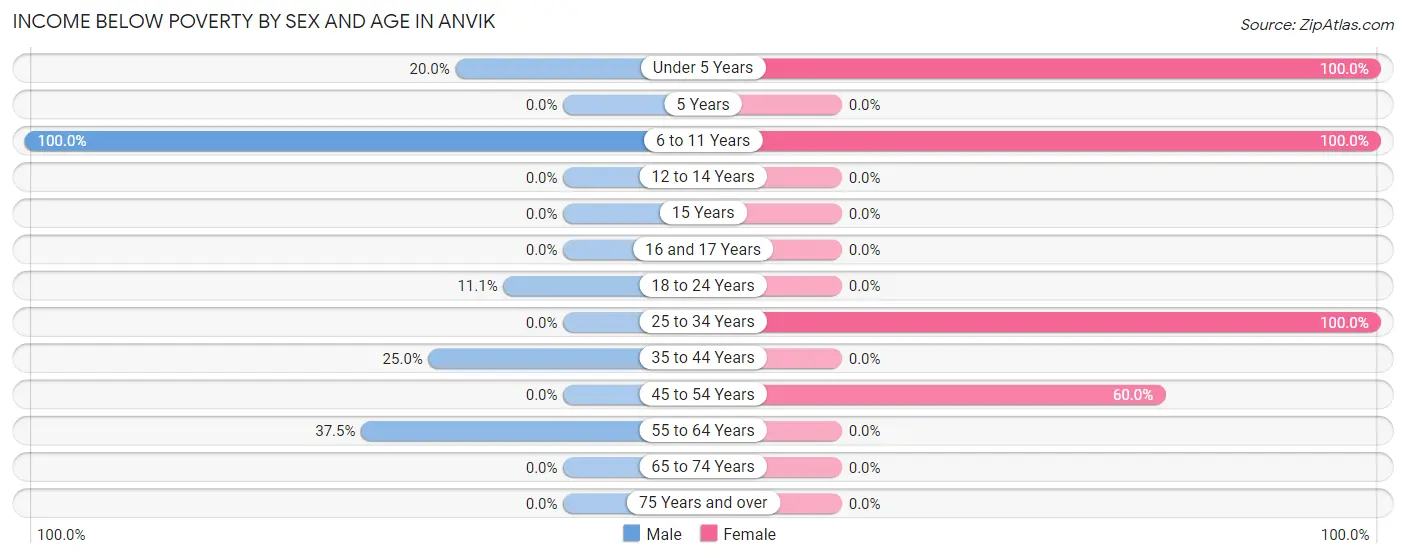
Income Below Poverty by Sex and Age in Anvik
With 23.7% poverty level for males and 30.6% for females among the residents of Anvik, 6 to 11 year old males and under 5 year old females are the most vulnerable to poverty, with 3 males (100.0%) and 3 females (100.0%) in their respective age groups living below the poverty level.
| Age Bracket | Male | Female |
| Under 5 Years | 1 (20.0%) | 3 (100.0%) |
| 5 Years | 0 (0.0%) | 0 (0.0%) |
| 6 to 11 Years | 3 (100.0%) | 3 (100.0%) |
| 12 to 14 Years | 0 (0.0%) | 0 (0.0%) |
| 15 Years | 0 (0.0%) | 0 (0.0%) |
| 16 and 17 Years | 0 (0.0%) | 0 (0.0%) |
| 18 to 24 Years | 1 (11.1%) | 0 (0.0%) |
| 25 to 34 Years | 0 (0.0%) | 2 (100.0%) |
| 35 to 44 Years | 1 (25.0%) | 0 (0.0%) |
| 45 to 54 Years | 0 (0.0%) | 3 (60.0%) |
| 55 to 64 Years | 3 (37.5%) | 0 (0.0%) |
| 65 to 74 Years | 0 (0.0%) | 0 (0.0%) |
| 75 Years and over | 0 (0.0%) | 0 (0.0%) |
| Total | 9 (23.7%) | 11 (30.6%) |
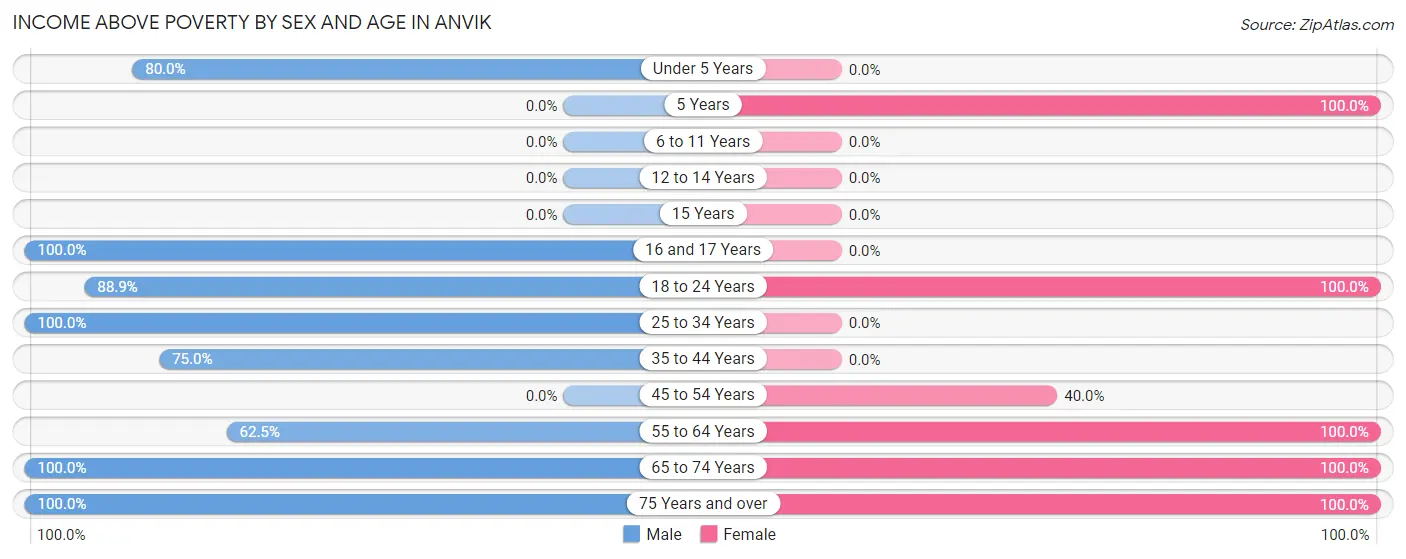
Income Above Poverty by Sex and Age in Anvik
According to the poverty statistics in Anvik, males aged 16 and 17 years and females aged 5 years are the age groups that are most secure financially, with 100.0% of males and 100.0% of females in these age groups living above the poverty line.
| Age Bracket | Male | Female |
| Under 5 Years | 4 (80.0%) | 0 (0.0%) |
| 5 Years | 0 (0.0%) | 2 (100.0%) |
| 6 to 11 Years | 0 (0.0%) | 0 (0.0%) |
| 12 to 14 Years | 0 (0.0%) | 0 (0.0%) |
| 15 Years | 0 (0.0%) | 0 (0.0%) |
| 16 and 17 Years | 1 (100.0%) | 0 (0.0%) |
| 18 to 24 Years | 8 (88.9%) | 15 (100.0%) |
| 25 to 34 Years | 2 (100.0%) | 0 (0.0%) |
| 35 to 44 Years | 3 (75.0%) | 0 (0.0%) |
| 45 to 54 Years | 0 (0.0%) | 2 (40.0%) |
| 55 to 64 Years | 5 (62.5%) | 3 (100.0%) |
| 65 to 74 Years | 2 (100.0%) | 1 (100.0%) |
| 75 Years and over | 4 (100.0%) | 2 (100.0%) |
| Total | 29 (76.3%) | 25 (69.4%) |
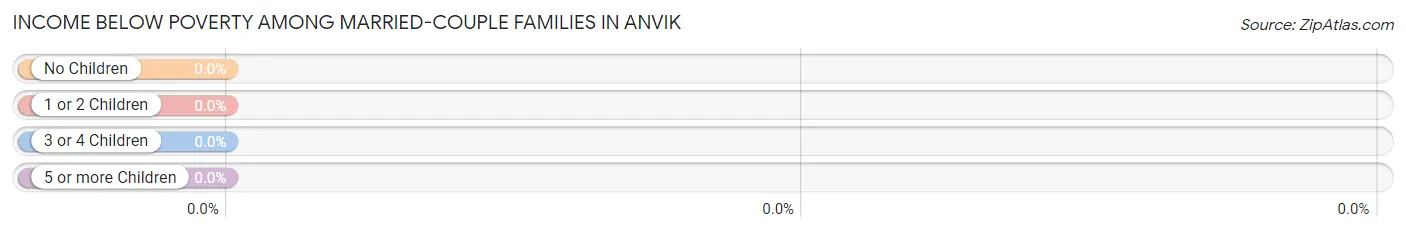
Income Below Poverty Among Married-Couple Families in Anvik
| Children | Above Poverty | Below Poverty |
| No Children | 2 (100.0%) | 0 (0.0%) |
| 1 or 2 Children | 2 (100.0%) | 0 (0.0%) |
| 3 or 4 Children | 0 (0.0%) | 0 (0.0%) |
| 5 or more Children | 0 (0.0%) | 0 (0.0%) |
| Total | 4 (100.0%) | 0 (0.0%) |
Income Below Poverty Among Single-Parent Households in Anvik
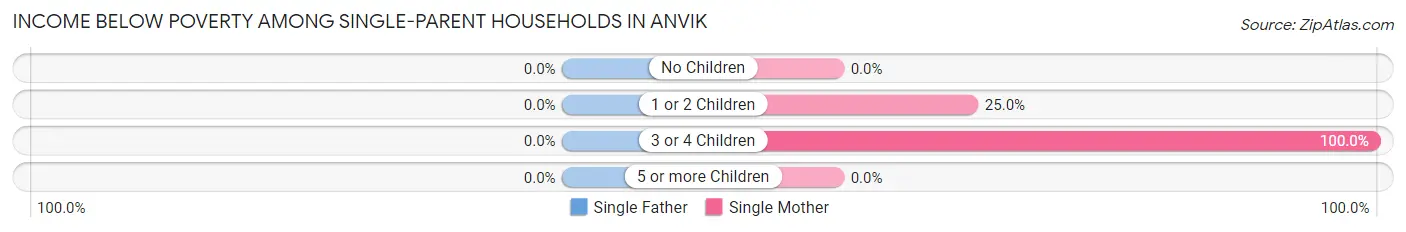
| Children | Single Father | Single Mother |
| No Children | 0 (0.0%) | 0 (0.0%) |
| 1 or 2 Children | 0 (0.0%) | 3 (25.0%) |
| 3 or 4 Children | 0 (0.0%) | 2 (100.0%) |
| 5 or more Children | 0 (0.0%) | 0 (0.0%) |
| Total | 0 (0.0%) | 5 (35.7%) |
Income Below Poverty Among Married-Couple vs Single-Parent Households in Anvik
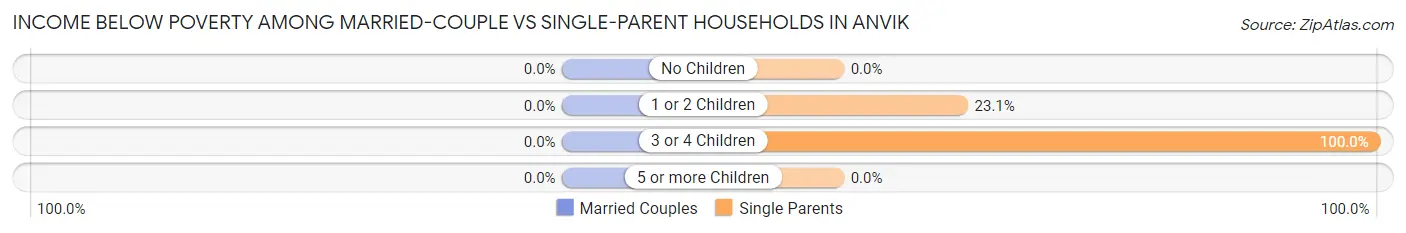
| Children | Married-Couple Families | Single-Parent Households |
| No Children | 0 (0.0%) | 0 (0.0%) |
| 1 or 2 Children | 0 (0.0%) | 3 (23.1%) |
| 3 or 4 Children | 0 (0.0%) | 2 (100.0%) |
| 5 or more Children | 0 (0.0%) | 0 (0.0%) |
| Total | 0 (0.0%) | 5 (33.3%) |
Race in Anvik
The most populous races in Anvik are Native / Alaskan (73 | 98.7%), and White / Caucasian (1 | 1.3%).
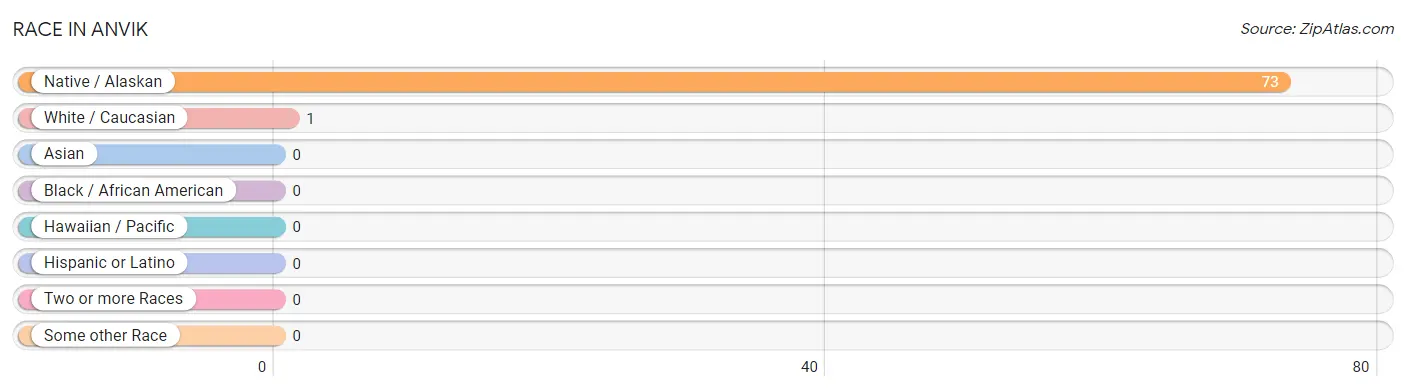
| Race | # Population | % Population |
| Asian | 0 | 0.0% |
| Black / African American | 0 | 0.0% |
| Hawaiian / Pacific | 0 | 0.0% |
| Hispanic or Latino | 0 | 0.0% |
| Native / Alaskan | 73 | 98.7% |
| White / Caucasian | 1 | 1.3% |
| Two or more Races | 0 | 0.0% |
| Some other Race | 0 | 0.0% |
| Total | 74 | 100.0% |
Ancestry in Anvik
The most populous ancestries reported in Anvik are Alaskan Athabascan (69 | 93.2%), Inupiat (3 | 4.1%), and Aleut (1 | 1.3%), together accounting for 98.6% of all Anvik residents.
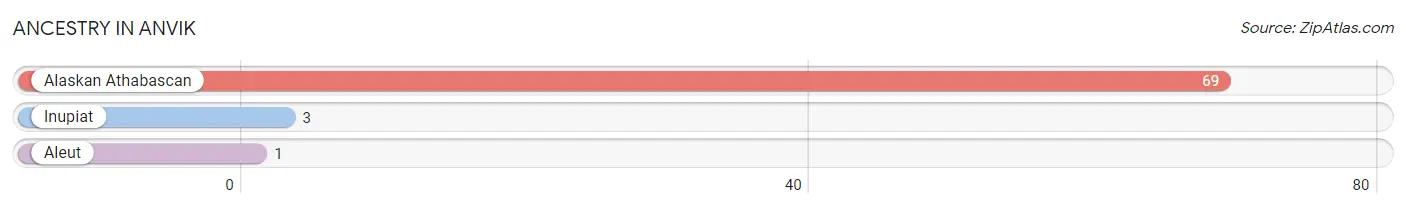
| Ancestry | # Population | % Population |
| Alaskan Athabascan | 69 | 93.2% |
| Aleut | 1 | 1.3% |
| Inupiat | 3 | 4.1% | View All 3 Rows |
Immigrants in Anvik

| Immigration Origin | # Population | % Population | View All 0 Rows |
Sex and Age in Anvik
Sex and Age in Anvik
The most populous age groups in Anvik are Under 5 Years (5 | 13.2%) for men and 20 to 24 Years (11 | 30.6%) for women.
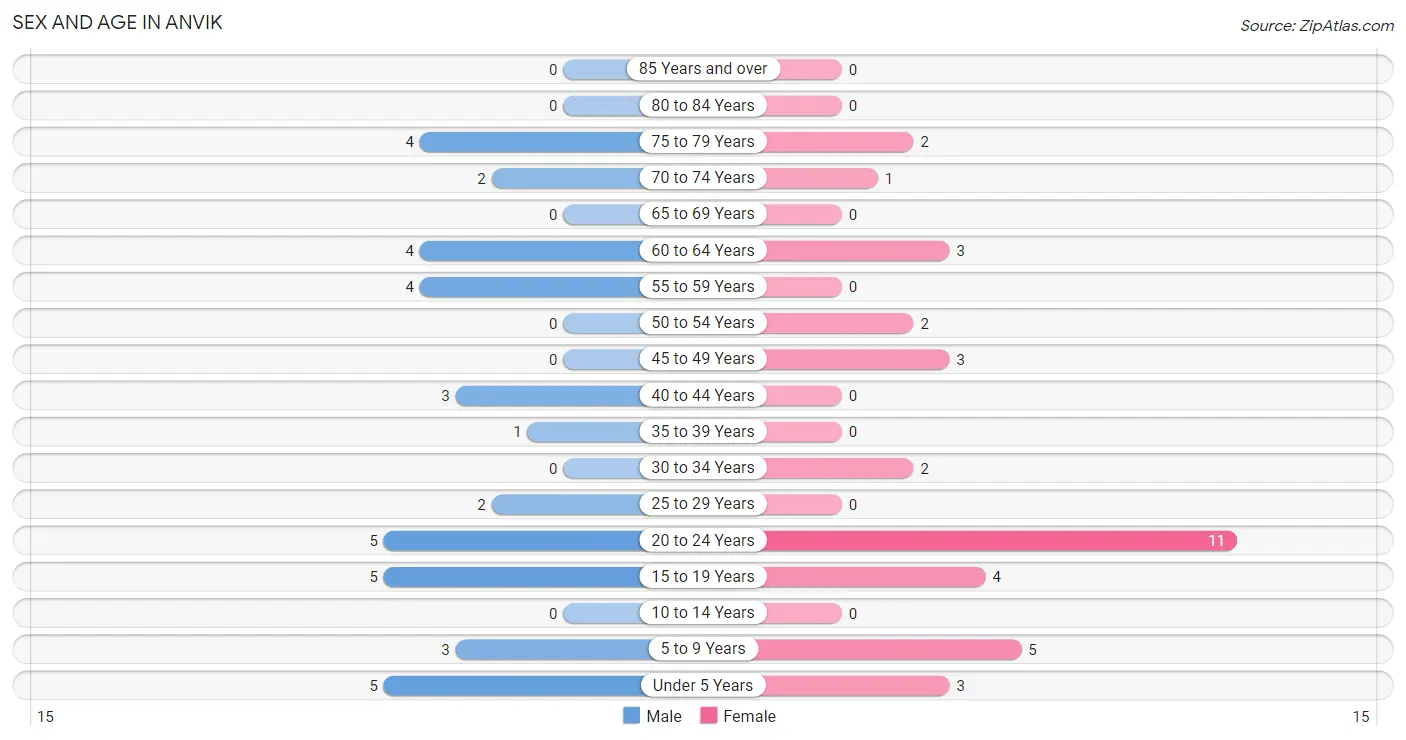
| Age Bracket | Male | Female |
| Under 5 Years | 5 (13.2%) | 3 (8.3%) |
| 5 to 9 Years | 3 (7.9%) | 5 (13.9%) |
| 10 to 14 Years | 0 (0.0%) | 0 (0.0%) |
| 15 to 19 Years | 5 (13.2%) | 4 (11.1%) |
| 20 to 24 Years | 5 (13.2%) | 11 (30.6%) |
| 25 to 29 Years | 2 (5.3%) | 0 (0.0%) |
| 30 to 34 Years | 0 (0.0%) | 2 (5.6%) |
| 35 to 39 Years | 1 (2.6%) | 0 (0.0%) |
| 40 to 44 Years | 3 (7.9%) | 0 (0.0%) |
| 45 to 49 Years | 0 (0.0%) | 3 (8.3%) |
| 50 to 54 Years | 0 (0.0%) | 2 (5.6%) |
| 55 to 59 Years | 4 (10.5%) | 0 (0.0%) |
| 60 to 64 Years | 4 (10.5%) | 3 (8.3%) |
| 65 to 69 Years | 0 (0.0%) | 0 (0.0%) |
| 70 to 74 Years | 2 (5.3%) | 1 (2.8%) |
| 75 to 79 Years | 4 (10.5%) | 2 (5.6%) |
| 80 to 84 Years | 0 (0.0%) | 0 (0.0%) |
| 85 Years and over | 0 (0.0%) | 0 (0.0%) |
| Total | 38 (100.0%) | 36 (100.0%) |
Families and Households in Anvik
Median Family Size in Anvik
The median family size in Anvik is 2.74 persons per family, with single male/father families (1 | 5.3%) accounting for the largest median family size of 5 persons per family. On the other hand, single female/mother families (14 | 73.7%) represent the smallest median family size with 2.50 persons per family.
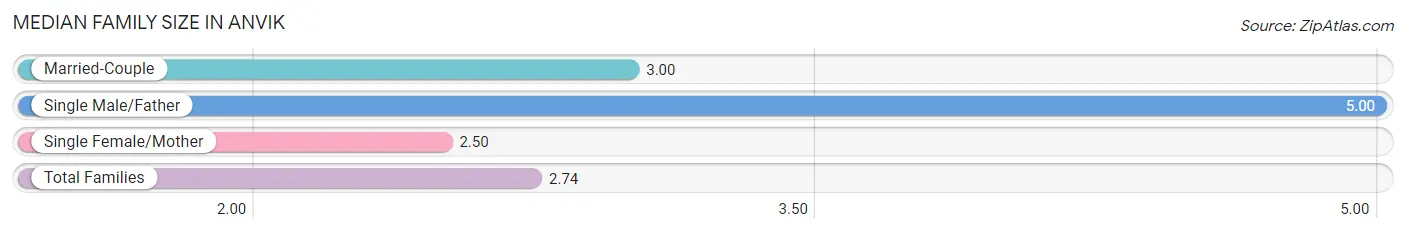
| Family Type | # Families | Family Size |
| Married-Couple | 4 (21.0%) | 3.00 |
| Single Male/Father | 1 (5.3%) | 5.00 |
| Single Female/Mother | 14 (73.7%) | 2.50 |
| Total Families | 19 (100.0%) | 2.74 |
Median Household Size in Anvik
The median household size in Anvik is 2.47 persons per household, with single male/father households (1 | 3.3%) accounting for the largest median household size of 7 persons per household. non-family households (11 | 36.7%) represent the smallest median household size with 1.09 persons per household.
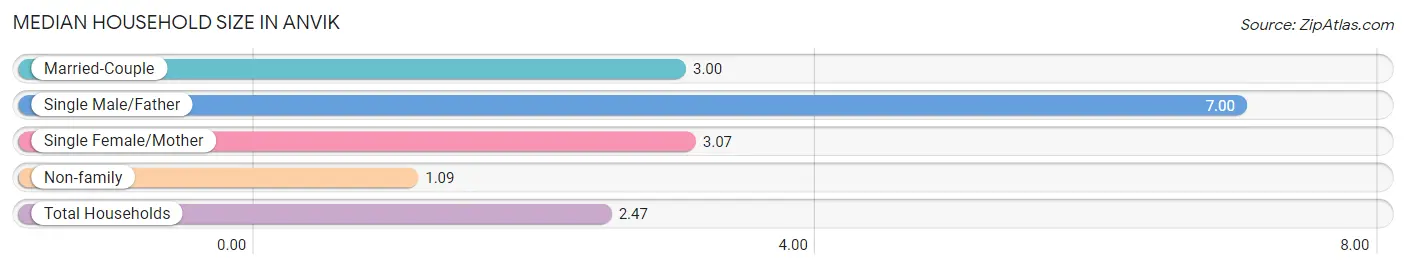
| Household Type | # Households | Household Size |
| Married-Couple | 4 (13.3%) | 3.00 |
| Single Male/Father | 1 (3.3%) | 7.00 |
| Single Female/Mother | 14 (46.7%) | 3.07 |
| Non-family | 11 (36.7%) | 1.09 |
| Total Households | 30 (100.0%) | 2.47 |
Household Size by Marriage Status in Anvik
Out of a total of 30 households in Anvik, 19 (63.3%) are family households, while 11 (36.7%) are nonfamily households. The most numerous type of family households are 2-person households, comprising 8, and the most common type of nonfamily households are 1-person households, comprising 8.
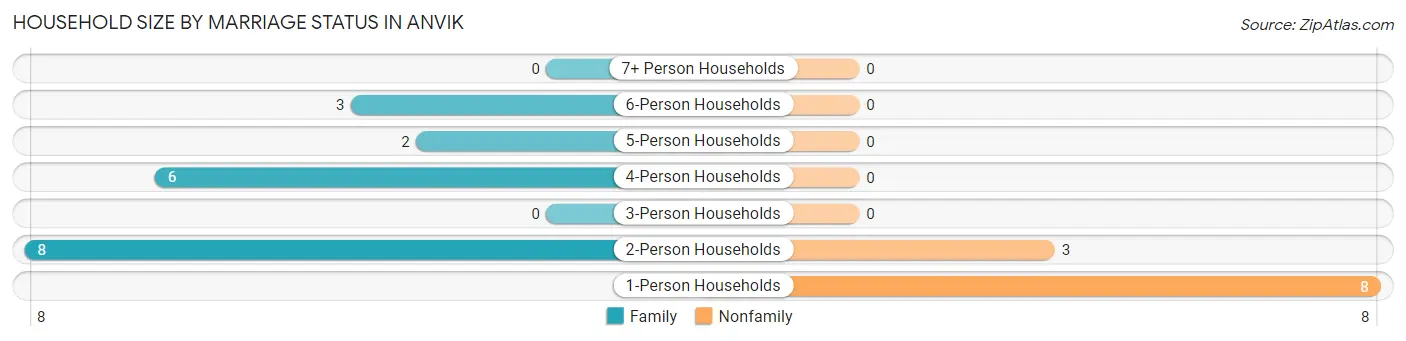
| Household Size | Family Households | Nonfamily Households |
| 1-Person Households | - | 8 (26.7%) |
| 2-Person Households | 8 (26.7%) | 3 (10.0%) |
| 3-Person Households | 0 (0.0%) | 0 (0.0%) |
| 4-Person Households | 6 (20.0%) | 0 (0.0%) |
| 5-Person Households | 2 (6.7%) | 0 (0.0%) |
| 6-Person Households | 3 (10.0%) | 0 (0.0%) |
| 7+ Person Households | 0 (0.0%) | 0 (0.0%) |
| Total | 19 (63.3%) | 11 (36.7%) |
Female Fertility in Anvik
Fertility by Age in Anvik
| Age Bracket | Women with Births | Births / 1,000 Women |
| 15 to 19 years | 0 (0.0%) | 0.0 |
| 20 to 34 years | 0 (0.0%) | 0.0 |
| 35 to 50 years | 0 (0.0%) | 0.0 |
| Total | 0 (0.0%) | 0.0 |
Fertility by Age by Marriage Status in Anvik
| Age Bracket | Married | Unmarried |
| 15 to 19 years | 0 (0.0%) | 0 (0.0%) |
| 20 to 34 years | 0 (0.0%) | 0 (0.0%) |
| 35 to 50 years | 0 (0.0%) | 0 (0.0%) |
| Total | 0 (0.0%) | 0 (0.0%) |
Fertility by Education in Anvik
| Educational Attainment | Women with Births | Births / 1,000 Women |
| Less than High School | 0 (0.0%) | 0.0 |
| High School Diploma | 0 (0.0%) | 0.0 |
| College or Associate's Degree | 0 (0.0%) | 0.0 |
| Bachelor's Degree | 0 (0.0%) | 0.0 |
| Graduate Degree | 0 (0.0%) | 0.0 |
| Total | 0 (0.0%) | 0.0 |
Fertility by Education by Marriage Status in Anvik
| Educational Attainment | Married | Unmarried |
| Less than High School | 0 (0.0%) | 0 (0.0%) |
| High School Diploma | 0 (0.0%) | 0 (0.0%) |
| College or Associate's Degree | 0 (0.0%) | 0 (0.0%) |
| Bachelor's Degree | 0 (0.0%) | 0 (0.0%) |
| Graduate Degree | 0 (0.0%) | 0 (0.0%) |
| Total | 0 (0.0%) | 0 (0.0%) |
Employment Characteristics in Anvik
Employment by Class of Employer in Anvik
Among the 32 employed individuals in Anvik, federal government employees (12 | 37.5%), private company employees (9 | 28.1%), and local government employees (8 | 25.0%) make up the most common classes of employment.
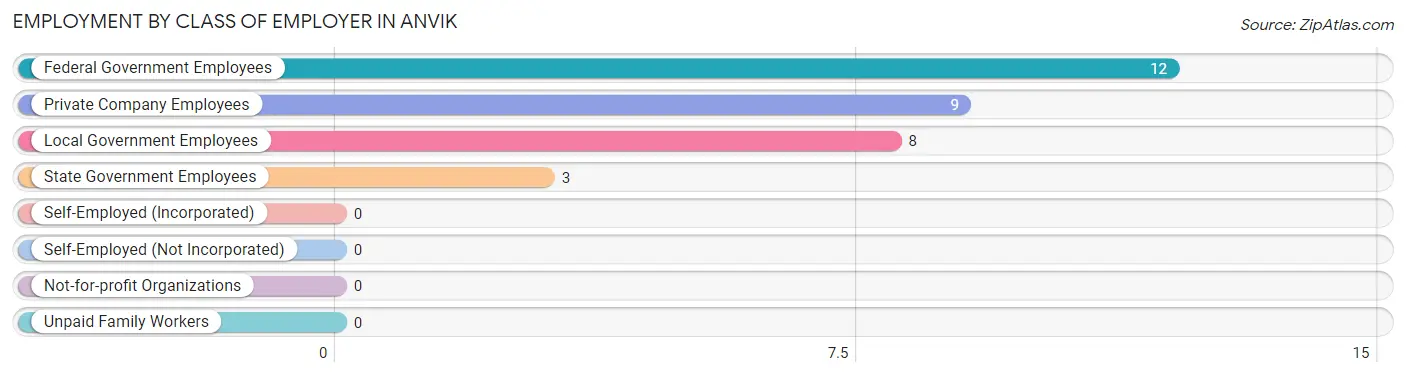
| Employer Class | # Employees | % Employees |
| Private Company Employees | 9 | 28.1% |
| Self-Employed (Incorporated) | 0 | 0.0% |
| Self-Employed (Not Incorporated) | 0 | 0.0% |
| Not-for-profit Organizations | 0 | 0.0% |
| Local Government Employees | 8 | 25.0% |
| State Government Employees | 3 | 9.4% |
| Federal Government Employees | 12 | 37.5% |
| Unpaid Family Workers | 0 | 0.0% |
| Total | 32 | 100.0% |
Employment Status by Age in Anvik
According to the labor force statistics for Anvik, out of the total population over 16 years of age (58), 67.2% or 39 individuals are in the labor force, with 12.8% or 5 of them unemployed. The age group with the highest labor force participation rate is 25 to 29 years, with 100.0% or 2 individuals in the labor force. Within the labor force, the 55 to 59 years age range has the highest percentage of unemployed individuals, with 100.0% or 4 of them being unemployed.
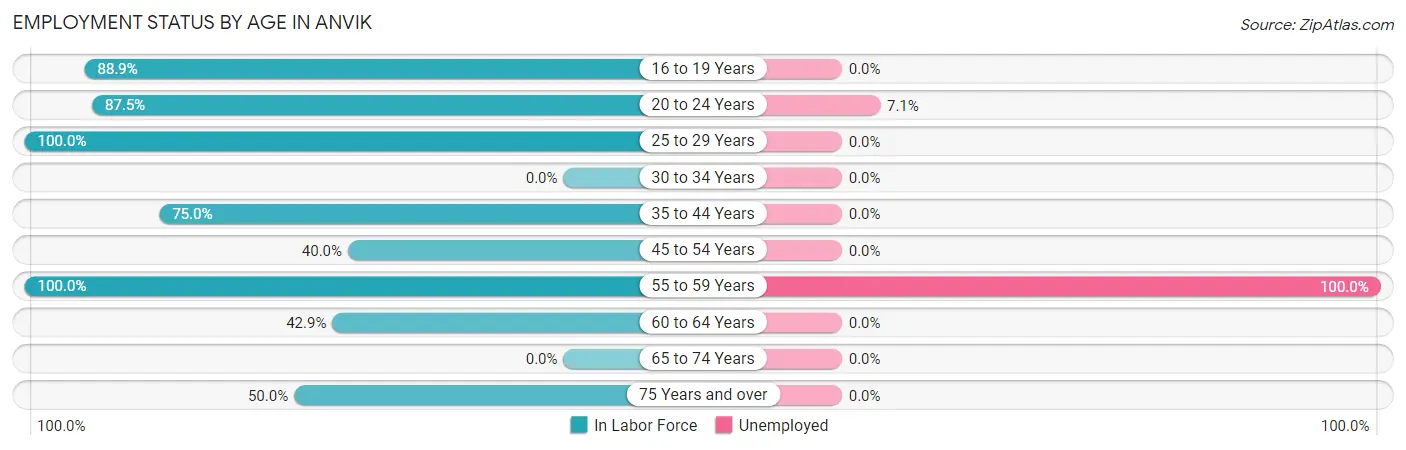
| Age Bracket | In Labor Force | Unemployed |
| 16 to 19 Years | 8 (88.9%) | 0 (0.0%) |
| 20 to 24 Years | 14 (87.5%) | 1 (7.1%) |
| 25 to 29 Years | 2 (100.0%) | 0 (0.0%) |
| 30 to 34 Years | 0 (0.0%) | 0 (0.0%) |
| 35 to 44 Years | 3 (75.0%) | 0 (0.0%) |
| 45 to 54 Years | 2 (40.0%) | 0 (0.0%) |
| 55 to 59 Years | 4 (100.0%) | 4 (100.0%) |
| 60 to 64 Years | 3 (42.9%) | 0 (0.0%) |
| 65 to 74 Years | 0 (0.0%) | 0 (0.0%) |
| 75 Years and over | 3 (50.0%) | 0 (0.0%) |
| Total | 39 (67.2%) | 5 (12.8%) |
Employment Status by Educational Attainment in Anvik
According to labor force statistics for Anvik, 58.3% of individuals (14) out of the total population between 25 and 64 years of age (24) are in the labor force, with 28.6% or 4 of them being unemployed. The group with the highest labor force participation rate are those with the educational attainment of high school diploma, with 76.9% or 10 individuals in the labor force. Within the labor force, individuals with college / associate degree education have the highest percentage of unemployment, with 100.0% or 4 of them being unemployed.
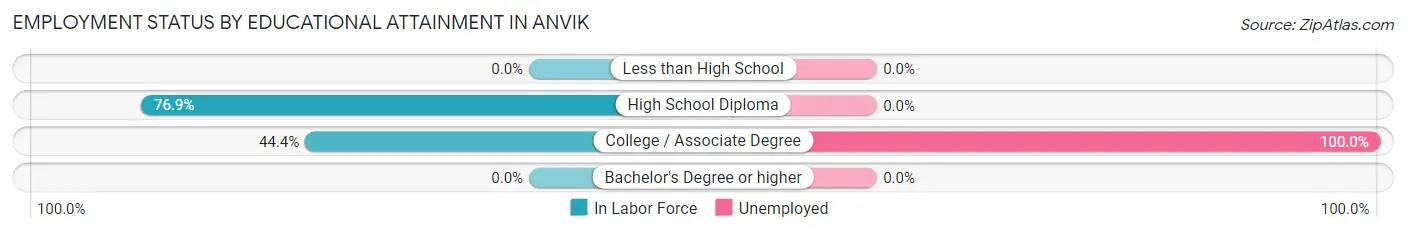
| Educational Attainment | In Labor Force | Unemployed |
| Less than High School | 0 (0.0%) | 0 (0.0%) |
| High School Diploma | 10 (76.9%) | 0 (0.0%) |
| College / Associate Degree | 4 (44.4%) | 9 (100.0%) |
| Bachelor's Degree or higher | 0 (0.0%) | 0 (0.0%) |
| Total | 14 (58.3%) | 7 (28.6%) |
Employment Occupations by Sex in Anvik
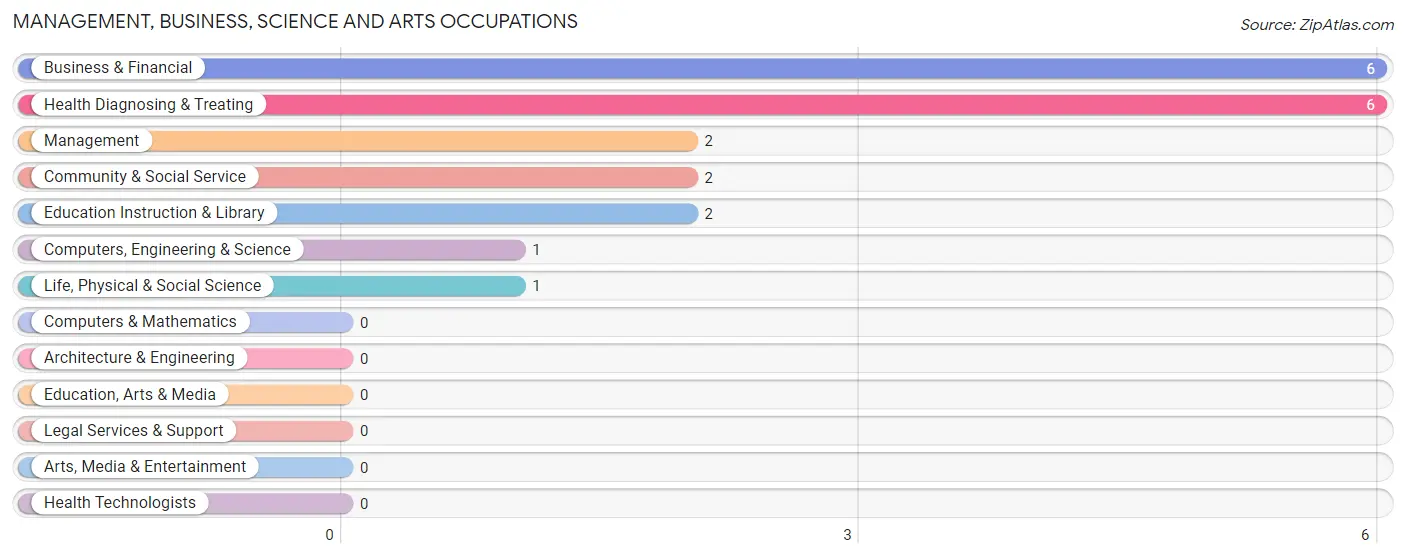
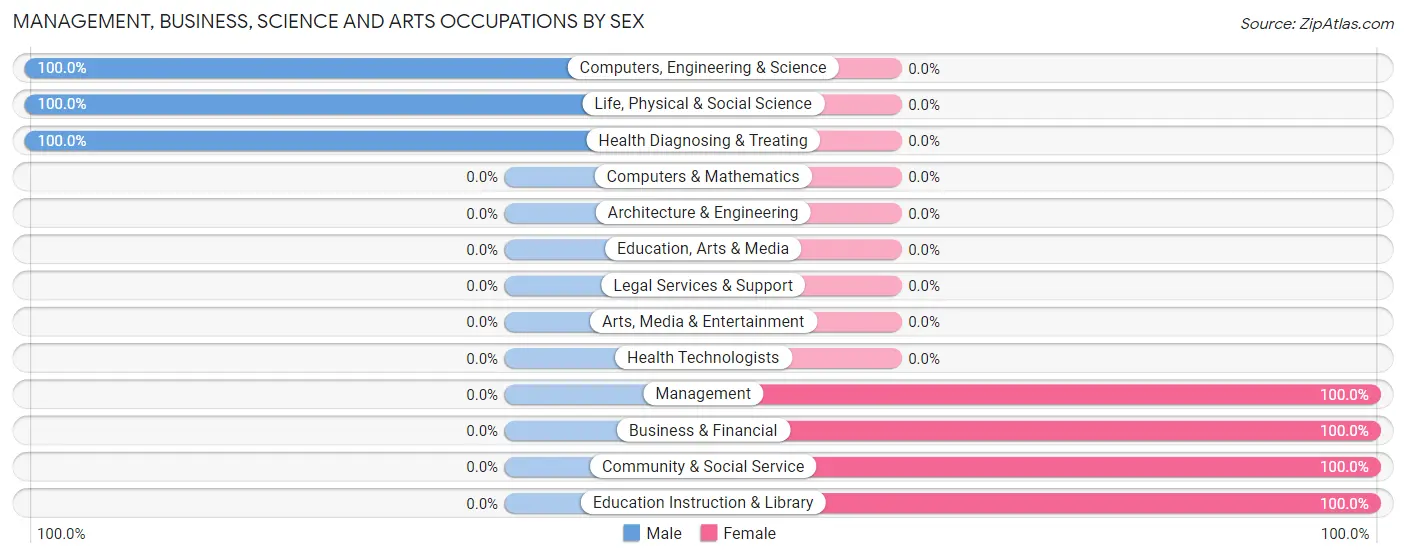
Management, Business, Science and Arts Occupations
The most common Management, Business, Science and Arts occupations in Anvik are Business & Financial (6 | 17.6%), Health Diagnosing & Treating (6 | 17.6%), Management (2 | 5.9%), Community & Social Service (2 | 5.9%), and Education Instruction & Library (2 | 5.9%).
Management, Business, Science and Arts Occupations by Sex
Within the Management, Business, Science and Arts occupations in Anvik, the most male-oriented occupations are Computers, Engineering & Science (100.0%), Life, Physical & Social Science (100.0%), and Health Diagnosing & Treating (100.0%), while the most female-oriented occupations are Management (100.0%), Business & Financial (100.0%), and Community & Social Service (100.0%).
| Occupation | Male | Female |
| Management | 0 (0.0%) | 2 (100.0%) |
| Business & Financial | 0 (0.0%) | 6 (100.0%) |
| Computers, Engineering & Science | 1 (100.0%) | 0 (0.0%) |
| Computers & Mathematics | 0 (0.0%) | 0 (0.0%) |
| Architecture & Engineering | 0 (0.0%) | 0 (0.0%) |
| Life, Physical & Social Science | 1 (100.0%) | 0 (0.0%) |
| Community & Social Service | 0 (0.0%) | 2 (100.0%) |
| Education, Arts & Media | 0 (0.0%) | 0 (0.0%) |
| Legal Services & Support | 0 (0.0%) | 0 (0.0%) |
| Education Instruction & Library | 0 (0.0%) | 2 (100.0%) |
| Arts, Media & Entertainment | 0 (0.0%) | 0 (0.0%) |
| Health Diagnosing & Treating | 6 (100.0%) | 0 (0.0%) |
| Health Technologists | 0 (0.0%) | 0 (0.0%) |
| Total (Category) | 7 (41.2%) | 10 (58.8%) |
| Total (Overall) | 12 (35.3%) | 22 (64.7%) |
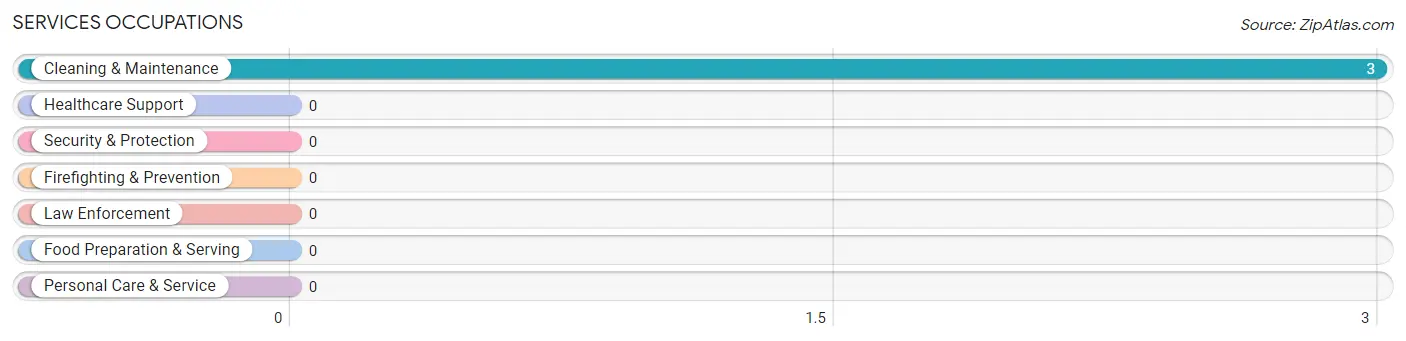
Services Occupations
The most common Services occupations in Anvik are , and Cleaning & Maintenance (3 | 8.8%).
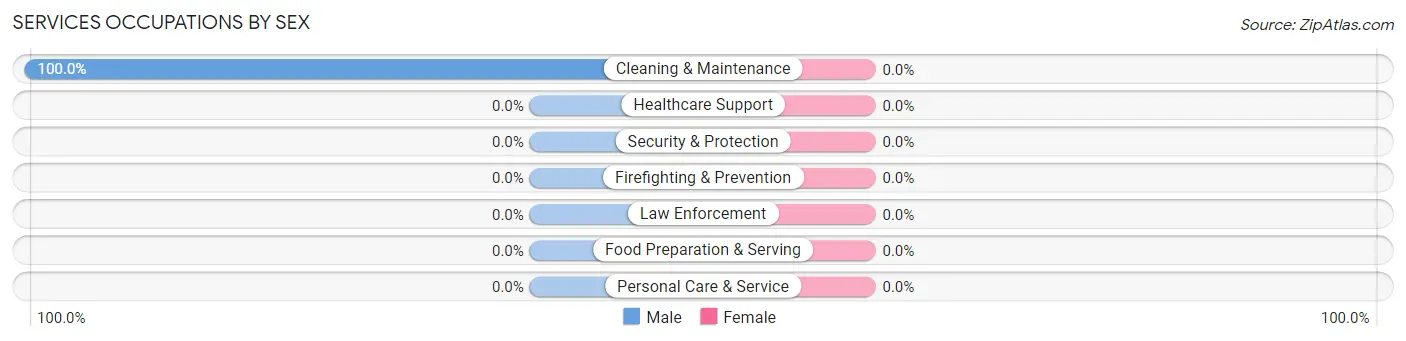
Services Occupations by Sex
| Occupation | Male | Female |
| Healthcare Support | 0 (0.0%) | 0 (0.0%) |
| Security & Protection | 0 (0.0%) | 0 (0.0%) |
| Firefighting & Prevention | 0 (0.0%) | 0 (0.0%) |
| Law Enforcement | 0 (0.0%) | 0 (0.0%) |
| Food Preparation & Serving | 0 (0.0%) | 0 (0.0%) |
| Cleaning & Maintenance | 3 (100.0%) | 0 (0.0%) |
| Personal Care & Service | 0 (0.0%) | 0 (0.0%) |
| Total (Category) | 3 (100.0%) | 0 (0.0%) |
| Total (Overall) | 12 (35.3%) | 22 (64.7%) |
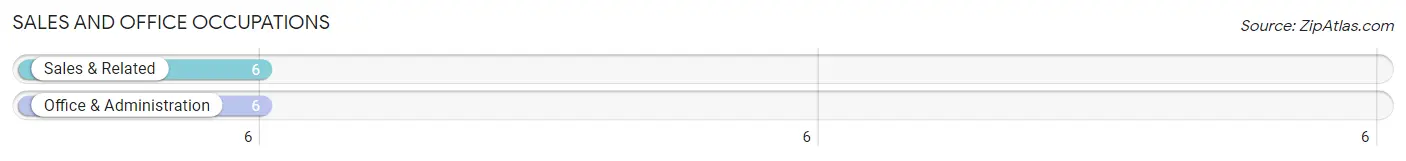
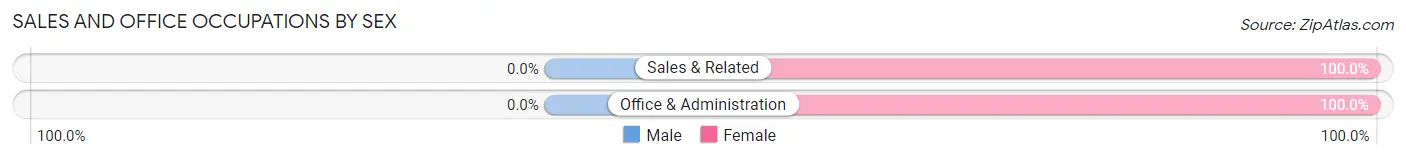
Sales and Office Occupations
The most common Sales and Office occupations in Anvik are Sales & Related (6 | 17.6%), and Office & Administration (6 | 17.6%).
Sales and Office Occupations by Sex
| Occupation | Male | Female |
| Sales & Related | 0 (0.0%) | 6 (100.0%) |
| Office & Administration | 0 (0.0%) | 6 (100.0%) |
| Total (Category) | 0 (0.0%) | 12 (100.0%) |
| Total (Overall) | 12 (35.3%) | 22 (64.7%) |
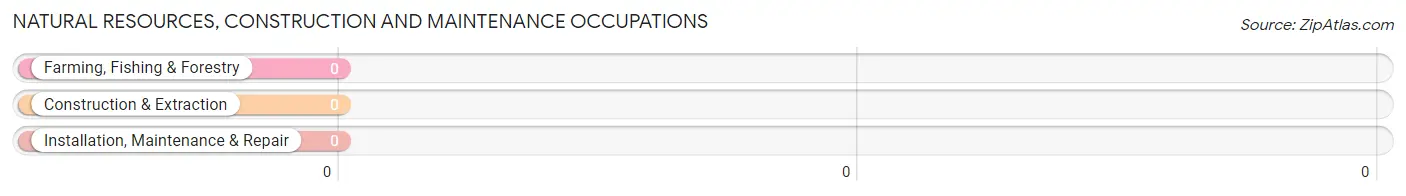
Natural Resources, Construction and Maintenance Occupations
Natural Resources, Construction and Maintenance Occupations by Sex
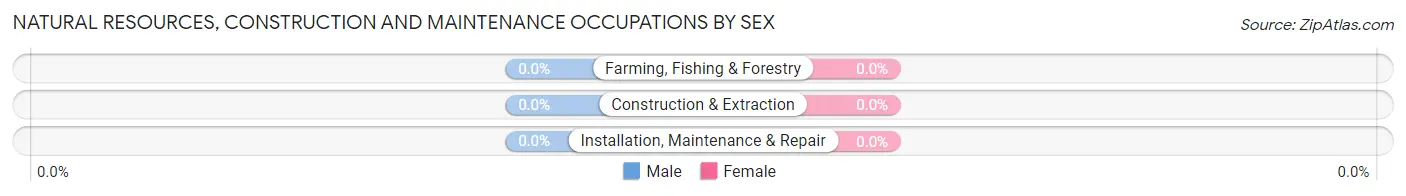
| Occupation | Male | Female |
| Farming, Fishing & Forestry | 0 (0.0%) | 0 (0.0%) |
| Construction & Extraction | 0 (0.0%) | 0 (0.0%) |
| Installation, Maintenance & Repair | 0 (0.0%) | 0 (0.0%) |
| Total (Category) | 0 (0.0%) | 0 (0.0%) |
| Total (Overall) | 12 (35.3%) | 22 (64.7%) |
Production, Transportation and Moving Occupations
The most common Production, Transportation and Moving occupations in Anvik are , and Material Moving (2 | 5.9%).
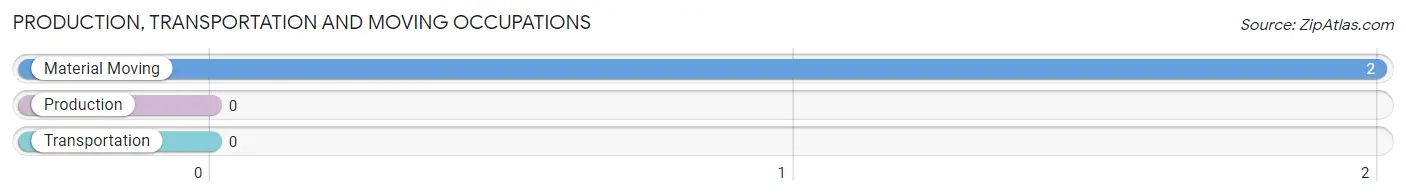
Production, Transportation and Moving Occupations by Sex
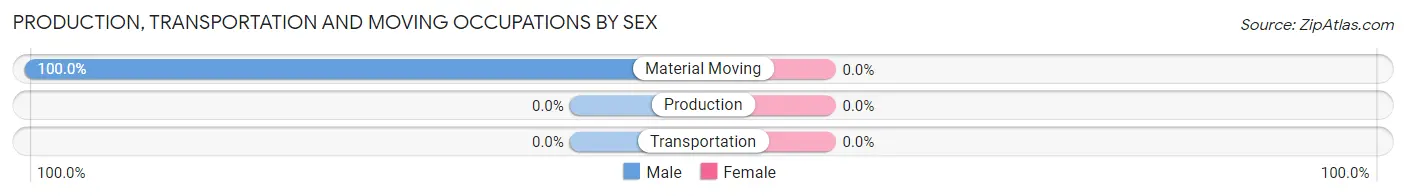
| Occupation | Male | Female |
| Production | 0 (0.0%) | 0 (0.0%) |
| Transportation | 0 (0.0%) | 0 (0.0%) |
| Material Moving | 2 (100.0%) | 0 (0.0%) |
| Total (Category) | 2 (100.0%) | 0 (0.0%) |
| Total (Overall) | 12 (35.3%) | 22 (64.7%) |
Employment Industries by Sex in Anvik
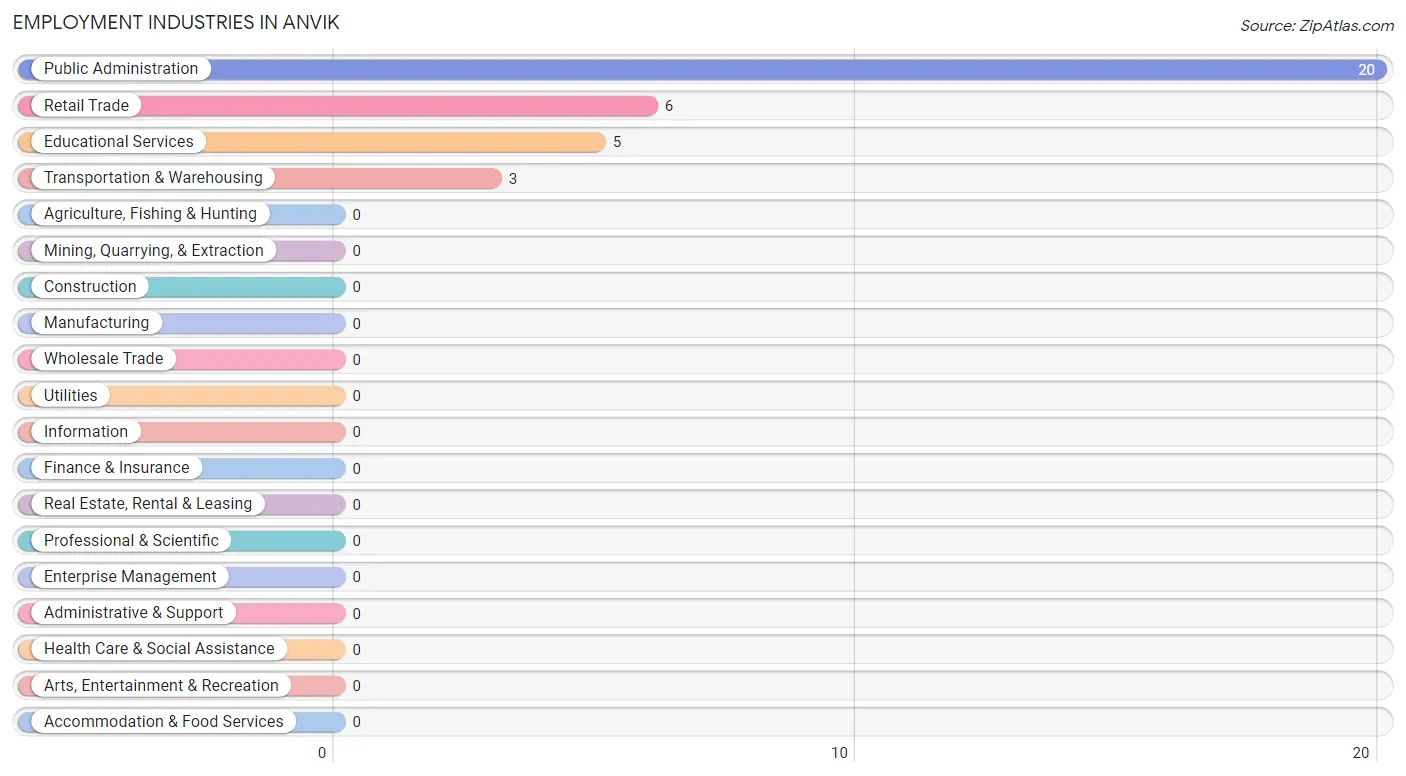
Employment Industries in Anvik
The major employment industries in Anvik include Public Administration (20 | 58.8%), Retail Trade (6 | 17.6%), Educational Services (5 | 14.7%), and Transportation & Warehousing (3 | 8.8%).
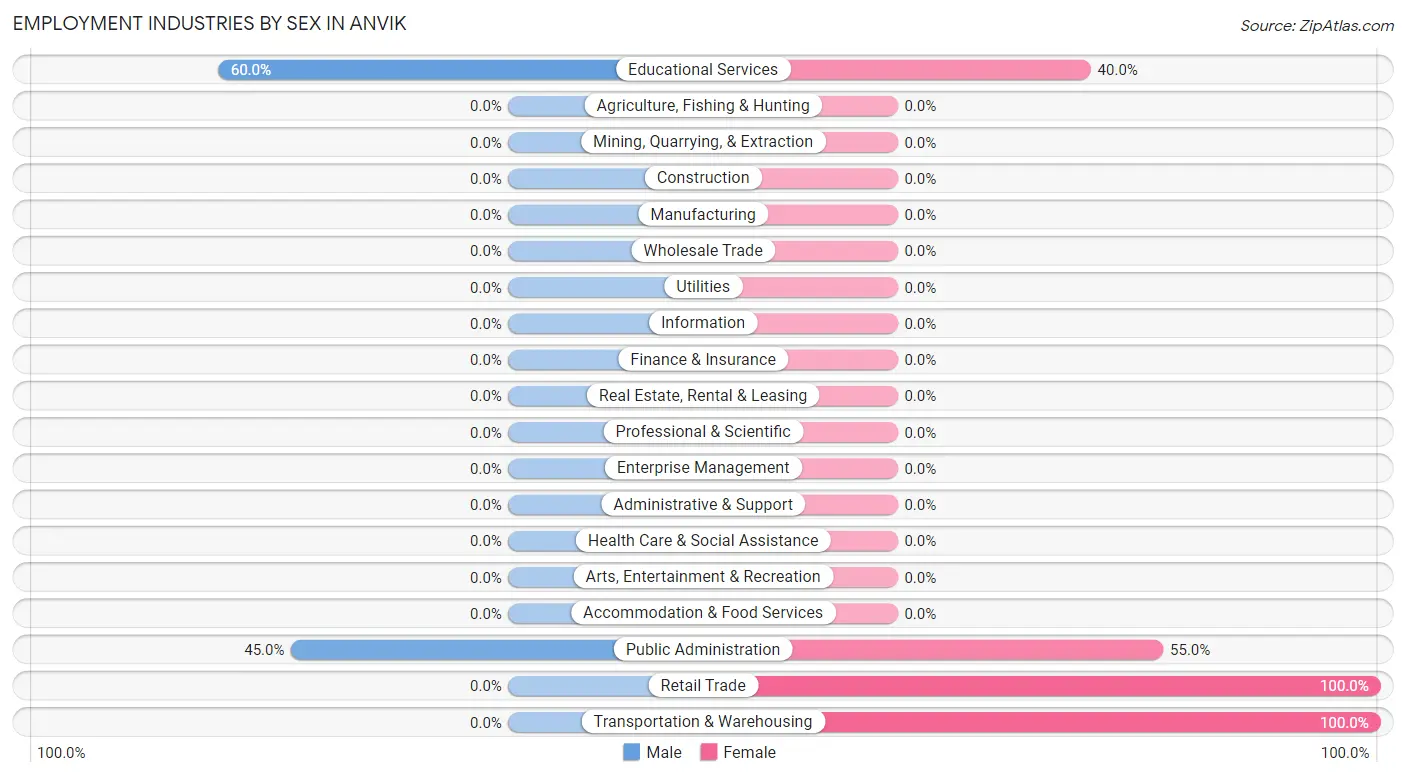
Employment Industries by Sex in Anvik
The Anvik industries that see more men than women are Educational Services (60.0%), and Public Administration (45.0%), whereas the industries that tend to have a higher number of women are Retail Trade (100.0%), Transportation & Warehousing (100.0%), and Public Administration (55.0%).
| Industry | Male | Female |
| Agriculture, Fishing & Hunting | 0 (0.0%) | 0 (0.0%) |
| Mining, Quarrying, & Extraction | 0 (0.0%) | 0 (0.0%) |
| Construction | 0 (0.0%) | 0 (0.0%) |
| Manufacturing | 0 (0.0%) | 0 (0.0%) |
| Wholesale Trade | 0 (0.0%) | 0 (0.0%) |
| Retail Trade | 0 (0.0%) | 6 (100.0%) |
| Transportation & Warehousing | 0 (0.0%) | 3 (100.0%) |
| Utilities | 0 (0.0%) | 0 (0.0%) |
| Information | 0 (0.0%) | 0 (0.0%) |
| Finance & Insurance | 0 (0.0%) | 0 (0.0%) |
| Real Estate, Rental & Leasing | 0 (0.0%) | 0 (0.0%) |
| Professional & Scientific | 0 (0.0%) | 0 (0.0%) |
| Enterprise Management | 0 (0.0%) | 0 (0.0%) |
| Administrative & Support | 0 (0.0%) | 0 (0.0%) |
| Educational Services | 3 (60.0%) | 2 (40.0%) |
| Health Care & Social Assistance | 0 (0.0%) | 0 (0.0%) |
| Arts, Entertainment & Recreation | 0 (0.0%) | 0 (0.0%) |
| Accommodation & Food Services | 0 (0.0%) | 0 (0.0%) |
| Public Administration | 9 (45.0%) | 11 (55.0%) |
| Total | 12 (35.3%) | 22 (64.7%) |
Education in Anvik
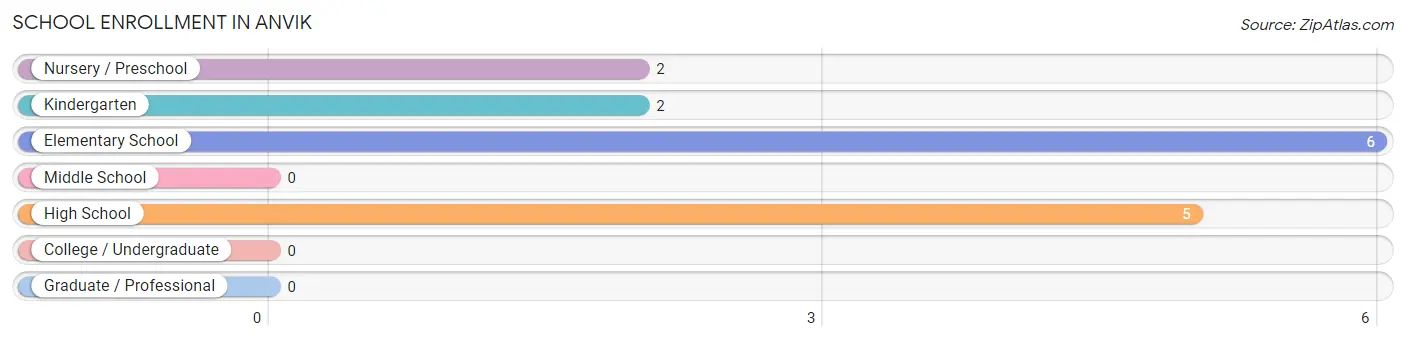
School Enrollment in Anvik
The most common levels of schooling among the 15 students in Anvik are elementary school (6 | 40.0%), high school (5 | 33.3%), and nursery / preschool (2 | 13.3%).
| School Level | # Students | % Students |
| Nursery / Preschool | 2 | 13.3% |
| Kindergarten | 2 | 13.3% |
| Elementary School | 6 | 40.0% |
| Middle School | 0 | 0.0% |
| High School | 5 | 33.3% |
| College / Undergraduate | 0 | 0.0% |
| Graduate / Professional | 0 | 0.0% |
| Total | 15 | 100.0% |
School Enrollment by Age by Funding Source in Anvik
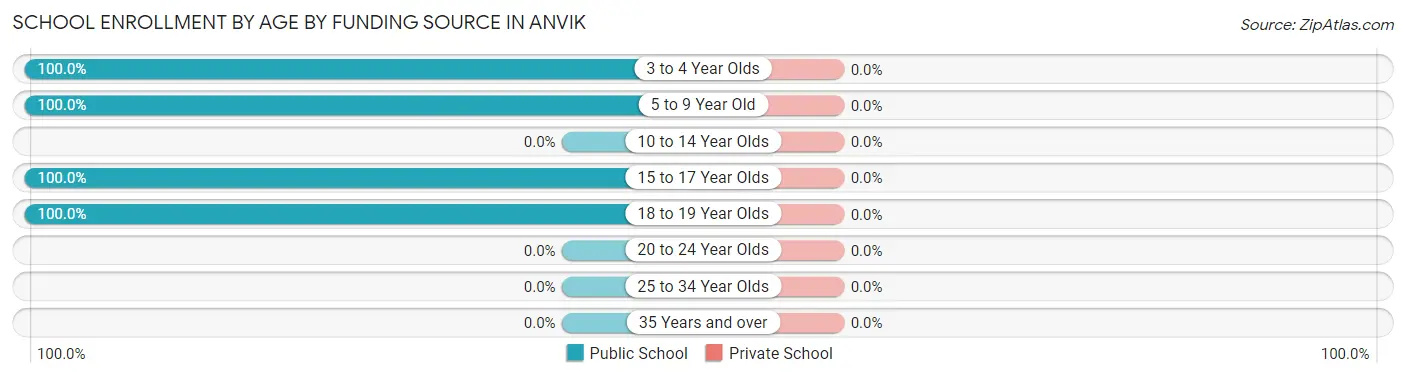
| Age Bracket | Public School | Private School |
| 3 to 4 Year Olds | 2 (100.0%) | 0 (0.0%) |
| 5 to 9 Year Old | 8 (100.0%) | 0 (0.0%) |
| 10 to 14 Year Olds | 0 (0.0%) | 0 (0.0%) |
| 15 to 17 Year Olds | 1 (100.0%) | 0 (0.0%) |
| 18 to 19 Year Olds | 4 (100.0%) | 0 (0.0%) |
| 20 to 24 Year Olds | 0 (0.0%) | 0 (0.0%) |
| 25 to 34 Year Olds | 0 (0.0%) | 0 (0.0%) |
| 35 Years and over | 0 (0.0%) | 0 (0.0%) |
| Total | 15 (100.0%) | 0 (0.0%) |
Educational Attainment by Field of Study in Anvik
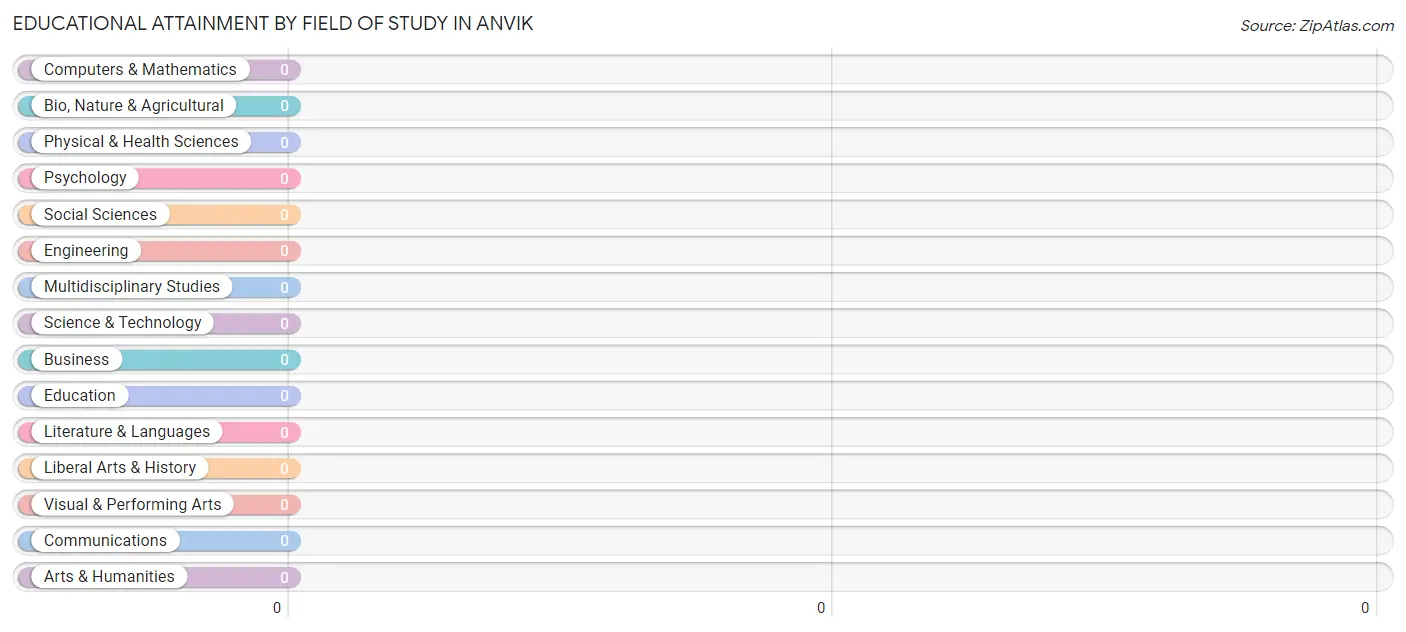
| Field of Study | # Graduates | % Graduates |
| Computers & Mathematics | 0 | 0.0% |
| Bio, Nature & Agricultural | 0 | 0.0% |
| Physical & Health Sciences | 0 | 0.0% |
| Psychology | 0 | 0.0% |
| Social Sciences | 0 | 0.0% |
| Engineering | 0 | 0.0% |
| Multidisciplinary Studies | 0 | 0.0% |
| Science & Technology | 0 | 0.0% |
| Business | 0 | 0.0% |
| Education | 0 | 0.0% |
| Literature & Languages | 0 | 0.0% |
| Liberal Arts & History | 0 | 0.0% |
| Visual & Performing Arts | 0 | 0.0% |
| Communications | 0 | 0.0% |
| Arts & Humanities | 0 | 0.0% |
| Total | 0 | 0.0% |
Transportation & Commute in Anvik
Vehicle Availability by Sex in Anvik
The most prevalent vehicle ownership categories in Anvik are males with no vehicle (9, accounting for 75.0%) and females with no vehicle (16, making up 45.0%).
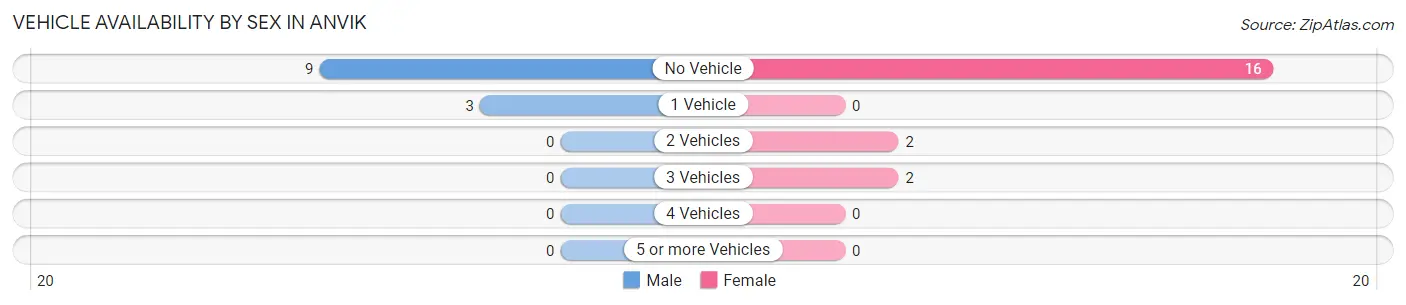
| Vehicles Available | Male | Female |
| No Vehicle | 9 (75.0%) | 16 (80.0%) |
| 1 Vehicle | 3 (25.0%) | 0 (0.0%) |
| 2 Vehicles | 0 (0.0%) | 2 (10.0%) |
| 3 Vehicles | 0 (0.0%) | 2 (10.0%) |
| 4 Vehicles | 0 (0.0%) | 0 (0.0%) |
| 5 or more Vehicles | 0 (0.0%) | 0 (0.0%) |
| Total | 12 (100.0%) | 20 (100.0%) |
Commute Time in Anvik
The most frequently occuring commute durations in Anvik are less than 5 minutes (29 commuters, 90.6%), 30 to 34 minutes (3 commuters, 9.4%), and 5 to 9 minutes (0 commuters, 0.0%).
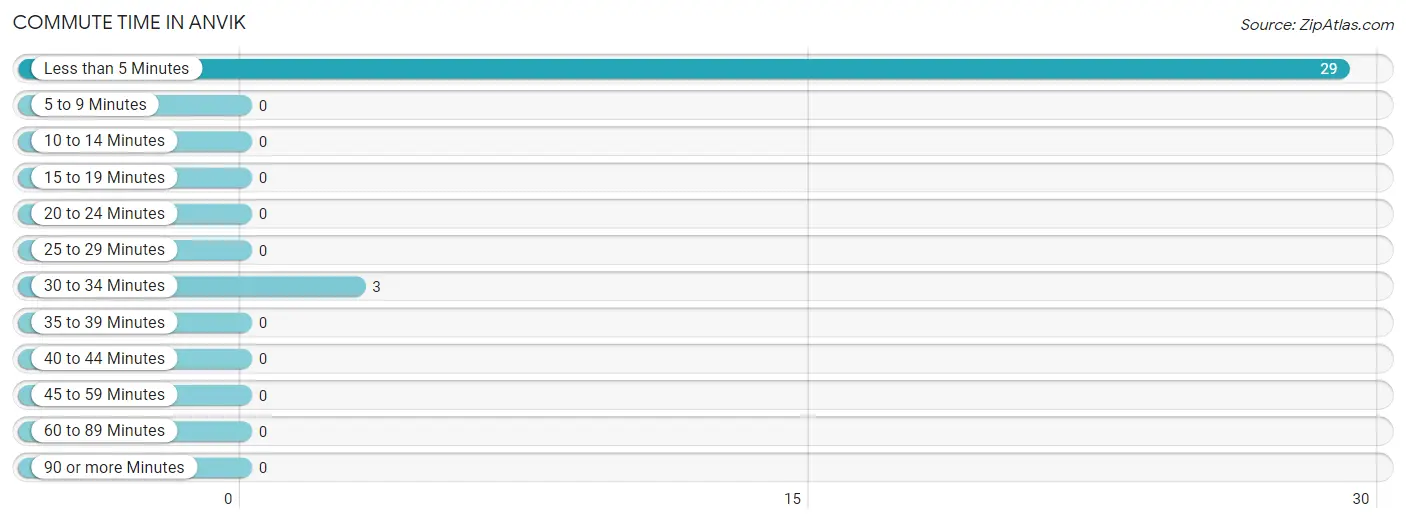
| Commute Time | # Commuters | % Commuters |
| Less than 5 Minutes | 29 | 90.6% |
| 5 to 9 Minutes | 0 | 0.0% |
| 10 to 14 Minutes | 0 | 0.0% |
| 15 to 19 Minutes | 0 | 0.0% |
| 20 to 24 Minutes | 0 | 0.0% |
| 25 to 29 Minutes | 0 | 0.0% |
| 30 to 34 Minutes | 3 | 9.4% |
| 35 to 39 Minutes | 0 | 0.0% |
| 40 to 44 Minutes | 0 | 0.0% |
| 45 to 59 Minutes | 0 | 0.0% |
| 60 to 89 Minutes | 0 | 0.0% |
| 90 or more Minutes | 0 | 0.0% |
Commute Time by Sex in Anvik
The most common commute times in Anvik are less than 5 minutes (12 commuters, 100.0%) for males and less than 5 minutes (17 commuters, 85.0%) for females.
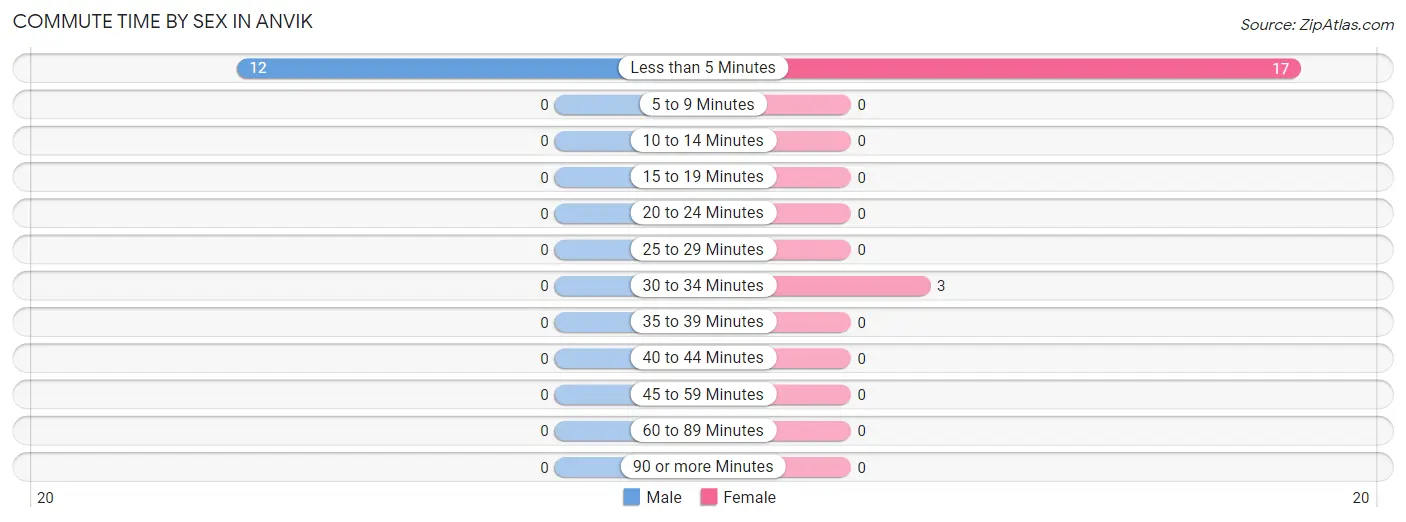
| Commute Time | Male | Female |
| Less than 5 Minutes | 12 (100.0%) | 17 (85.0%) |
| 5 to 9 Minutes | 0 (0.0%) | 0 (0.0%) |
| 10 to 14 Minutes | 0 (0.0%) | 0 (0.0%) |
| 15 to 19 Minutes | 0 (0.0%) | 0 (0.0%) |
| 20 to 24 Minutes | 0 (0.0%) | 0 (0.0%) |
| 25 to 29 Minutes | 0 (0.0%) | 0 (0.0%) |
| 30 to 34 Minutes | 0 (0.0%) | 3 (15.0%) |
| 35 to 39 Minutes | 0 (0.0%) | 0 (0.0%) |
| 40 to 44 Minutes | 0 (0.0%) | 0 (0.0%) |
| 45 to 59 Minutes | 0 (0.0%) | 0 (0.0%) |
| 60 to 89 Minutes | 0 (0.0%) | 0 (0.0%) |
| 90 or more Minutes | 0 (0.0%) | 0 (0.0%) |
Time of Departure to Work by Sex in Anvik
The most frequent times of departure to work in Anvik are 4:00 PM to 11:59 PM (4, 33.3%) for males and 8:30 AM to 8:59 AM (9, 45.0%) for females.
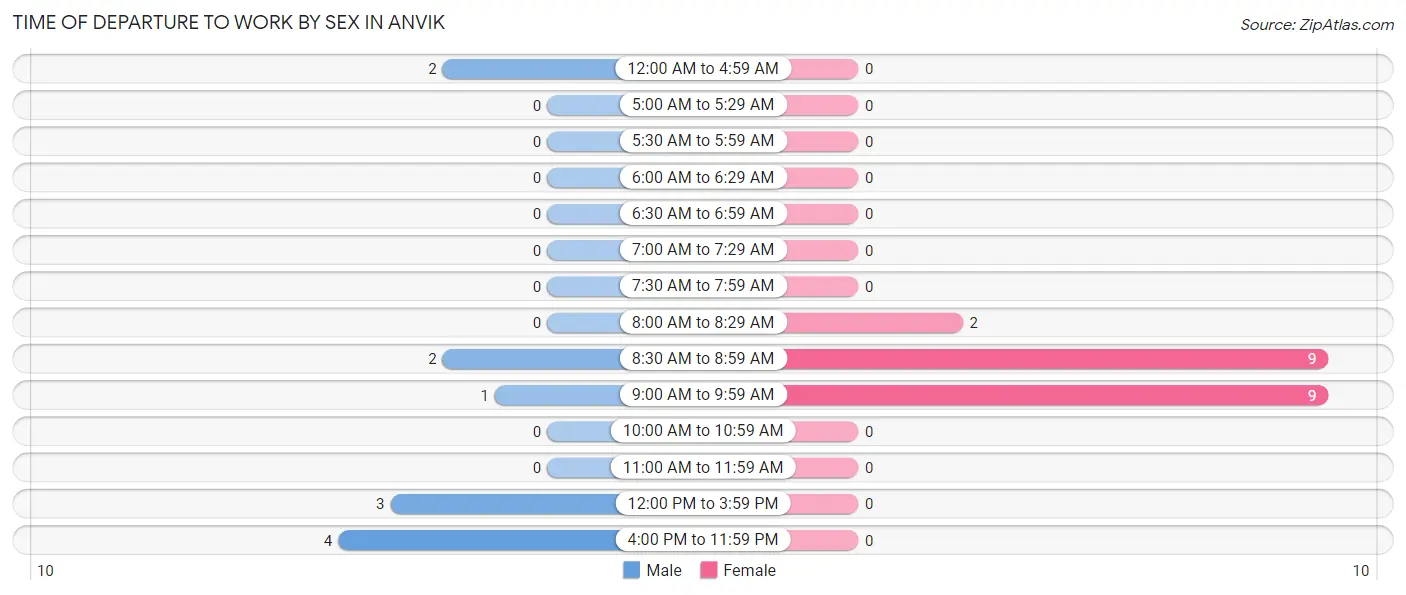
| Time of Departure | Male | Female |
| 12:00 AM to 4:59 AM | 2 (16.7%) | 0 (0.0%) |
| 5:00 AM to 5:29 AM | 0 (0.0%) | 0 (0.0%) |
| 5:30 AM to 5:59 AM | 0 (0.0%) | 0 (0.0%) |
| 6:00 AM to 6:29 AM | 0 (0.0%) | 0 (0.0%) |
| 6:30 AM to 6:59 AM | 0 (0.0%) | 0 (0.0%) |
| 7:00 AM to 7:29 AM | 0 (0.0%) | 0 (0.0%) |
| 7:30 AM to 7:59 AM | 0 (0.0%) | 0 (0.0%) |
| 8:00 AM to 8:29 AM | 0 (0.0%) | 2 (10.0%) |
| 8:30 AM to 8:59 AM | 2 (16.7%) | 9 (45.0%) |
| 9:00 AM to 9:59 AM | 1 (8.3%) | 9 (45.0%) |
| 10:00 AM to 10:59 AM | 0 (0.0%) | 0 (0.0%) |
| 11:00 AM to 11:59 AM | 0 (0.0%) | 0 (0.0%) |
| 12:00 PM to 3:59 PM | 3 (25.0%) | 0 (0.0%) |
| 4:00 PM to 11:59 PM | 4 (33.3%) | 0 (0.0%) |
| Total | 12 (100.0%) | 20 (100.0%) |
Housing Occupancy in Anvik
Occupancy by Ownership in Anvik
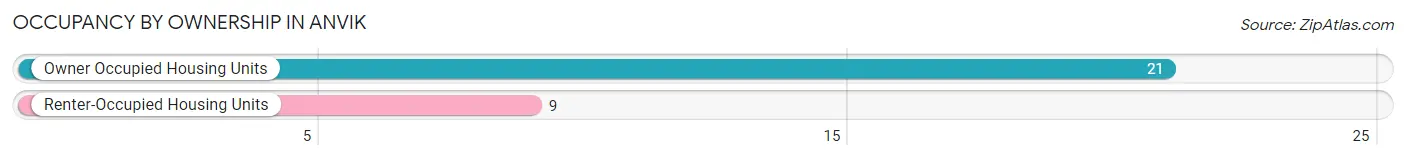
Of the total 30 dwellings in Anvik, owner-occupied units account for 21 (70.0%), while renter-occupied units make up 9 (30.0%).
| Occupancy | # Housing Units | % Housing Units |
| Owner Occupied Housing Units | 21 | 70.0% |
| Renter-Occupied Housing Units | 9 | 30.0% |
| Total Occupied Housing Units | 30 | 100.0% |
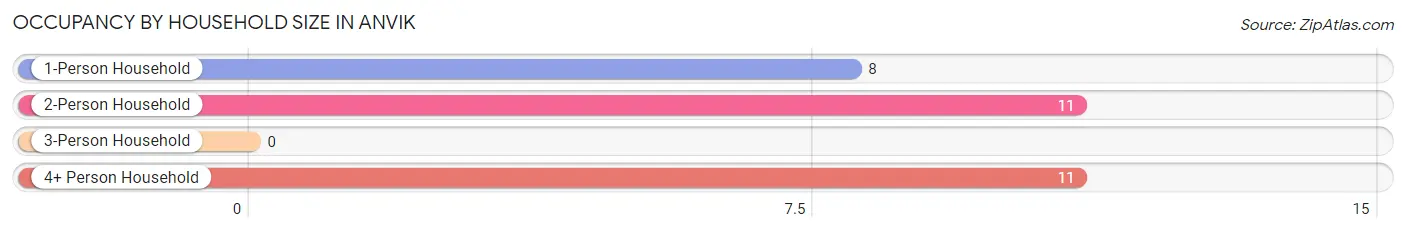
Occupancy by Household Size in Anvik
| Household Size | # Housing Units | % Housing Units |
| 1-Person Household | 8 | 26.7% |
| 2-Person Household | 11 | 36.7% |
| 3-Person Household | 0 | 0.0% |
| 4+ Person Household | 11 | 36.7% |
| Total Housing Units | 30 | 100.0% |
Occupancy by Ownership by Household Size in Anvik
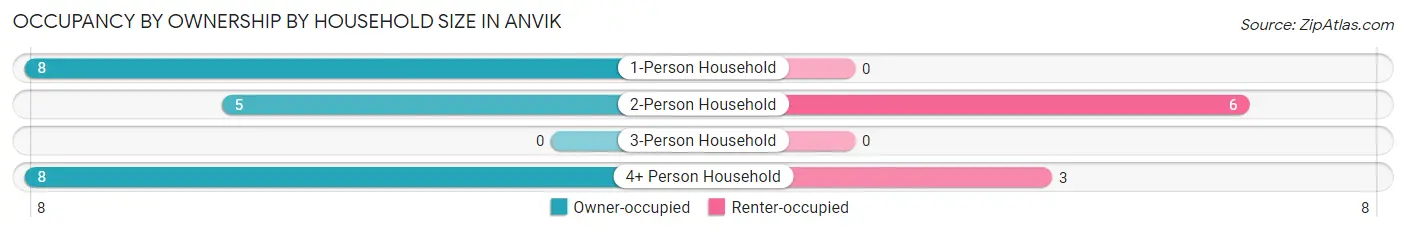
| Household Size | Owner-occupied | Renter-occupied |
| 1-Person Household | 8 (100.0%) | 0 (0.0%) |
| 2-Person Household | 5 (45.5%) | 6 (54.5%) |
| 3-Person Household | 0 (0.0%) | 0 (0.0%) |
| 4+ Person Household | 8 (72.7%) | 3 (27.3%) |
| Total Housing Units | 21 (70.0%) | 9 (30.0%) |
Occupancy by Educational Attainment in Anvik

| Household Size | Owner-occupied | Renter-occupied |
| Less than High School | 7 (100.0%) | 0 (0.0%) |
| High School Diploma | 9 (50.0%) | 9 (50.0%) |
| College/Associate Degree | 5 (100.0%) | 0 (0.0%) |
| Bachelor's Degree or higher | 0 (0.0%) | 0 (0.0%) |
Occupancy by Age of Householder in Anvik
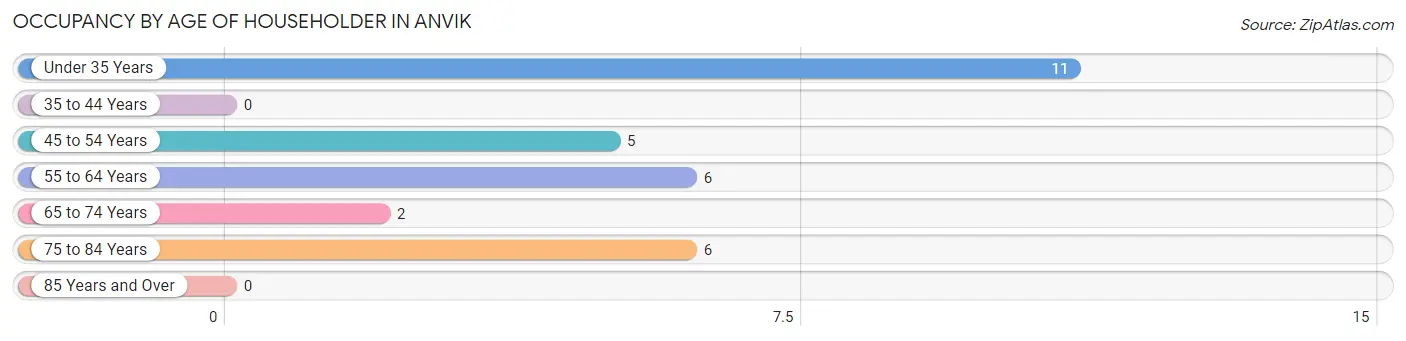
| Age Bracket | # Households | % Households |
| Under 35 Years | 11 | 36.7% |
| 35 to 44 Years | 0 | 0.0% |
| 45 to 54 Years | 5 | 16.7% |
| 55 to 64 Years | 6 | 20.0% |
| 65 to 74 Years | 2 | 6.7% |
| 75 to 84 Years | 6 | 20.0% |
| 85 Years and Over | 0 | 0.0% |
| Total | 30 | 100.0% |
Housing Finances in Anvik
Median Income by Occupancy in Anvik
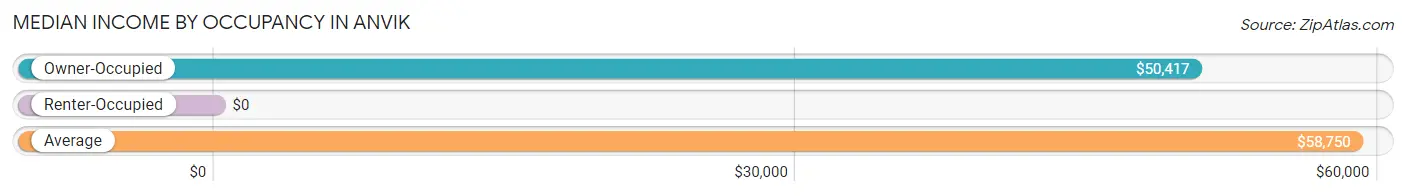
| Occupancy Type | # Households | Median Income |
| Owner-Occupied | 21 (70.0%) | $50,417 |
| Renter-Occupied | 9 (30.0%) | $0 |
| Average | 30 (100.0%) | $58,750 |
Occupancy by Householder Income Bracket in Anvik
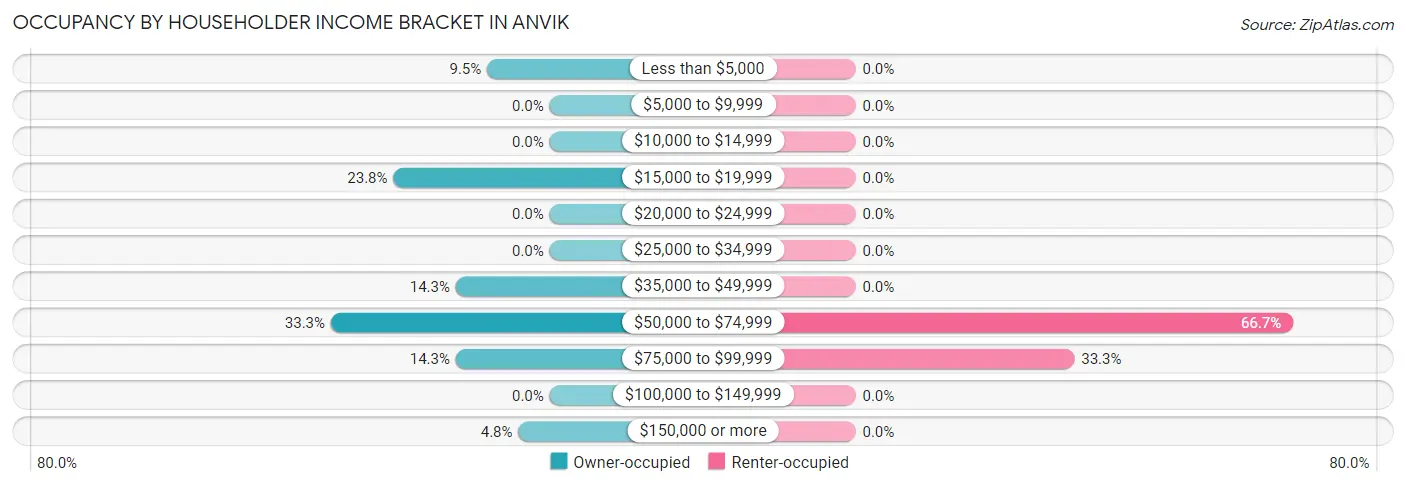
| Income Bracket | Owner-occupied | Renter-occupied |
| Less than $5,000 | 2 (9.5%) | 0 (0.0%) |
| $5,000 to $9,999 | 0 (0.0%) | 0 (0.0%) |
| $10,000 to $14,999 | 0 (0.0%) | 0 (0.0%) |
| $15,000 to $19,999 | 5 (23.8%) | 0 (0.0%) |
| $20,000 to $24,999 | 0 (0.0%) | 0 (0.0%) |
| $25,000 to $34,999 | 0 (0.0%) | 0 (0.0%) |
| $35,000 to $49,999 | 3 (14.3%) | 0 (0.0%) |
| $50,000 to $74,999 | 7 (33.3%) | 6 (66.7%) |
| $75,000 to $99,999 | 3 (14.3%) | 3 (33.3%) |
| $100,000 to $149,999 | 0 (0.0%) | 0 (0.0%) |
| $150,000 or more | 1 (4.8%) | 0 (0.0%) |
| Total | 21 (100.0%) | 9 (100.0%) |
Monthly Housing Cost Tiers in Anvik
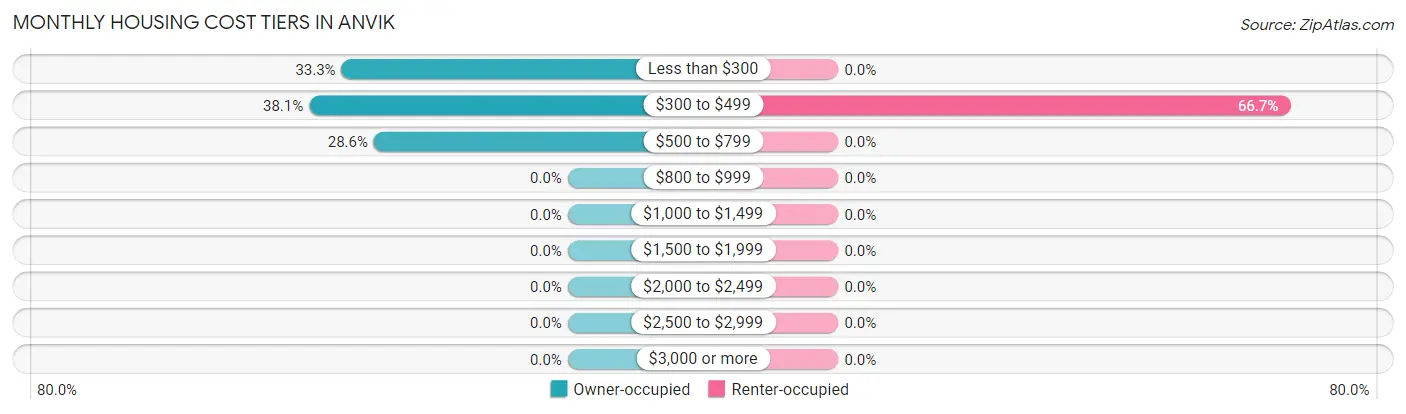
| Monthly Cost | Owner-occupied | Renter-occupied |
| Less than $300 | 7 (33.3%) | 0 (0.0%) |
| $300 to $499 | 8 (38.1%) | 6 (66.7%) |
| $500 to $799 | 6 (28.6%) | 0 (0.0%) |
| $800 to $999 | 0 (0.0%) | 0 (0.0%) |
| $1,000 to $1,499 | 0 (0.0%) | 0 (0.0%) |
| $1,500 to $1,999 | 0 (0.0%) | 0 (0.0%) |
| $2,000 to $2,499 | 0 (0.0%) | 0 (0.0%) |
| $2,500 to $2,999 | 0 (0.0%) | 0 (0.0%) |
| $3,000 or more | 0 (0.0%) | 0 (0.0%) |
| Total | 21 (100.0%) | 9 (100.0%) |
Physical Housing Characteristics in Anvik
Housing Structures in Anvik
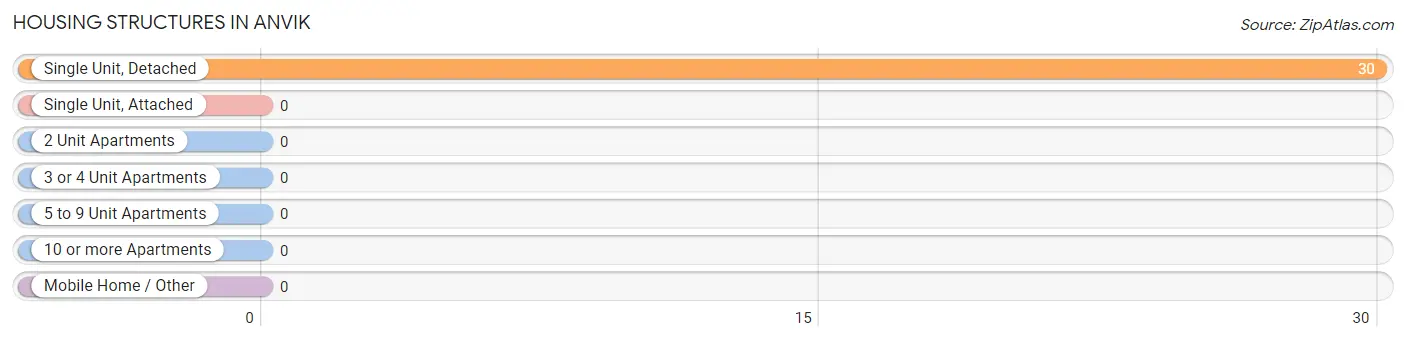
| Structure Type | # Housing Units | % Housing Units |
| Single Unit, Detached | 30 | 100.0% |
| Single Unit, Attached | 0 | 0.0% |
| 2 Unit Apartments | 0 | 0.0% |
| 3 or 4 Unit Apartments | 0 | 0.0% |
| 5 to 9 Unit Apartments | 0 | 0.0% |
| 10 or more Apartments | 0 | 0.0% |
| Mobile Home / Other | 0 | 0.0% |
| Total | 30 | 100.0% |
Housing Structures by Occupancy in Anvik
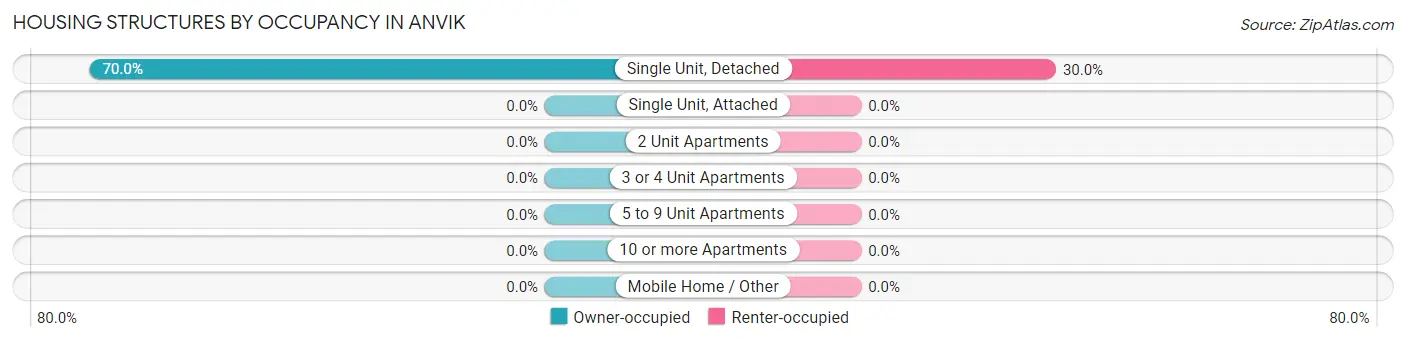
| Structure Type | Owner-occupied | Renter-occupied |
| Single Unit, Detached | 21 (70.0%) | 9 (30.0%) |
| Single Unit, Attached | 0 (0.0%) | 0 (0.0%) |
| 2 Unit Apartments | 0 (0.0%) | 0 (0.0%) |
| 3 or 4 Unit Apartments | 0 (0.0%) | 0 (0.0%) |
| 5 to 9 Unit Apartments | 0 (0.0%) | 0 (0.0%) |
| 10 or more Apartments | 0 (0.0%) | 0 (0.0%) |
| Mobile Home / Other | 0 (0.0%) | 0 (0.0%) |
| Total | 21 (70.0%) | 9 (30.0%) |
Housing Structures by Number of Rooms in Anvik
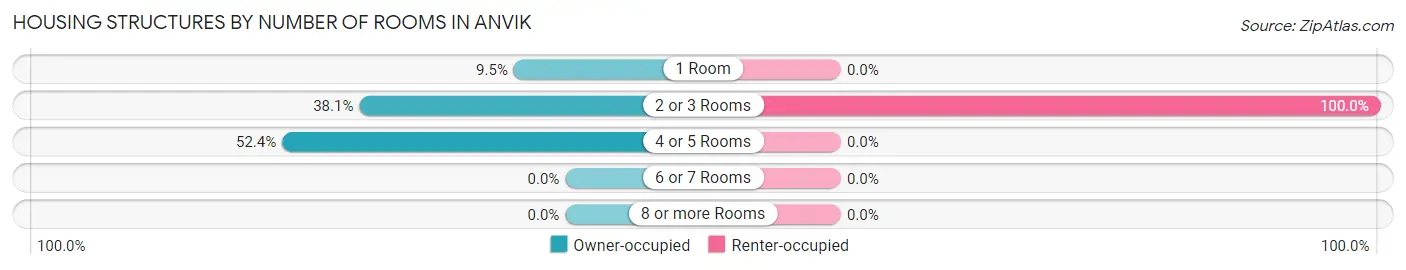
| Number of Rooms | Owner-occupied | Renter-occupied |
| 1 Room | 2 (9.5%) | 0 (0.0%) |
| 2 or 3 Rooms | 8 (38.1%) | 9 (100.0%) |
| 4 or 5 Rooms | 11 (52.4%) | 0 (0.0%) |
| 6 or 7 Rooms | 0 (0.0%) | 0 (0.0%) |
| 8 or more Rooms | 0 (0.0%) | 0 (0.0%) |
| Total | 21 (100.0%) | 9 (100.0%) |
Housing Structure by Heating Type in Anvik
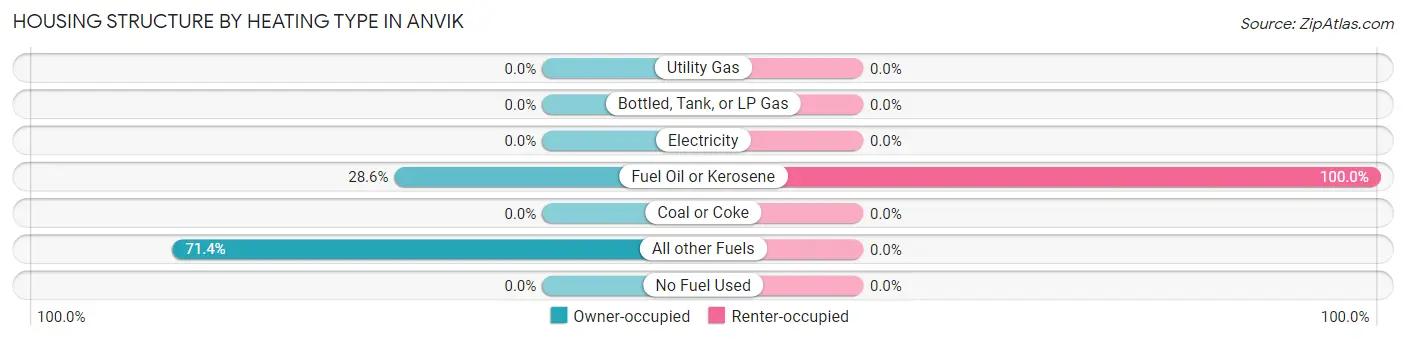
| Heating Type | Owner-occupied | Renter-occupied |
| Utility Gas | 0 (0.0%) | 0 (0.0%) |
| Bottled, Tank, or LP Gas | 0 (0.0%) | 0 (0.0%) |
| Electricity | 0 (0.0%) | 0 (0.0%) |
| Fuel Oil or Kerosene | 6 (28.6%) | 9 (100.0%) |
| Coal or Coke | 0 (0.0%) | 0 (0.0%) |
| All other Fuels | 15 (71.4%) | 0 (0.0%) |
| No Fuel Used | 0 (0.0%) | 0 (0.0%) |
| Total | 21 (100.0%) | 9 (100.0%) |
Household Vehicle Usage in Anvik
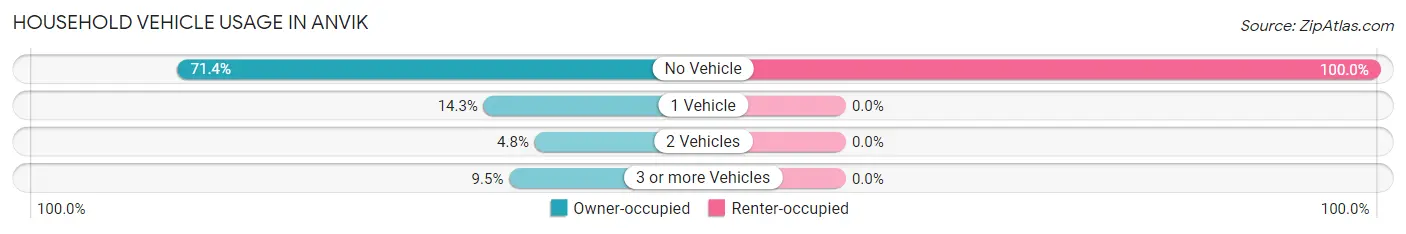
| Vehicles per Household | Owner-occupied | Renter-occupied |
| No Vehicle | 15 (71.4%) | 9 (100.0%) |
| 1 Vehicle | 3 (14.3%) | 0 (0.0%) |
| 2 Vehicles | 1 (4.8%) | 0 (0.0%) |
| 3 or more Vehicles | 2 (9.5%) | 0 (0.0%) |
| Total | 21 (100.0%) | 9 (100.0%) |
Real Estate & Mortgages in Anvik
Real Estate and Mortgage Overview in Anvik
| Characteristic | Without Mortgage | With Mortgage |
| Housing Units | 21 | 0 |
| Median Property Value | $43,800 | $0 |
| Median Household Income | $50,417 | $0 |
| Monthly Housing Costs | $335 | $0 |
| Real Estate Taxes | - | - |
Property Value by Mortgage Status in Anvik
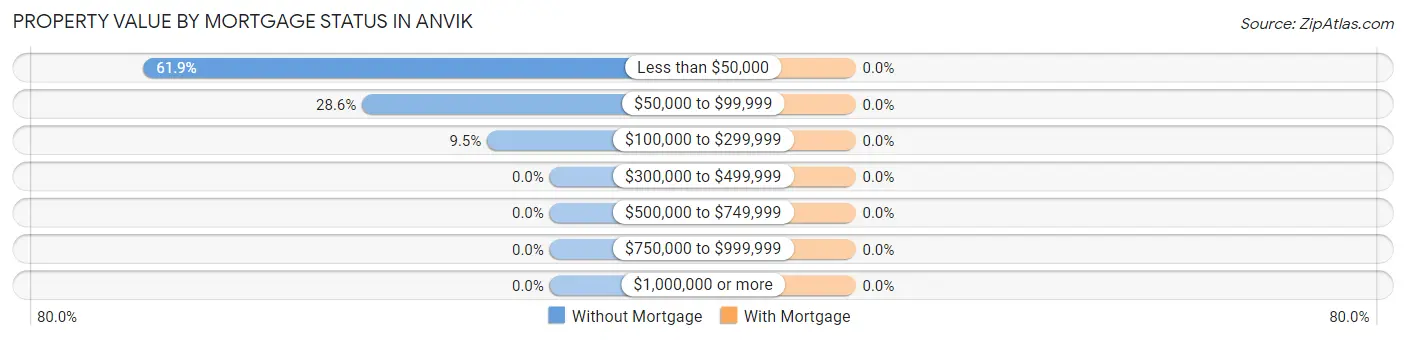
| Property Value | Without Mortgage | With Mortgage |
| Less than $50,000 | 13 (61.9%) | 0 (0.0%) |
| $50,000 to $99,999 | 6 (28.6%) | 0 (0.0%) |
| $100,000 to $299,999 | 2 (9.5%) | 0 (0.0%) |
| $300,000 to $499,999 | 0 (0.0%) | 0 (0.0%) |
| $500,000 to $749,999 | 0 (0.0%) | 0 (0.0%) |
| $750,000 to $999,999 | 0 (0.0%) | 0 (0.0%) |
| $1,000,000 or more | 0 (0.0%) | 0 (0.0%) |
| Total | 21 (100.0%) | 0 (0.0%) |
Household Income by Mortgage Status in Anvik
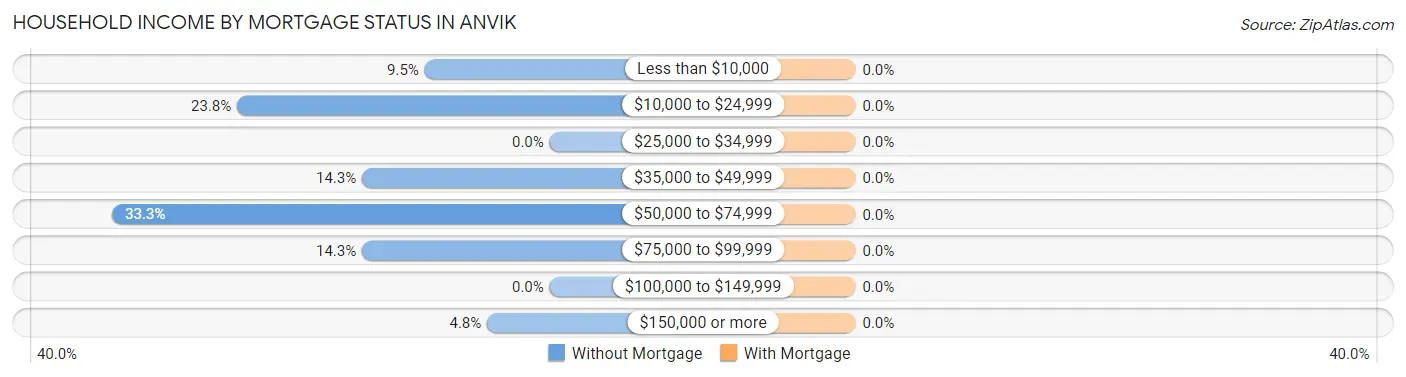
| Household Income | Without Mortgage | With Mortgage |
| Less than $10,000 | 2 (9.5%) | 0 (0.0%) |
| $10,000 to $24,999 | 5 (23.8%) | 0 (0.0%) |
| $25,000 to $34,999 | 0 (0.0%) | 0 (0.0%) |
| $35,000 to $49,999 | 3 (14.3%) | 0 (0.0%) |
| $50,000 to $74,999 | 7 (33.3%) | 0 (0.0%) |
| $75,000 to $99,999 | 3 (14.3%) | 0 (0.0%) |
| $100,000 to $149,999 | 0 (0.0%) | 0 (0.0%) |
| $150,000 or more | 1 (4.8%) | 0 (0.0%) |
| Total | 21 (100.0%) | 0 (0.0%) |
Property Value to Household Income Ratio in Anvik
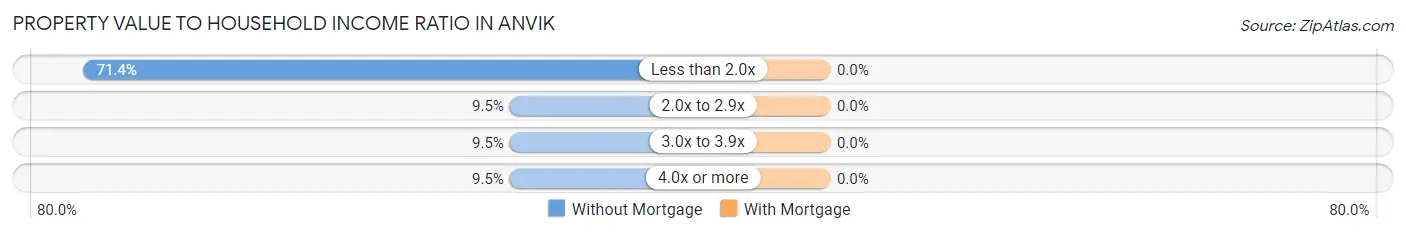
| Value-to-Income Ratio | Without Mortgage | With Mortgage |
| Less than 2.0x | 15 (71.4%) | 0 (0.0%) |
| 2.0x to 2.9x | 2 (9.5%) | 0 (0.0%) |
| 3.0x to 3.9x | 2 (9.5%) | 0 (0.0%) |
| 4.0x or more | 2 (9.5%) | 0 (0.0%) |
| Total | 21 (100.0%) | 0 (0.0%) |
Real Estate Taxes by Mortgage Status in Anvik
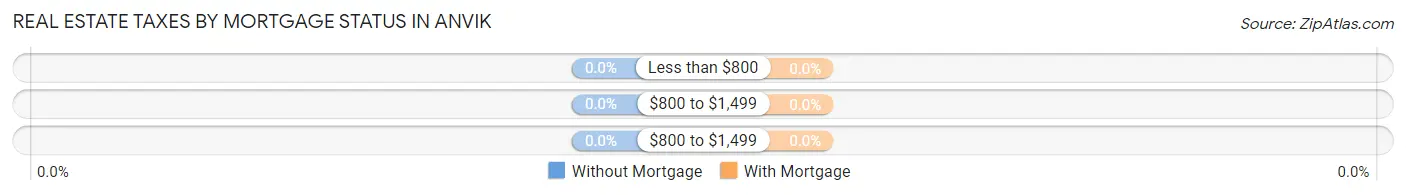
| Property Taxes | Without Mortgage | With Mortgage |
| Less than $800 | 0 (0.0%) | 0 (0.0%) |
| $800 to $1,499 | 0 (0.0%) | 0 (0.0%) |
| $800 to $1,499 | 0 (0.0%) | 0 (0.0%) |
| Total | 21 (100.0%) | 0 (0.0%) |
Health & Disability in Anvik
Health Insurance Coverage by Age in Anvik
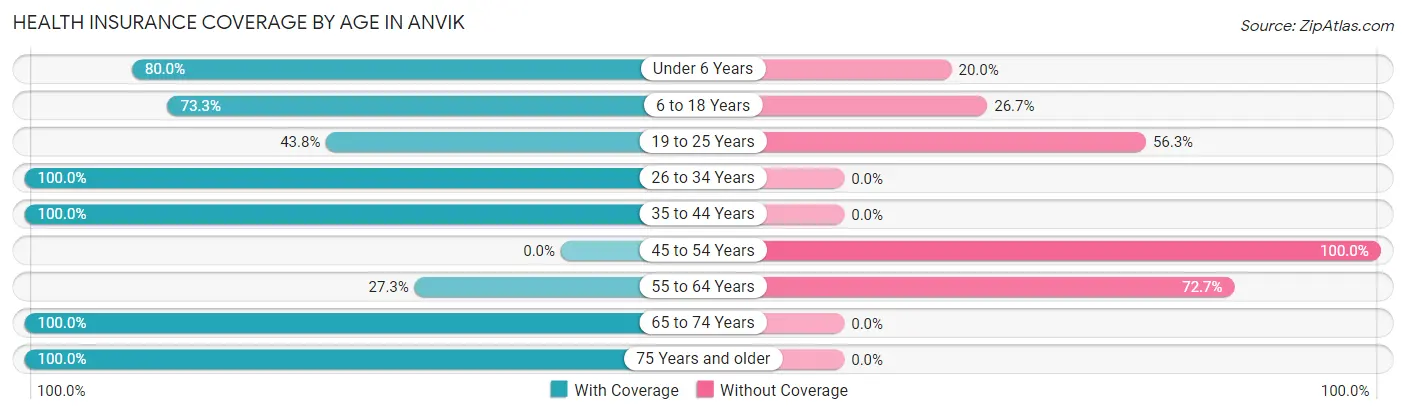
| Age Bracket | With Coverage | Without Coverage |
| Under 6 Years | 8 (80.0%) | 2 (20.0%) |
| 6 to 18 Years | 11 (73.3%) | 4 (26.7%) |
| 19 to 25 Years | 7 (43.8%) | 9 (56.2%) |
| 26 to 34 Years | 4 (100.0%) | 0 (0.0%) |
| 35 to 44 Years | 4 (100.0%) | 0 (0.0%) |
| 45 to 54 Years | 0 (0.0%) | 5 (100.0%) |
| 55 to 64 Years | 3 (27.3%) | 8 (72.7%) |
| 65 to 74 Years | 3 (100.0%) | 0 (0.0%) |
| 75 Years and older | 6 (100.0%) | 0 (0.0%) |
| Total | 46 (62.2%) | 28 (37.8%) |
Health Insurance Coverage by Citizenship Status in Anvik
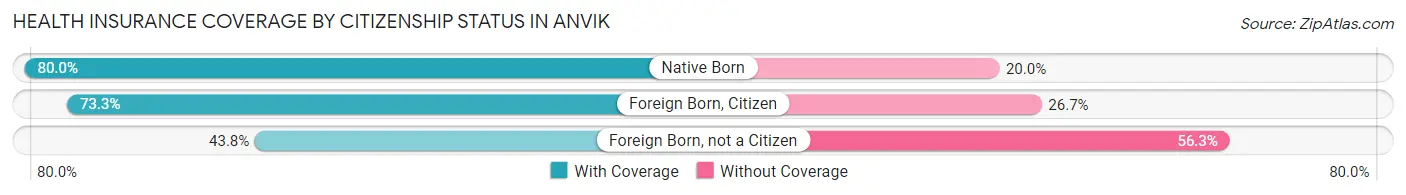
| Citizenship Status | With Coverage | Without Coverage |
| Native Born | 8 (80.0%) | 2 (20.0%) |
| Foreign Born, Citizen | 11 (73.3%) | 4 (26.7%) |
| Foreign Born, not a Citizen | 7 (43.8%) | 9 (56.2%) |
Health Insurance Coverage by Household Income in Anvik
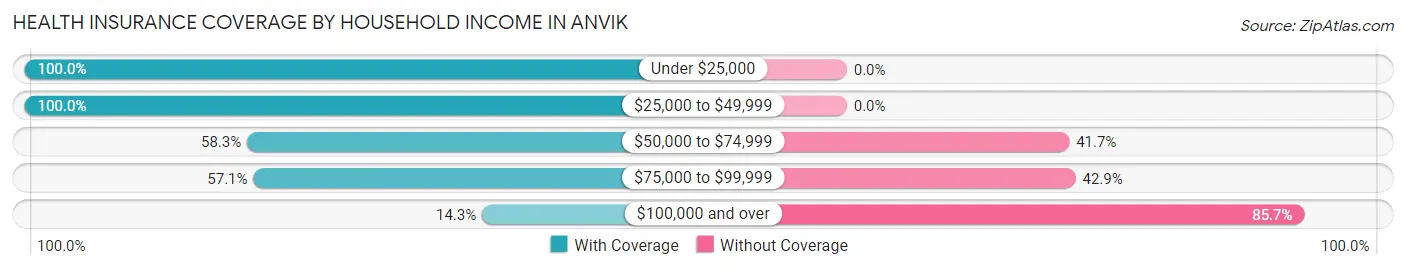
| Household Income | With Coverage | Without Coverage |
| Under $25,000 | 12 (100.0%) | 0 (0.0%) |
| $25,000 to $49,999 | 3 (100.0%) | 0 (0.0%) |
| $50,000 to $74,999 | 14 (58.3%) | 10 (41.7%) |
| $75,000 to $99,999 | 16 (57.1%) | 12 (42.9%) |
| $100,000 and over | 1 (14.3%) | 6 (85.7%) |
Public vs Private Health Insurance Coverage by Age in Anvik
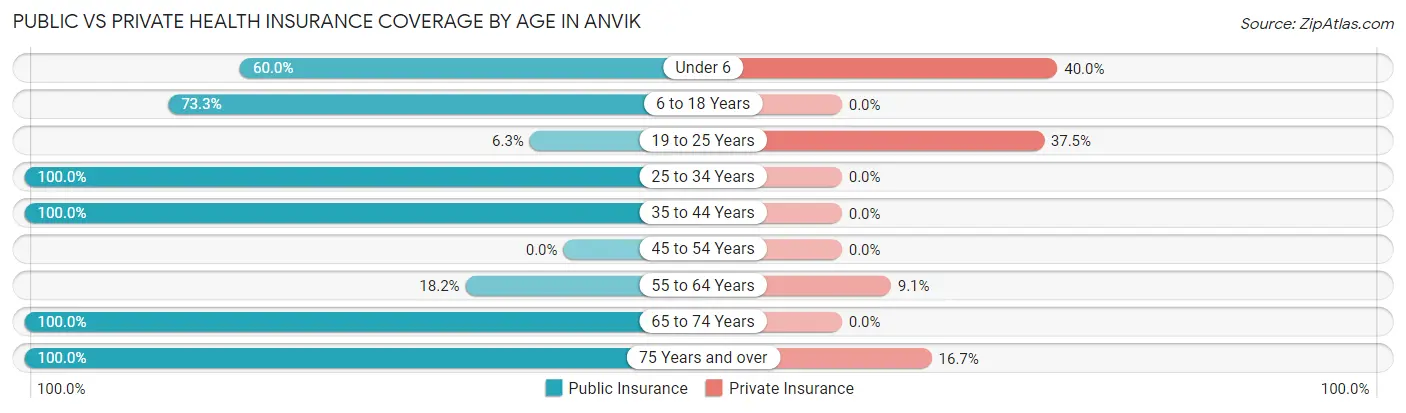
| Age Bracket | Public Insurance | Private Insurance |
| Under 6 | 6 (60.0%) | 4 (40.0%) |
| 6 to 18 Years | 11 (73.3%) | 0 (0.0%) |
| 19 to 25 Years | 1 (6.2%) | 6 (37.5%) |
| 25 to 34 Years | 4 (100.0%) | 0 (0.0%) |
| 35 to 44 Years | 4 (100.0%) | 0 (0.0%) |
| 45 to 54 Years | 0 (0.0%) | 0 (0.0%) |
| 55 to 64 Years | 2 (18.2%) | 1 (9.1%) |
| 65 to 74 Years | 3 (100.0%) | 0 (0.0%) |
| 75 Years and over | 6 (100.0%) | 1 (16.7%) |
| Total | 37 (50.0%) | 12 (16.2%) |
Disability Status by Sex by Age in Anvik
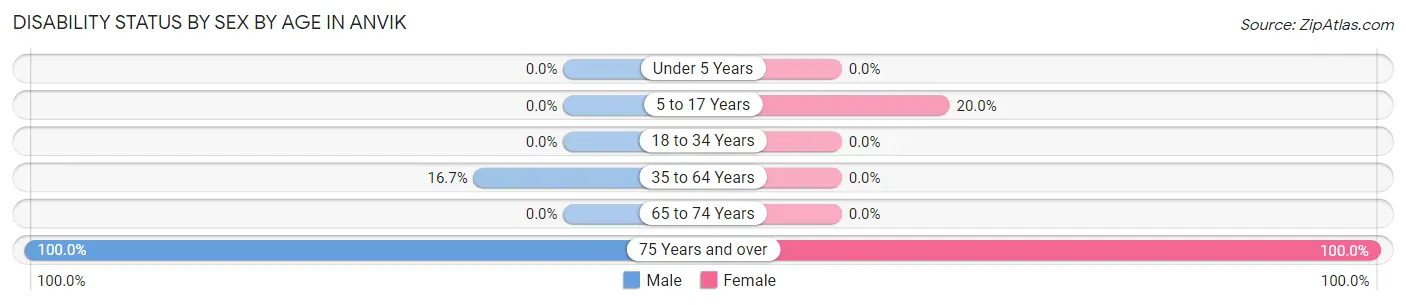
| Age Bracket | Male | Female |
| Under 5 Years | 0 (0.0%) | 0 (0.0%) |
| 5 to 17 Years | 0 (0.0%) | 1 (20.0%) |
| 18 to 34 Years | 0 (0.0%) | 0 (0.0%) |
| 35 to 64 Years | 2 (16.7%) | 0 (0.0%) |
| 65 to 74 Years | 0 (0.0%) | 0 (0.0%) |
| 75 Years and over | 4 (100.0%) | 2 (100.0%) |
Disability Class by Sex by Age in Anvik
Disability Class: Hearing Difficulty
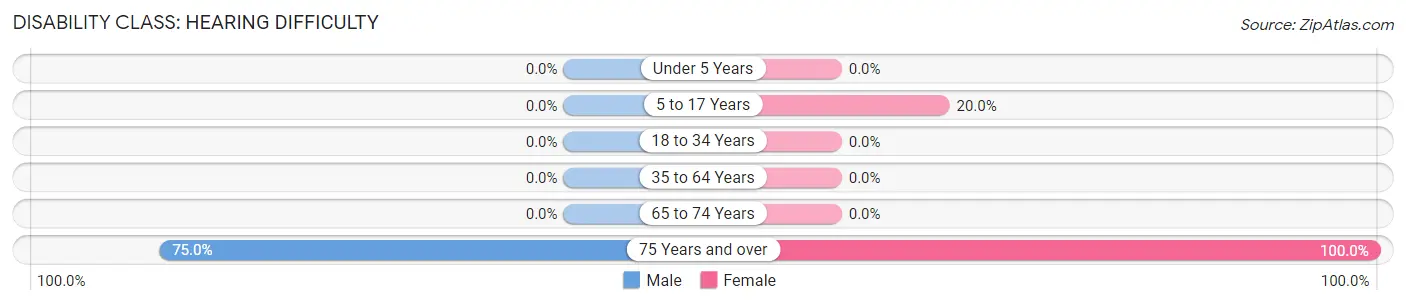
| Age Bracket | Male | Female |
| Under 5 Years | 0 (0.0%) | 0 (0.0%) |
| 5 to 17 Years | 0 (0.0%) | 1 (20.0%) |
| 18 to 34 Years | 0 (0.0%) | 0 (0.0%) |
| 35 to 64 Years | 0 (0.0%) | 0 (0.0%) |
| 65 to 74 Years | 0 (0.0%) | 0 (0.0%) |
| 75 Years and over | 3 (75.0%) | 2 (100.0%) |
Disability Class: Vision Difficulty
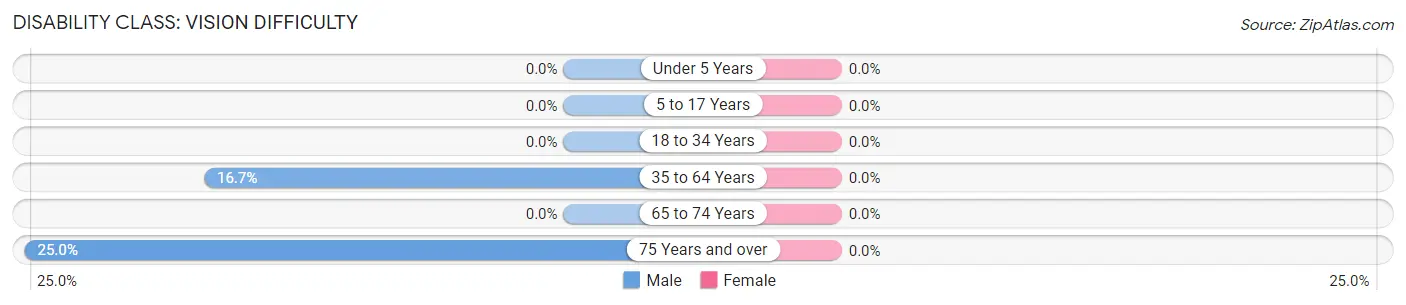
| Age Bracket | Male | Female |
| Under 5 Years | 0 (0.0%) | 0 (0.0%) |
| 5 to 17 Years | 0 (0.0%) | 0 (0.0%) |
| 18 to 34 Years | 0 (0.0%) | 0 (0.0%) |
| 35 to 64 Years | 2 (16.7%) | 0 (0.0%) |
| 65 to 74 Years | 0 (0.0%) | 0 (0.0%) |
| 75 Years and over | 1 (25.0%) | 0 (0.0%) |
Disability Class: Cognitive Difficulty
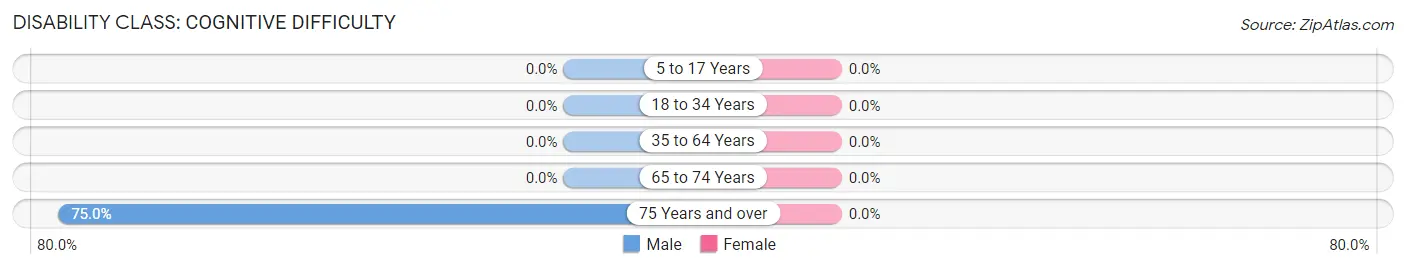
| Age Bracket | Male | Female |
| 5 to 17 Years | 0 (0.0%) | 0 (0.0%) |
| 18 to 34 Years | 0 (0.0%) | 0 (0.0%) |
| 35 to 64 Years | 0 (0.0%) | 0 (0.0%) |
| 65 to 74 Years | 0 (0.0%) | 0 (0.0%) |
| 75 Years and over | 3 (75.0%) | 0 (0.0%) |
Disability Class: Ambulatory Difficulty
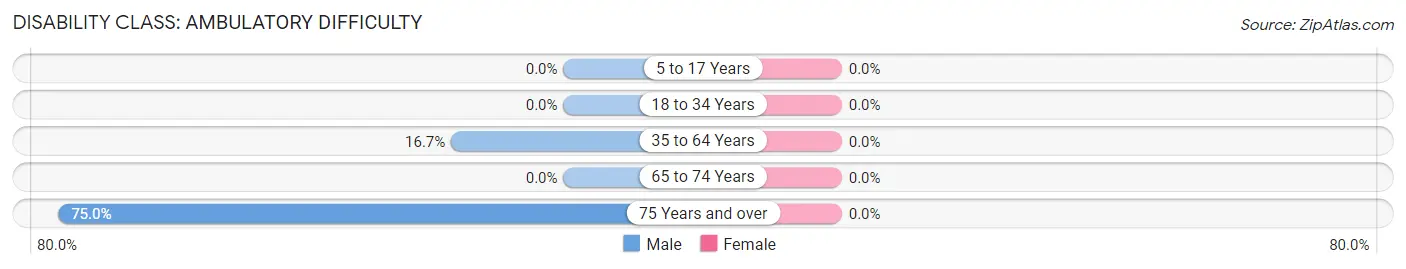
| Age Bracket | Male | Female |
| 5 to 17 Years | 0 (0.0%) | 0 (0.0%) |
| 18 to 34 Years | 0 (0.0%) | 0 (0.0%) |
| 35 to 64 Years | 2 (16.7%) | 0 (0.0%) |
| 65 to 74 Years | 0 (0.0%) | 0 (0.0%) |
| 75 Years and over | 3 (75.0%) | 0 (0.0%) |
Disability Class: Self-Care Difficulty
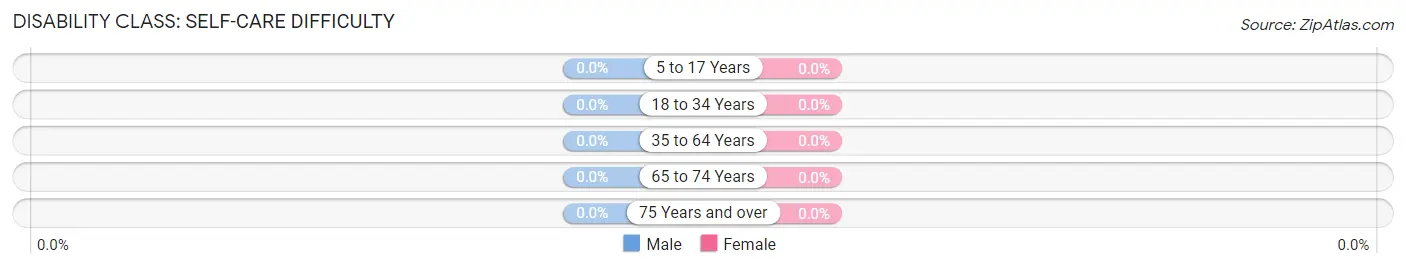
| Age Bracket | Male | Female |
| 5 to 17 Years | 0 (0.0%) | 0 (0.0%) |
| 18 to 34 Years | 0 (0.0%) | 0 (0.0%) |
| 35 to 64 Years | 0 (0.0%) | 0 (0.0%) |
| 65 to 74 Years | 0 (0.0%) | 0 (0.0%) |
| 75 Years and over | 0 (0.0%) | 0 (0.0%) |
Technology Access in Anvik
Computing Device Access in Anvik
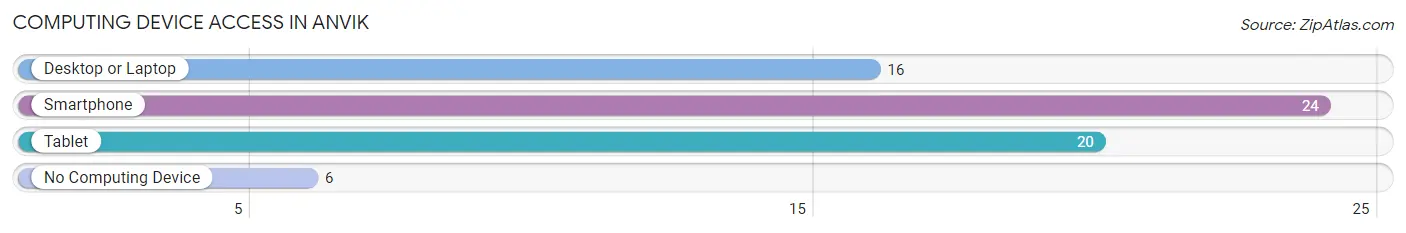
| Device Type | # Households | % Households |
| Desktop or Laptop | 16 | 53.3% |
| Smartphone | 24 | 80.0% |
| Tablet | 20 | 66.7% |
| No Computing Device | 6 | 20.0% |
| Total | 30 | 100.0% |
Internet Access in Anvik
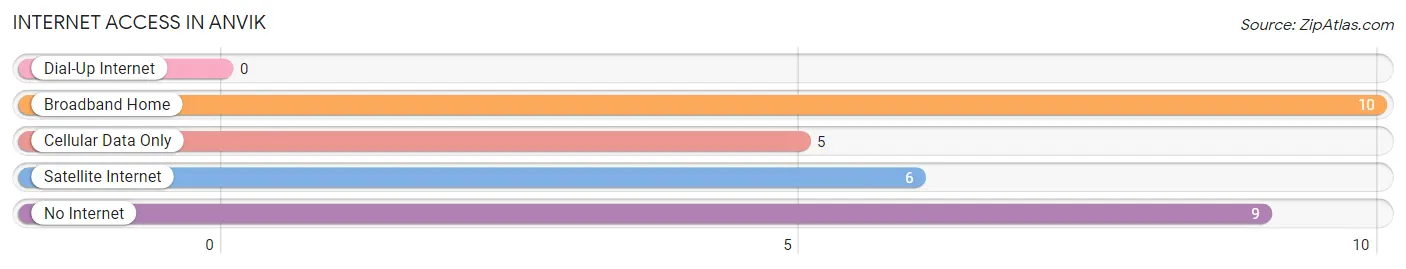
| Internet Type | # Households | % Households |
| Dial-Up Internet | 0 | 0.0% |
| Broadband Home | 10 | 33.3% |
| Cellular Data Only | 5 | 16.7% |
| Satellite Internet | 6 | 20.0% |
| No Internet | 9 | 30.0% |
| Total | 30 | 100.0% |
Anvik Summary
Anvik is a small city located in the Yukon-Kuskokwim Delta region of Alaska. It is situated on the banks of the Yukon River, approximately 200 miles west of Anchorage. The city has a population of approximately 400 people, and is the second largest city in the region.
History
The area around Anvik has been inhabited by the Yup'ik people for thousands of years. The first recorded contact with Europeans was in 1838, when the Russian explorer Ivan Petroff visited the area. The first permanent settlement was established in 1878, when the Russian-American Company built a trading post. The post was abandoned in 1881, but the settlement was re-established in 1884 by the Alaska Commercial Company.
The city was incorporated in 1901, and was named after the nearby Anvik River. The city was a major trading center for the region, and was the site of a salmon cannery. The cannery closed in the 1950s, and the city's economy shifted to subsistence fishing and hunting.
Geography
Anvik is located in the Yukon-Kuskokwim Delta region of Alaska. The city is situated on the banks of the Yukon River, approximately 200 miles west of Anchorage. The city is surrounded by tundra and boreal forest, and is located in a region of low hills and rolling terrain. The climate is subarctic, with long, cold winters and short, mild summers.
Economy
The economy of Anvik is largely based on subsistence fishing and hunting. The city is home to a fish processing plant, which processes salmon, whitefish, and other species. The city also has a small tourism industry, with visitors coming to fish and hunt in the area.
Demographics
As of the 2010 census, the population of Anvik was 400 people. The racial makeup of the city was 95.5% Native American, 2.5% White, and 2% from other races. The median household income was $25,000, and the median family income was $30,000. The per capita income was $14,000.
Conclusion
Anvik is a small city located in the Yukon-Kuskokwim Delta region of Alaska. It has a population of approximately 400 people, and is the second largest city in the region. The city has a long history of settlement, and its economy is largely based on subsistence fishing and hunting. The city is home to a fish processing plant, and has a small tourism industry. The population of Anvik is predominantly Native American, and the median household income is $25,000.
Common Questions
What is Per Capita Income in Anvik?
Per Capita income in Anvik is $23,576.
What is the Median Family Income in Anvik?
Median Family Income in Anvik is $61,042.
What is the Median Household income in Anvik?
Median Household Income in Anvik is $58,750.
What is Income or Wage Gap in Anvik?
Income or Wage Gap in Anvik is 74.0%.
Women in Anvik earn 26.0 cents for every dollar earned by a man.
What is Inequality or Gini Index in Anvik?
Inequality or Gini Index in Anvik is 0.30.
What is the Total Population of Anvik?
Total Population of Anvik is 74.
What is the Total Male Population of Anvik?
Total Male Population of Anvik is 38.
What is the Total Female Population of Anvik?
Total Female Population of Anvik is 36.
What is the Ratio of Males per 100 Females in Anvik?
There are 105.56 Males per 100 Females in Anvik.
What is the Ratio of Females per 100 Males in Anvik?
There are 94.74 Females per 100 Males in Anvik.
What is the Median Population Age in Anvik?
Median Population Age in Anvik is 24.5 Years.
What is the Average Family Size in Anvik
Average Family Size in Anvik is 2.7 People.
What is the Average Household Size in Anvik
Average Household Size in Anvik is 2.5 People.
How Large is the Labor Force in Anvik?
There are 39 People in the Labor Forcein in Anvik.
What is the Percentage of People in the Labor Force in Anvik?
67.2% of People are in the Labor Force in Anvik.
What is the Unemployment Rate in Anvik?
Unemployment Rate in Anvik is 12.8%.