Zip Codes with the Highest Percentage of Population with a Degree in Computers and Mathematics in Marysville, WA

RELATED REPORTS & OPTIONS

Computers and Mathematics
Population
Families and Households
Female Fertility
Female Fertility (Unmarried)
Race (Community Size)
Race (Percentage)
Ancestry (Community Size)
AfricanAlaska NativeAlaskan AthabascanAleutAmericanArabAustrianBangladeshiBelgianBhutaneseBlackfeetBritishBurmeseCanadianCentral AmericanCherokeeChileanChippewaChoctawColombianColvilleCroatianCubanCzechCzechoslovakianDanishDutchEastern EuropeanEgyptianEnglishEuropeanFilipinoFinnishFrenchFrench American IndianFrench CanadianGermanGreekGuamanian / ChamorroGuatemalanHonduranHungarianIcelanderIndian (Asian)InupiatIrishIroquoisItalianJamaicanJapaneseKenyanKoreanLaotianLebaneseMalaysianMexicanMexican American IndianNative HawaiianNavajoNigerianNorthern EuropeanNorwegianPakistaniPanamanianPolishPortuguesePuerto RicanPuget Sound SalishRomanianRussianSalvadoranSamoanScandinavianScotch-IrishScottishSlovakSouth AmericanSpaniardSpanishSri LankanSubsaharan AfricanSwedishSwissThaiTlingit-HaidaTsimshianUkrainianWelshYakamaYugoslavian
Ancestry (Percentage)
AfricanAlaska NativeAlaskan AthabascanAleutAmericanArabAustrianBangladeshiBelgianBhutaneseBlackfeetBritishBurmeseCanadianCentral AmericanCherokeeChileanChippewaChoctawColombianColvilleCroatianCubanCzechCzechoslovakianDanishDutchEastern EuropeanEgyptianEnglishEuropeanFilipinoFinnishFrenchFrench American IndianFrench CanadianGermanGreekGuamanian / ChamorroGuatemalanHonduranHungarianIcelanderIndian (Asian)InupiatIrishIroquoisItalianJamaicanJapaneseKenyanKoreanLaotianLebaneseMalaysianMexicanMexican American IndianNative HawaiianNavajoNigerianNorthern EuropeanNorwegianPakistaniPanamanianPolishPortuguesePuerto RicanPuget Sound SalishRomanianRussianSalvadoranSamoanScandinavianScotch-IrishScottishSlovakSouth AmericanSpaniardSpanishSri LankanSubsaharan AfricanSwedishSwissThaiTlingit-HaidaTsimshianUkrainianWelshYakamaYugoslavian
Immigrant Origin (Total)
Immigrant Origin (Percentage)
Income
Income (Families)
Income (Households)
Poverty
Poverty (Families)
Unemployment
Employment Occupations
Employment Industries
Employer Class
Commute Time
Commute Means
School Enrollment
Education by Degree Field
Occupancy
Finances
Physical Characteristics
Marysville
Compare Zip Codes
Comparison Subject

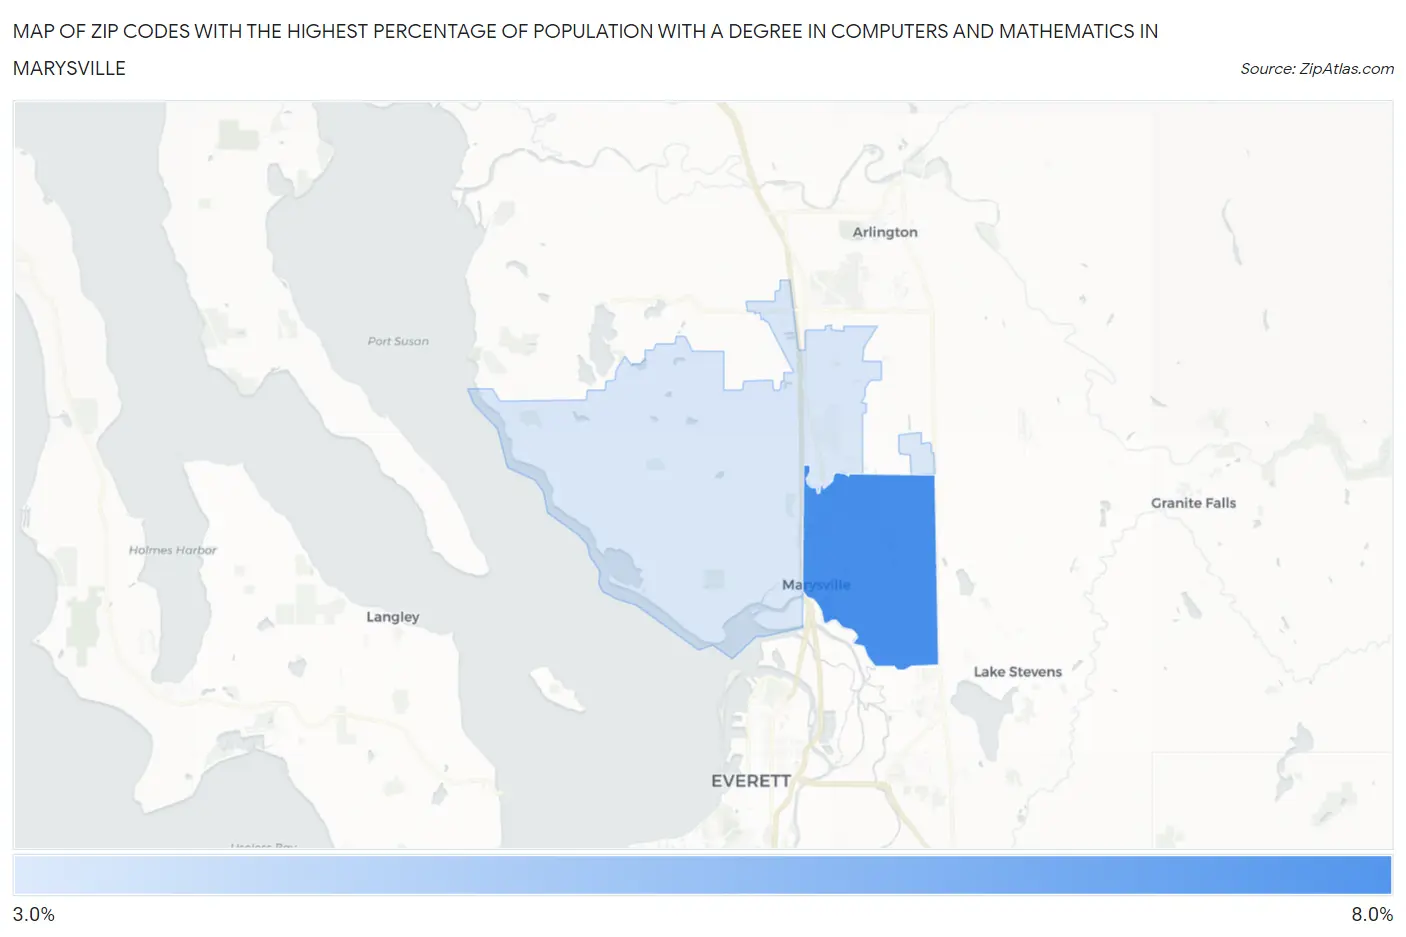
Map of Zip Codes with the Highest Percentage of Population with a Degree in Computers and Mathematics in Marysville

0.0%
8.0%
Zip Codes with the Highest Percentage of Population with a Degree in Computers and Mathematics in Marysville Map

Zip Codes with the Highest Percentage of Population with a Degree in Computers and Mathematics in Marysville, WA

Zip Code % Graduates vs State vs National
1.982706.5%7.0%(-0.469)#1234.9%(+1.60)#4,484
2.982713.3%7.0%(-3.66)#2854.9%(-1.59)#13,003

Common Questions

What are the Top Zip Codes with the Highest Percentage of Population with a Degree in Computers and Mathematics in Marysville, WA?
Top Zip Codes with the Highest Percentage of Population with a Degree in Computers and Mathematics in Marysville, WA are:
#1
6.5%
#2
3.3%
What zip code has the Highest Percentage of Population with a Degree in Computers and Mathematics in Marysville, WA?
98270 has the Highest Percentage of Population with a Degree in Computers and Mathematics in Marysville, WA with 6.5%.
What is the Percentage of Population with a Degree in Computers and Mathematics in Marysville, WA?
Percentage of Population with a Degree in Computers and Mathematics in Marysville is 5.6%.
What is the Percentage of Population with a Degree in Computers and Mathematics in Washington?
Percentage of Population with a Degree in Computers and Mathematics in Washington is 7.0%.
What is the Percentage of Population with a Degree in Computers and Mathematics in the United States?
Percentage of Population with a Degree in Computers and Mathematics in the United States is 4.9%.