Zip Codes with the Highest Percentage of Population with a Degree in Computers and Mathematics in Renton, WA

RELATED REPORTS & OPTIONS

Computers and Mathematics
Population
Families and Households
Female Fertility
Female Fertility (Unmarried)
Race (Community Size)
Race (Percentage)
Ancestry (Community Size)
AfricanAmericanArabArgentineanArmenianAustralianAustrianBangladeshiBelgianBhutaneseBlackfeetBrazilianBritishBulgarianBurmeseCambodianCanadianCentral AmericanCentral American IndianCherokeeChileanChippewaChoctawColombianCosta RicanCroatianCubanCzechDanishDominicanDutchEastern EuropeanEcuadorianEgyptianEnglishEthiopianEuropeanFilipinoFinnishFrenchFrench American IndianFrench CanadianGermanGreekGuamanian / ChamorroGuatemalanHaitianHonduranHungarianIcelanderIndian (Asian)InupiatIranianIrishItalianJamaicanJapaneseKenyanKoreanLaotianLatvianLebaneseLithuanianLuxembourgerMacedonianMalaysianMexicanMexican American IndianMongolianMoroccanNative HawaiianNepaleseNicaraguanNorthern EuropeanNorwegianPakistaniPalestinianPeruvianPolishPortuguesePuerto RicanPuget Sound SalishRomanianRussianSalvadoranSamoanScandinavianScotch-IrishScottishSerbianSiouxSlavicSlovakSloveneSomaliSouth AfricanSouth AmericanSpaniardSpanishSri LankanSubsaharan AfricanSudaneseSwedishSwissSyrianThaiTlingit-HaidaTonganTurkishUkrainianUruguayanVenezuelanWelshWest IndianYaquiYugoslavian
Ancestry (Percentage)
AfricanAmericanArabArgentineanArmenianAustralianAustrianBangladeshiBelgianBhutaneseBlackfeetBrazilianBritishBulgarianBurmeseCambodianCanadianCentral AmericanCentral American IndianCherokeeChileanChippewaChoctawColombianCosta RicanCroatianCubanCzechDanishDominicanDutchEastern EuropeanEcuadorianEgyptianEnglishEthiopianEuropeanFilipinoFinnishFrenchFrench American IndianFrench CanadianGermanGreekGuamanian / ChamorroGuatemalanHaitianHonduranHungarianIcelanderIndian (Asian)InupiatIranianIrishItalianJamaicanJapaneseKenyanKoreanLaotianLatvianLebaneseLithuanianLuxembourgerMacedonianMalaysianMexicanMexican American IndianMongolianMoroccanNative HawaiianNepaleseNicaraguanNorthern EuropeanNorwegianPakistaniPalestinianPeruvianPolishPortuguesePuerto RicanPuget Sound SalishRomanianRussianSalvadoranSamoanScandinavianScotch-IrishScottishSerbianSiouxSlavicSlovakSloveneSomaliSouth AfricanSouth AmericanSpaniardSpanishSri LankanSubsaharan AfricanSudaneseSwedishSwissSyrianThaiTlingit-HaidaTonganTurkishUkrainianUruguayanVenezuelanWelshWest IndianYaquiYugoslavian
Immigrant Origin (Total)
Immigrant Origin (Percentage)
Income
Income (Families)
Income (Households)
Poverty
Poverty (Families)
Unemployment
Employment Occupations
Employment Industries
Employer Class
Commute Time
Commute Means
School Enrollment
Education by Degree Field
Occupancy
Finances
Physical Characteristics
Renton
Compare Zip Codes
Comparison Subject

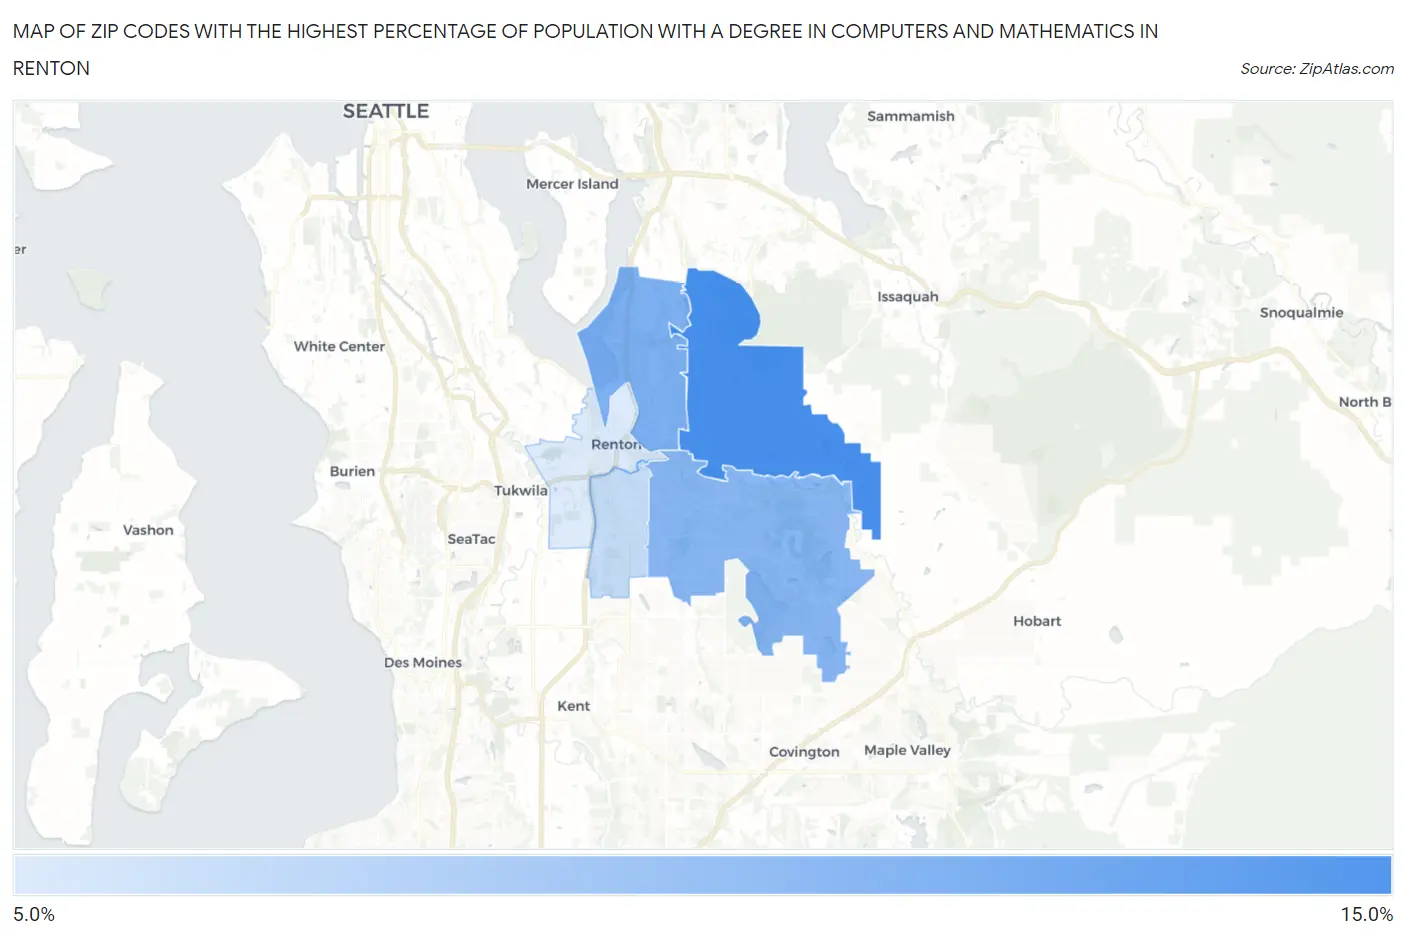
Map of Zip Codes with the Highest Percentage of Population with a Degree in Computers and Mathematics in Renton

0.0%
15.0%
Zip Codes with the Highest Percentage of Population with a Degree in Computers and Mathematics in Renton Map

Zip Codes with the Highest Percentage of Population with a Degree in Computers and Mathematics in Renton, WA

Zip Code % Graduates vs State vs National
1.9805910.6%7.0%(+3.61)#484.9%(+5.67)#1,563
2.980569.1%7.0%(+2.11)#664.9%(+4.18)#2,215
3.980588.7%7.0%(+1.77)#734.9%(+3.84)#2,404
4.980557.0%7.0%(+0.025)#1054.9%(+2.09)#3,845
5.980576.3%7.0%(-0.623)#1284.9%(+1.45)#4,704

Common Questions

What are the Top 3 Zip Codes with the Highest Percentage of Population with a Degree in Computers and Mathematics in Renton, WA?
Top 3 Zip Codes with the Highest Percentage of Population with a Degree in Computers and Mathematics in Renton, WA are:
#1
10.6%
#2
9.1%
#3
8.7%
What zip code has the Highest Percentage of Population with a Degree in Computers and Mathematics in Renton, WA?
98059 has the Highest Percentage of Population with a Degree in Computers and Mathematics in Renton, WA with 10.6%.
What is the Percentage of Population with a Degree in Computers and Mathematics in Renton, WA?
Percentage of Population with a Degree in Computers and Mathematics in Renton is 8.8%.
What is the Percentage of Population with a Degree in Computers and Mathematics in Washington?
Percentage of Population with a Degree in Computers and Mathematics in Washington is 7.0%.
What is the Percentage of Population with a Degree in Computers and Mathematics in the United States?
Percentage of Population with a Degree in Computers and Mathematics in the United States is 4.9%.