Zip Codes with the Highest Percentage of Population with a Degree in Computers and Mathematics in Bellevue, WA

RELATED REPORTS & OPTIONS

Computers and Mathematics
Population
Families and Households
Female Fertility
Female Fertility (Unmarried)
Race (Community Size)
Race (Percentage)
Ancestry (Community Size)
AfricanAmericanApacheArabArgentineanArmenianAustralianAustrianBelgianBhutaneseBlackfeetBrazilianBritishBulgarianBurmeseCajunCanadianCentral AmericanCentral American IndianCherokeeChileanChoctawColombianCreeCroatianCubanCzechCzechoslovakianDanishDutchEastern EuropeanEcuadorianEgyptianEnglishEstonianEthiopianEuropeanFilipinoFinnishFrenchFrench CanadianGermanGhanaianGreekGuamanian / ChamorroGuatemalanHaitianHonduranHungarianIcelanderIndian (Asian)IranianIraqiIrishIsraeliItalianJamaicanJapaneseJordanianKenyanKoreanLaotianLatvianLebaneseLithuanianLuxembourgerMalaysianMexicanMexican American IndianMongolianMoroccanNative HawaiianNicaraguanNigerianNorthern EuropeanNorwegianOkinawanPakistaniPanamanianPennsylvania GermanPeruvianPolishPortuguesePuerto RicanPuget Sound SalishRomanianRussianSalvadoranSamoanScandinavianScotch-IrishScottishSerbianSiouxSlavicSlovakSloveneSomaliSouth AfricanSouth AmericanSouth American IndianSpaniardSpanishSri LankanSubsaharan AfricanSwedishSwissSyrianThaiTurkishUkrainianVietnameseWelshWest IndianYugoslavian
Ancestry (Percentage)
AfricanAmericanApacheArabArgentineanArmenianAustralianAustrianBelgianBhutaneseBlackfeetBrazilianBritishBulgarianBurmeseCajunCanadianCentral AmericanCentral American IndianCherokeeChileanChoctawColombianCreeCroatianCubanCzechCzechoslovakianDanishDutchEastern EuropeanEcuadorianEgyptianEnglishEstonianEthiopianEuropeanFilipinoFinnishFrenchFrench CanadianGermanGhanaianGreekGuamanian / ChamorroGuatemalanHaitianHonduranHungarianIcelanderIndian (Asian)IranianIraqiIrishIsraeliItalianJamaicanJapaneseJordanianKenyanKoreanLaotianLatvianLebaneseLithuanianLuxembourgerMalaysianMexicanMexican American IndianMongolianMoroccanNative HawaiianNicaraguanNigerianNorthern EuropeanNorwegianOkinawanPakistaniPanamanianPennsylvania GermanPeruvianPolishPortuguesePuerto RicanPuget Sound SalishRomanianRussianSalvadoranSamoanScandinavianScotch-IrishScottishSerbianSiouxSlavicSlovakSloveneSomaliSouth AfricanSouth AmericanSouth American IndianSpaniardSpanishSri LankanSubsaharan AfricanSwedishSwissSyrianThaiTurkishUkrainianVietnameseWelshWest IndianYugoslavian
Immigrant Origin (Total)
AfghanistanAfricaArgentinaArmeniaAsiaAustraliaAustriaBangladeshBelarusBelgiumBosnia and HerzegovinaBrazilBulgariaCambodiaCanadaCaribbeanCentral AmericaChileChinaColombiaCroatiaCubaCzechoslovakiaDenmarkEastern AfricaEastern AsiaEastern EuropeEgyptEl SalvadorEnglandEthiopiaEuropeFijiFranceGermanyGhanaGreeceGuatemalaGuyanaHondurasHong KongHungaryIndiaIndonesiaIranIraqIrelandIsraelItalyJamaicaJapanJordanKenyaKoreaLaosLatin AmericaLatviaLebanonLiberiaMalaysiaMexicoMoldovaMoroccoNepalNetherlandsNicaraguaNigeriaNorthern AfricaNorthern EuropeNorwayOceaniaPakistanPanamaPeruPhilippinesPolandPortugalRomaniaRussiaScotlandSingaporeSouth AfricaSouth AmericaSouth Central AsiaSouth Eastern AsiaSouthern EuropeSpainSwedenSwitzerlandTaiwanThailandTurkeyUgandaUkraineVietnamWestern AfricaWestern AsiaWestern Europe
Immigrant Origin (Percentage)
AfghanistanAfricaArgentinaArmeniaAsiaAustraliaAustriaBangladeshBelarusBelgiumBosnia and HerzegovinaBrazilBulgariaCambodiaCanadaCaribbeanCentral AmericaChileChinaColombiaCroatiaCubaCzechoslovakiaDenmarkEastern AfricaEastern AsiaEastern EuropeEgyptEl SalvadorEnglandEthiopiaEuropeFijiFranceGermanyGhanaGreeceGuatemalaGuyanaHondurasHong KongHungaryIndiaIndonesiaIranIraqIrelandIsraelItalyJamaicaJapanJordanKenyaKoreaLaosLatin AmericaLatviaLebanonLiberiaMalaysiaMexicoMoldovaMoroccoNepalNetherlandsNicaraguaNigeriaNorthern AfricaNorthern EuropeNorwayOceaniaPakistanPanamaPeruPhilippinesPolandPortugalRomaniaRussiaScotlandSingaporeSouth AfricaSouth AmericaSouth Central AsiaSouth Eastern AsiaSouthern EuropeSpainSwedenSwitzerlandTaiwanThailandTurkeyUgandaUkraineVietnamWestern AfricaWestern AsiaWestern Europe
Income
Income (Families)
Income (Households)
Poverty
Poverty (Families)
Unemployment
Employment Occupations
Employment Industries
Employer Class
Commute Time
Commute Means
School Enrollment
Education by Degree Field
Occupancy
Finances
Physical Characteristics
Bellevue
Compare Zip Codes
Comparison Subject

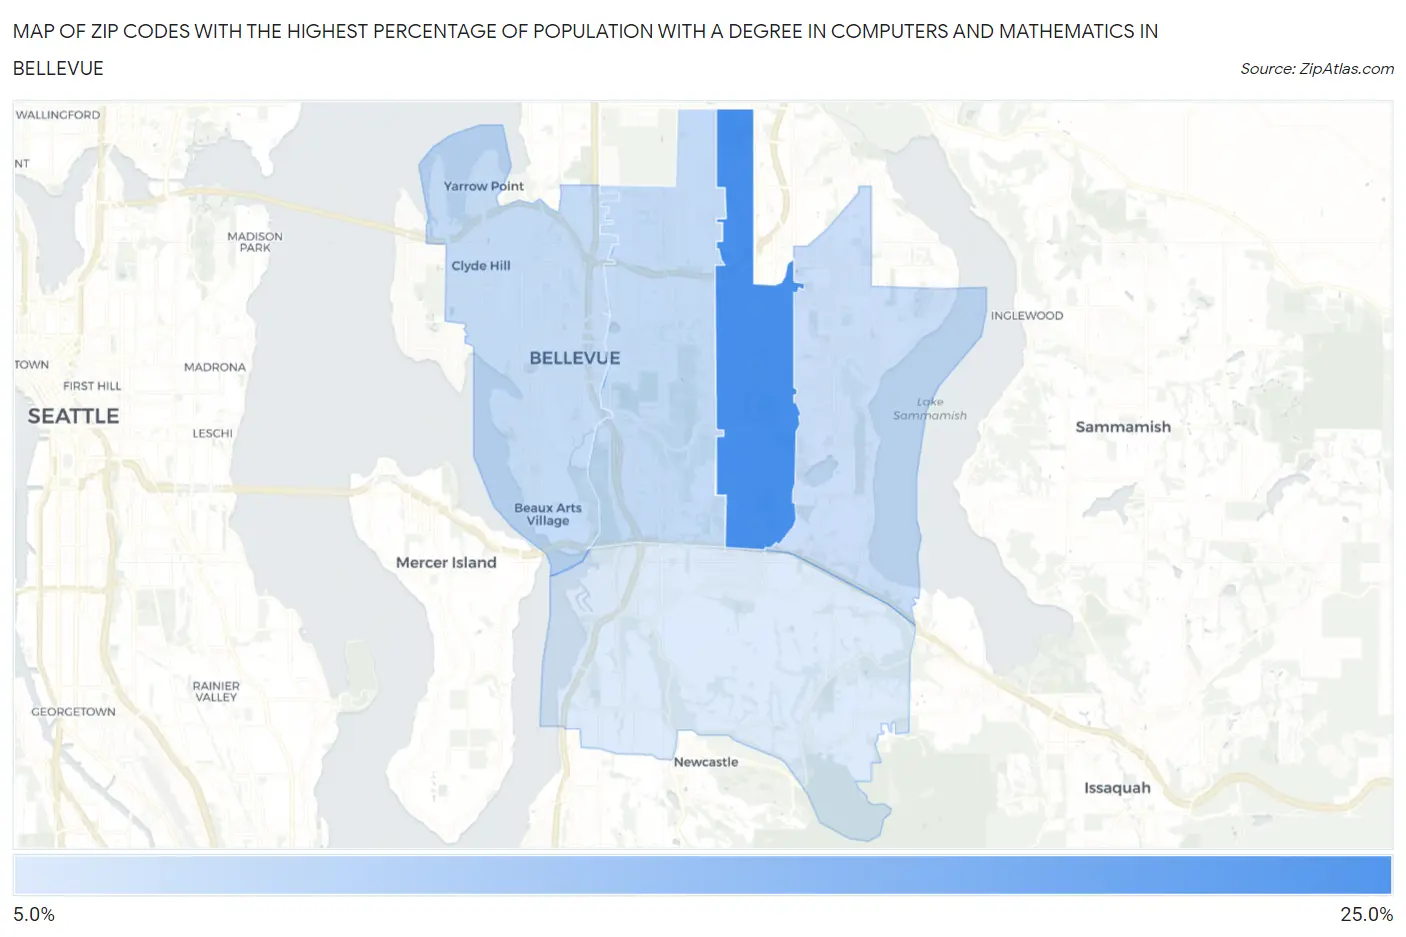
Map of Zip Codes with the Highest Percentage of Population with a Degree in Computers and Mathematics in Bellevue

0.0%
25.0%
Zip Codes with the Highest Percentage of Population with a Degree in Computers and Mathematics in Bellevue Map

Zip Codes with the Highest Percentage of Population with a Degree in Computers and Mathematics in Bellevue, WA

Zip Code % Graduates vs State vs National
1.9800723.1%7.0%(+16.1)#124.9%(+18.2)#362
2.9800515.6%7.0%(+8.64)#174.9%(+10.7)#739
3.9800415.5%7.0%(+8.49)#184.9%(+10.6)#746
4.9800815.2%7.0%(+8.19)#204.9%(+10.3)#772
5.9800614.1%7.0%(+7.11)#264.9%(+9.18)#899

Common Questions

What are the Top 3 Zip Codes with the Highest Percentage of Population with a Degree in Computers and Mathematics in Bellevue, WA?
Top 3 Zip Codes with the Highest Percentage of Population with a Degree in Computers and Mathematics in Bellevue, WA are:
#1
23.1%
#2
15.6%
#3
15.5%
What zip code has the Highest Percentage of Population with a Degree in Computers and Mathematics in Bellevue, WA?
98007 has the Highest Percentage of Population with a Degree in Computers and Mathematics in Bellevue, WA with 23.1%.
What is the Percentage of Population with a Degree in Computers and Mathematics in Bellevue, WA?
Percentage of Population with a Degree in Computers and Mathematics in Bellevue is 16.6%.
What is the Percentage of Population with a Degree in Computers and Mathematics in Washington?
Percentage of Population with a Degree in Computers and Mathematics in Washington is 7.0%.
What is the Percentage of Population with a Degree in Computers and Mathematics in the United States?
Percentage of Population with a Degree in Computers and Mathematics in the United States is 4.9%.