Navajo vs Austrian 4 or more Vehicles in Household
COMPARE
Navajo
Austrian
4 or more Vehicles in Household
4 or more Vehicles in Household Comparison
Navajo
Austrians
8.2%
4 OR MORE VEHICLES IN HOUSEHOLD
100.0/ 100
METRIC RATING
30th/ 347
METRIC RANK
6.8%
4 OR MORE VEHICLES IN HOUSEHOLD
94.1/ 100
METRIC RATING
125th/ 347
METRIC RANK
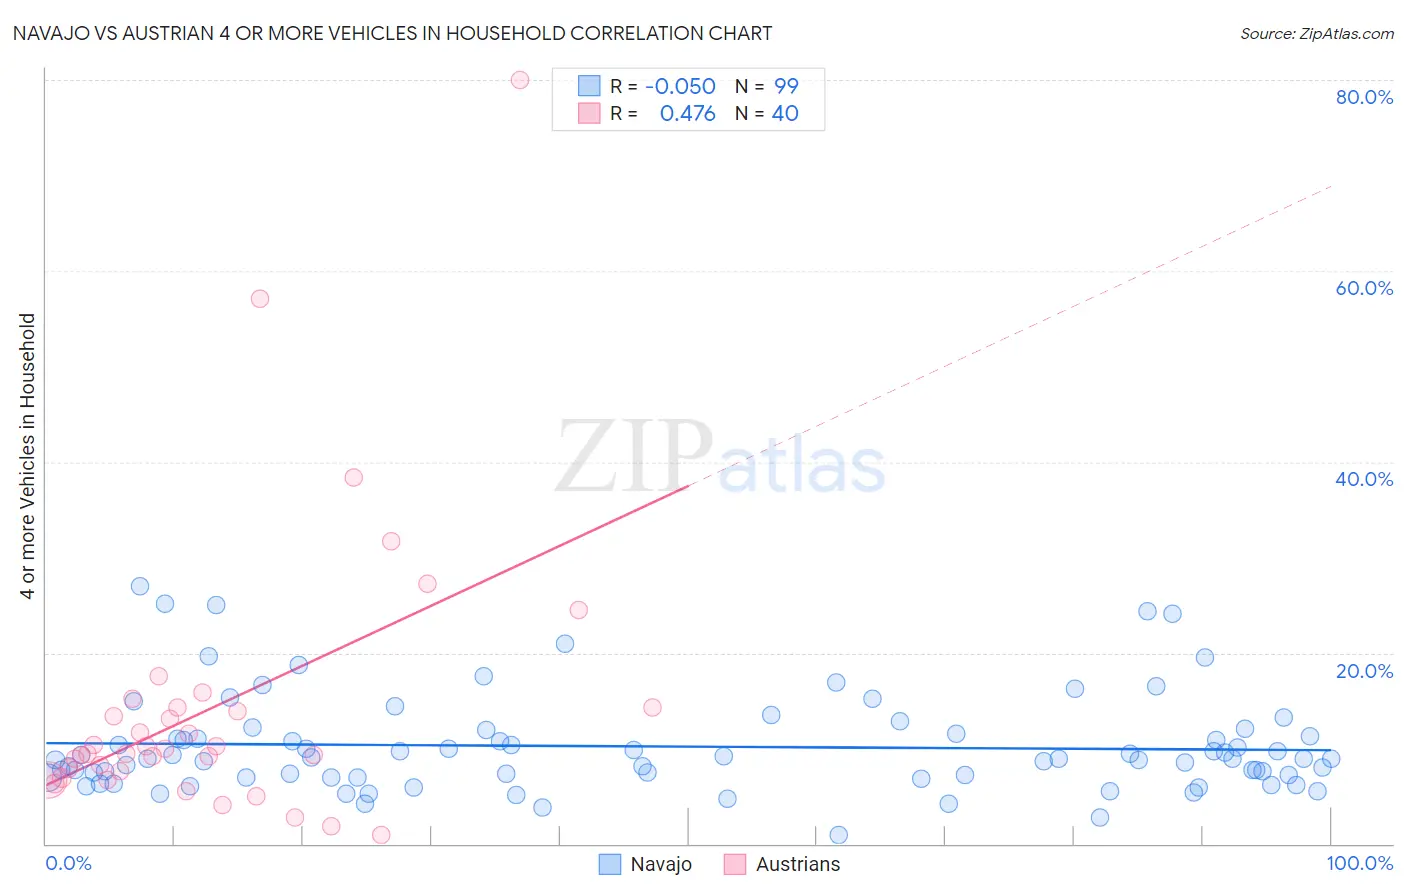
Navajo vs Austrian 4 or more Vehicles in Household Correlation Chart
The statistical analysis conducted on geographies consisting of 224,231,101 people shows a slight negative correlation between the proportion of Navajo and percentage of households with 4 or more vehicles available in the United States with a correlation coefficient (R) of -0.050 and weighted average of 8.2%. Similarly, the statistical analysis conducted on geographies consisting of 450,167,430 people shows a moderate positive correlation between the proportion of Austrians and percentage of households with 4 or more vehicles available in the United States with a correlation coefficient (R) of 0.476 and weighted average of 6.8%, a difference of 21.5%.
4 or more Vehicles in Household Correlation Summary
| Measurement | Navajo | Austrian |
| Minimum | 0.93% | 0.94% |
| Maximum | 26.9% | 80.0% |
| Range | 26.0% | 79.1% |
| Mean | 10.2% | 14.4% |
| Median | 8.9% | 9.7% |
| Interquartile 25% (IQ1) | 7.0% | 7.2% |
| Interquartile 75% (IQ3) | 11.6% | 14.3% |
| Interquartile Range (IQR) | 4.6% | 7.1% |
| Standard Deviation (Sample) | 5.1% | 14.9% |
| Standard Deviation (Population) | 5.1% | 14.7% |
Similar Demographics by 4 or more Vehicles in Household
Demographics Similar to Navajo by 4 or more Vehicles in Household
In terms of 4 or more vehicles in household, the demographic groups most similar to Navajo are Immigrants from South Eastern Asia (8.2%, a difference of 0.030%), Native/Alaskan (8.2%, a difference of 0.40%), Cheyenne (8.3%, a difference of 0.69%), Marshallese (8.1%, a difference of 0.94%), and Yaqui (8.1%, a difference of 1.2%).
| Demographics | Rating | Rank | 4 or more Vehicles in Household |
| Immigrants | Philippines | 100.0 /100 | #23 | Exceptional 8.5% |
| Immigrants | Central America | 100.0 /100 | #24 | Exceptional 8.5% |
| Basques | 100.0 /100 | #25 | Exceptional 8.4% |
| Mexican American Indians | 100.0 /100 | #26 | Exceptional 8.4% |
| Sri Lankans | 100.0 /100 | #27 | Exceptional 8.4% |
| Cheyenne | 100.0 /100 | #28 | Exceptional 8.3% |
| Immigrants | South Eastern Asia | 100.0 /100 | #29 | Exceptional 8.2% |
| Navajo | 100.0 /100 | #30 | Exceptional 8.2% |
| Natives/Alaskans | 100.0 /100 | #31 | Exceptional 8.2% |
| Marshallese | 100.0 /100 | #32 | Exceptional 8.1% |
| Yaqui | 100.0 /100 | #33 | Exceptional 8.1% |
| Alaskan Athabascans | 100.0 /100 | #34 | Exceptional 8.1% |
| Guamanians/Chamorros | 100.0 /100 | #35 | Exceptional 8.1% |
| Norwegians | 100.0 /100 | #36 | Exceptional 8.0% |
| Scandinavians | 100.0 /100 | #37 | Exceptional 8.0% |
Demographics Similar to Austrians by 4 or more Vehicles in Household
In terms of 4 or more vehicles in household, the demographic groups most similar to Austrians are Belgian (6.8%, a difference of 0.010%), Immigrants from Asia (6.8%, a difference of 0.10%), Immigrants from Korea (6.8%, a difference of 0.13%), Immigrants (6.8%, a difference of 0.19%), and Immigrants from Germany (6.8%, a difference of 0.26%).
| Demographics | Rating | Rank | 4 or more Vehicles in Household |
| French American Indians | 95.7 /100 | #118 | Exceptional 6.8% |
| Costa Ricans | 95.5 /100 | #119 | Exceptional 6.8% |
| Comanche | 94.8 /100 | #120 | Exceptional 6.8% |
| Immigrants | Germany | 94.7 /100 | #121 | Exceptional 6.8% |
| Immigrants | Nicaragua | 94.7 /100 | #122 | Exceptional 6.8% |
| Immigrants | Immigrants | 94.6 /100 | #123 | Exceptional 6.8% |
| Immigrants | Asia | 94.4 /100 | #124 | Exceptional 6.8% |
| Austrians | 94.1 /100 | #125 | Exceptional 6.8% |
| Belgians | 94.1 /100 | #126 | Exceptional 6.8% |
| Immigrants | Korea | 93.8 /100 | #127 | Exceptional 6.8% |
| Immigrants | Bolivia | 92.5 /100 | #128 | Exceptional 6.7% |
| Immigrants | England | 92.0 /100 | #129 | Exceptional 6.7% |
| Immigrants | Scotland | 89.0 /100 | #130 | Excellent 6.7% |
| Maltese | 88.4 /100 | #131 | Excellent 6.7% |
| Immigrants | Netherlands | 87.8 /100 | #132 | Excellent 6.6% |