Immigrants from Uruguay vs Scottish 2 or more Vehicles in Household
COMPARE
Immigrants from Uruguay
Scottish
2 or more Vehicles in Household
2 or more Vehicles in Household Comparison
Immigrants from Uruguay
Scottish
51.4%
2 OR MORE VEHICLES IN HOUSEHOLD
0.1/ 100
METRIC RATING
285th/ 347
METRIC RANK
61.2%
2 OR MORE VEHICLES IN HOUSEHOLD
100.0/ 100
METRIC RATING
19th/ 347
METRIC RANK
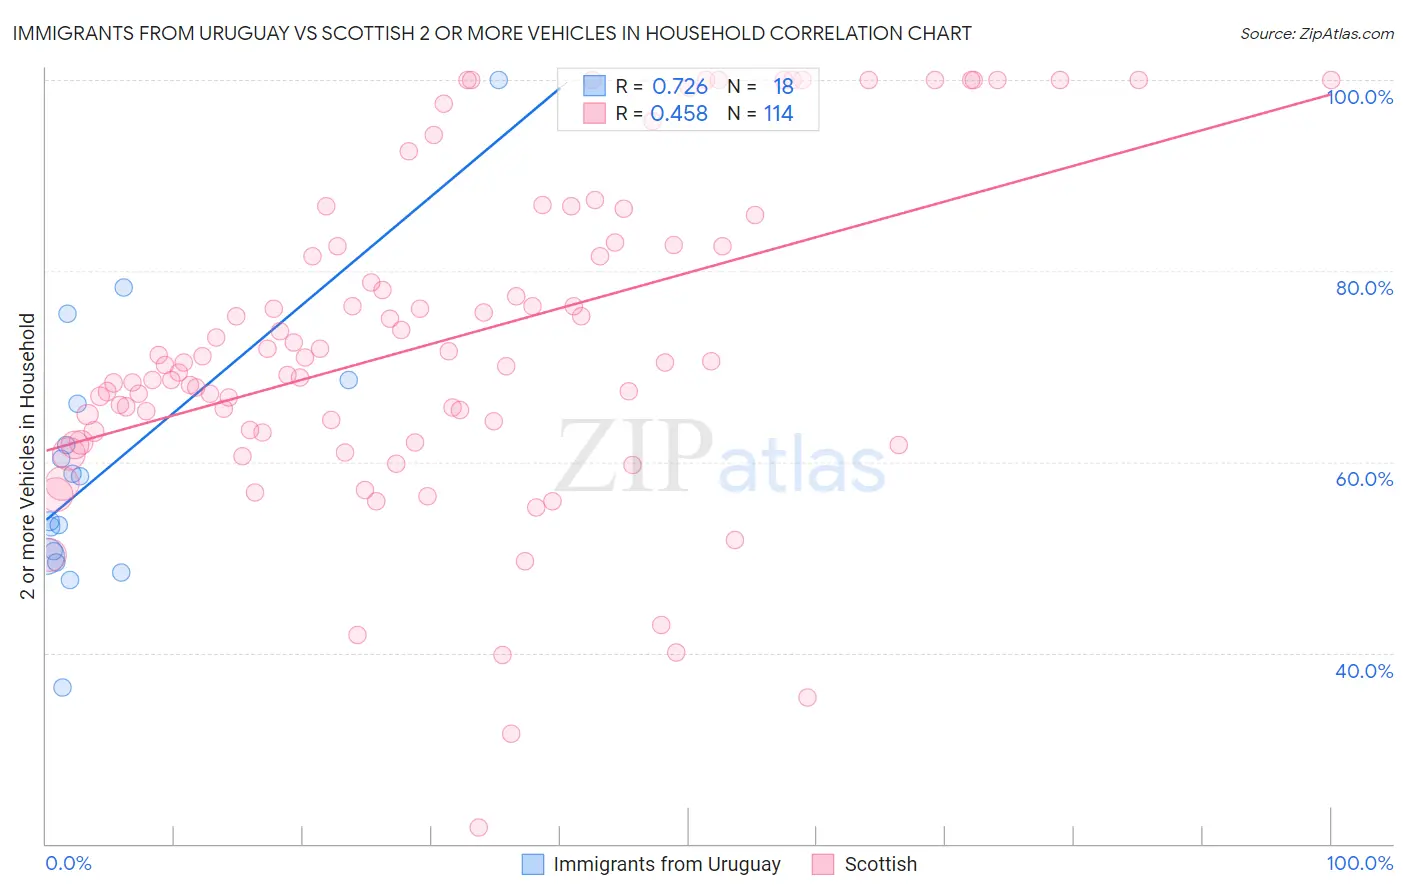
Immigrants from Uruguay vs Scottish 2 or more Vehicles in Household Correlation Chart
The statistical analysis conducted on geographies consisting of 133,245,142 people shows a strong positive correlation between the proportion of Immigrants from Uruguay and percentage of households with 2 or more vehicles available in the United States with a correlation coefficient (R) of 0.726 and weighted average of 51.4%. Similarly, the statistical analysis conducted on geographies consisting of 566,626,490 people shows a moderate positive correlation between the proportion of Scottish and percentage of households with 2 or more vehicles available in the United States with a correlation coefficient (R) of 0.458 and weighted average of 61.2%, a difference of 19.2%.
2 or more Vehicles in Household Correlation Summary
| Measurement | Immigrants from Uruguay | Scottish |
| Minimum | 36.3% | 21.7% |
| Maximum | 100.0% | 100.0% |
| Range | 63.7% | 78.3% |
| Mean | 59.5% | 72.7% |
| Median | 56.2% | 70.5% |
| Interquartile 25% (IQ1) | 50.1% | 63.2% |
| Interquartile 75% (IQ3) | 66.0% | 82.8% |
| Interquartile Range (IQR) | 16.0% | 19.6% |
| Standard Deviation (Sample) | 14.5% | 16.9% |
| Standard Deviation (Population) | 14.1% | 16.8% |
Similar Demographics by 2 or more Vehicles in Household
Demographics Similar to Immigrants from Uruguay by 2 or more Vehicles in Household
In terms of 2 or more vehicles in household, the demographic groups most similar to Immigrants from Uruguay are Immigrants from Liberia (51.3%, a difference of 0.14%), Immigrants from Zaire (51.5%, a difference of 0.16%), Immigrants from Serbia (51.3%, a difference of 0.17%), Immigrants from China (51.5%, a difference of 0.20%), and Bahamian (51.5%, a difference of 0.28%).
| Demographics | Rating | Rank | 2 or more Vehicles in Household |
| Yuman | 0.1 /100 | #278 | Tragic 51.7% |
| Liberians | 0.1 /100 | #279 | Tragic 51.7% |
| Immigrants | Eastern Europe | 0.1 /100 | #280 | Tragic 51.7% |
| Immigrants | Kazakhstan | 0.1 /100 | #281 | Tragic 51.6% |
| Bahamians | 0.1 /100 | #282 | Tragic 51.5% |
| Immigrants | China | 0.1 /100 | #283 | Tragic 51.5% |
| Immigrants | Zaire | 0.1 /100 | #284 | Tragic 51.5% |
| Immigrants | Uruguay | 0.1 /100 | #285 | Tragic 51.4% |
| Immigrants | Liberia | 0.1 /100 | #286 | Tragic 51.3% |
| Immigrants | Serbia | 0.1 /100 | #287 | Tragic 51.3% |
| Okinawans | 0.1 /100 | #288 | Tragic 51.2% |
| Somalis | 0.0 /100 | #289 | Tragic 51.1% |
| Immigrants | Panama | 0.0 /100 | #290 | Tragic 51.1% |
| Belizeans | 0.0 /100 | #291 | Tragic 51.0% |
| Immigrants | Ukraine | 0.0 /100 | #292 | Tragic 50.9% |
Demographics Similar to Scottish by 2 or more Vehicles in Household
In terms of 2 or more vehicles in household, the demographic groups most similar to Scottish are European (61.4%, a difference of 0.20%), Basque (61.4%, a difference of 0.22%), Native Hawaiian (61.4%, a difference of 0.28%), Nepalese (61.4%, a difference of 0.31%), and Sri Lankan (61.0%, a difference of 0.35%).
| Demographics | Rating | Rank | 2 or more Vehicles in Household |
| Germans | 100.0 /100 | #12 | Exceptional 61.6% |
| Samoans | 100.0 /100 | #13 | Exceptional 61.5% |
| Czechs | 100.0 /100 | #14 | Exceptional 61.5% |
| Nepalese | 100.0 /100 | #15 | Exceptional 61.4% |
| Native Hawaiians | 100.0 /100 | #16 | Exceptional 61.4% |
| Basques | 100.0 /100 | #17 | Exceptional 61.4% |
| Europeans | 100.0 /100 | #18 | Exceptional 61.4% |
| Scottish | 100.0 /100 | #19 | Exceptional 61.2% |
| Sri Lankans | 100.0 /100 | #20 | Exceptional 61.0% |
| Koreans | 100.0 /100 | #21 | Exceptional 61.0% |
| Swiss | 100.0 /100 | #22 | Exceptional 61.0% |
| Scotch-Irish | 100.0 /100 | #23 | Exceptional 60.9% |
| Immigrants | Vietnam | 100.0 /100 | #24 | Exceptional 60.9% |
| Whites/Caucasians | 100.0 /100 | #25 | Exceptional 60.8% |
| Welsh | 100.0 /100 | #26 | Exceptional 60.8% |