Immigrants from Moldova vs Welsh 2 or more Vehicles in Household
COMPARE
Immigrants from Moldova
Welsh
2 or more Vehicles in Household
2 or more Vehicles in Household Comparison
Immigrants from Moldova
Welsh
56.1%
2 OR MORE VEHICLES IN HOUSEHOLD
80.2/ 100
METRIC RATING
148th/ 347
METRIC RANK
60.8%
2 OR MORE VEHICLES IN HOUSEHOLD
100.0/ 100
METRIC RATING
26th/ 347
METRIC RANK
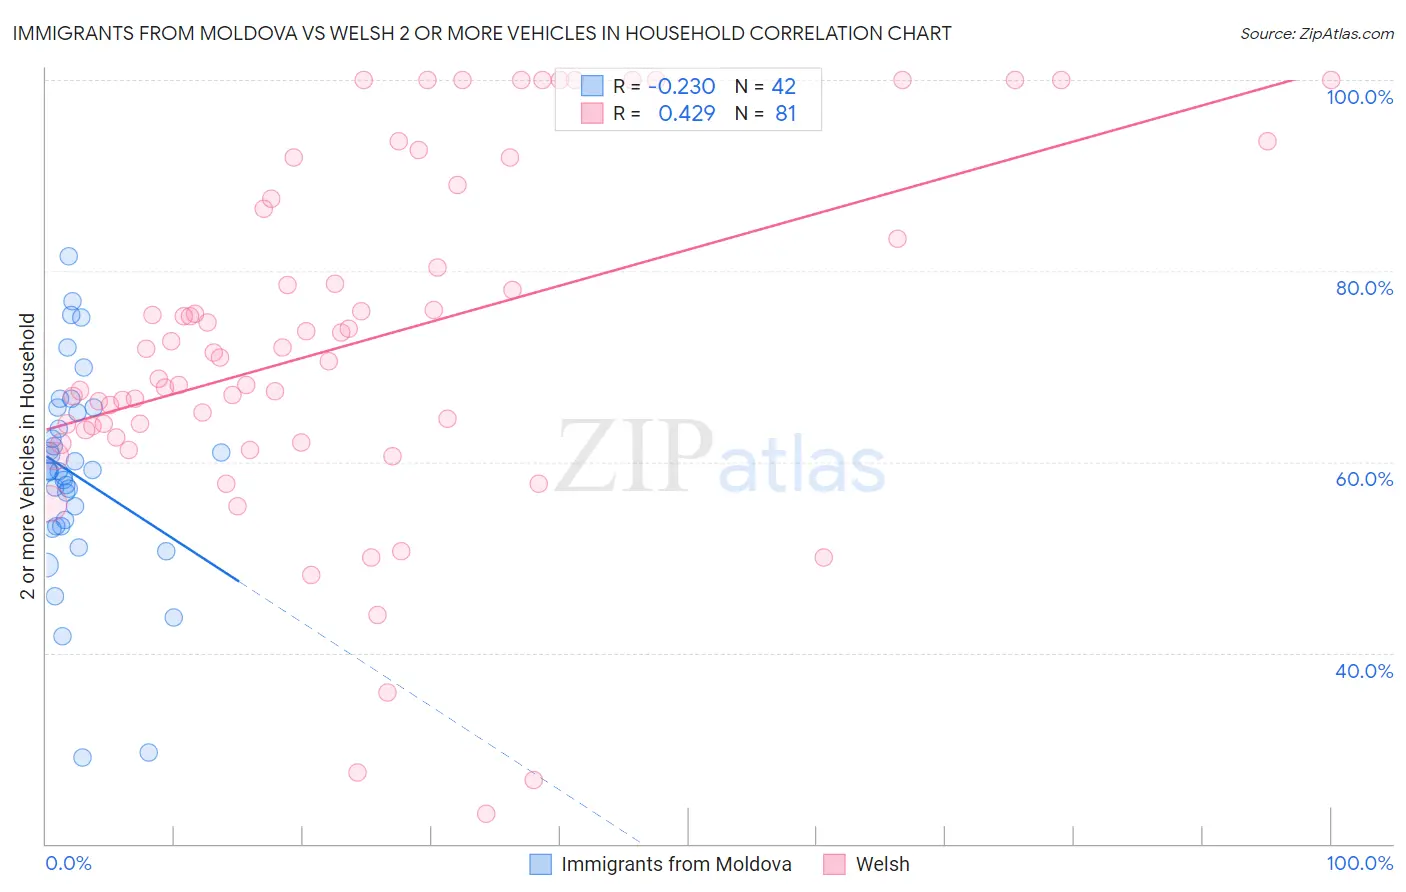
Immigrants from Moldova vs Welsh 2 or more Vehicles in Household Correlation Chart
The statistical analysis conducted on geographies consisting of 124,285,245 people shows a weak negative correlation between the proportion of Immigrants from Moldova and percentage of households with 2 or more vehicles available in the United States with a correlation coefficient (R) of -0.230 and weighted average of 56.1%. Similarly, the statistical analysis conducted on geographies consisting of 528,240,215 people shows a moderate positive correlation between the proportion of Welsh and percentage of households with 2 or more vehicles available in the United States with a correlation coefficient (R) of 0.429 and weighted average of 60.8%, a difference of 8.3%.
2 or more Vehicles in Household Correlation Summary
| Measurement | Immigrants from Moldova | Welsh |
| Minimum | 29.0% | 23.1% |
| Maximum | 81.6% | 100.0% |
| Range | 52.5% | 76.9% |
| Mean | 58.6% | 72.5% |
| Median | 59.0% | 70.9% |
| Interquartile 25% (IQ1) | 53.2% | 62.9% |
| Interquartile 75% (IQ3) | 65.1% | 87.0% |
| Interquartile Range (IQR) | 11.9% | 24.1% |
| Standard Deviation (Sample) | 10.8% | 18.2% |
| Standard Deviation (Population) | 10.7% | 18.1% |
Similar Demographics by 2 or more Vehicles in Household
Demographics Similar to Immigrants from Moldova by 2 or more Vehicles in Household
In terms of 2 or more vehicles in household, the demographic groups most similar to Immigrants from Moldova are Serbian (56.1%, a difference of 0.0%), Chilean (56.1%, a difference of 0.0%), Nicaraguan (56.1%, a difference of 0.020%), Venezuelan (56.1%, a difference of 0.030%), and Syrian (56.2%, a difference of 0.060%).
| Demographics | Rating | Rank | 2 or more Vehicles in Household |
| Immigrants | Cambodia | 83.6 /100 | #141 | Excellent 56.2% |
| South Africans | 83.1 /100 | #142 | Excellent 56.2% |
| Seminole | 81.7 /100 | #143 | Excellent 56.2% |
| Immigrants | Syria | 81.4 /100 | #144 | Excellent 56.2% |
| Syrians | 81.2 /100 | #145 | Excellent 56.2% |
| Venezuelans | 80.7 /100 | #146 | Excellent 56.1% |
| Serbians | 80.3 /100 | #147 | Excellent 56.1% |
| Immigrants | Moldova | 80.2 /100 | #148 | Excellent 56.1% |
| Chileans | 80.2 /100 | #149 | Excellent 56.1% |
| Nicaraguans | 79.9 /100 | #150 | Good 56.1% |
| Immigrants | Northern Europe | 78.7 /100 | #151 | Good 56.1% |
| Immigrants | Pakistan | 78.1 /100 | #152 | Good 56.1% |
| Lumbee | 71.9 /100 | #153 | Good 55.9% |
| Ukrainians | 70.8 /100 | #154 | Good 55.8% |
| Immigrants | Venezuela | 70.7 /100 | #155 | Good 55.8% |
Demographics Similar to Welsh by 2 or more Vehicles in Household
In terms of 2 or more vehicles in household, the demographic groups most similar to Welsh are White/Caucasian (60.8%, a difference of 0.050%), Immigrants from Vietnam (60.9%, a difference of 0.20%), Scotch-Irish (60.9%, a difference of 0.24%), Swiss (61.0%, a difference of 0.28%), and Korean (61.0%, a difference of 0.31%).
| Demographics | Rating | Rank | 2 or more Vehicles in Household |
| Scottish | 100.0 /100 | #19 | Exceptional 61.2% |
| Sri Lankans | 100.0 /100 | #20 | Exceptional 61.0% |
| Koreans | 100.0 /100 | #21 | Exceptional 61.0% |
| Swiss | 100.0 /100 | #22 | Exceptional 61.0% |
| Scotch-Irish | 100.0 /100 | #23 | Exceptional 60.9% |
| Immigrants | Vietnam | 100.0 /100 | #24 | Exceptional 60.9% |
| Whites/Caucasians | 100.0 /100 | #25 | Exceptional 60.8% |
| Welsh | 100.0 /100 | #26 | Exceptional 60.8% |
| Assyrians/Chaldeans/Syriacs | 100.0 /100 | #27 | Exceptional 60.5% |
| Guamanians/Chamorros | 100.0 /100 | #28 | Exceptional 60.5% |
| Hawaiians | 100.0 /100 | #29 | Exceptional 60.4% |
| Finns | 100.0 /100 | #30 | Exceptional 60.3% |
| Spanish American Indians | 100.0 /100 | #31 | Exceptional 60.3% |
| Arapaho | 100.0 /100 | #32 | Exceptional 60.2% |
| Immigrants | Mexico | 100.0 /100 | #33 | Exceptional 60.2% |