Honduran vs Immigrants from Grenada 4 or more Vehicles in Household
COMPARE
Honduran
Immigrants from Grenada
4 or more Vehicles in Household
4 or more Vehicles in Household Comparison
Hondurans
Immigrants from Grenada
6.1%
4 OR MORE VEHICLES IN HOUSEHOLD
19.3/ 100
METRIC RATING
205th/ 347
METRIC RANK
2.7%
4 OR MORE VEHICLES IN HOUSEHOLD
0.0/ 100
METRIC RATING
347th/ 347
METRIC RANK
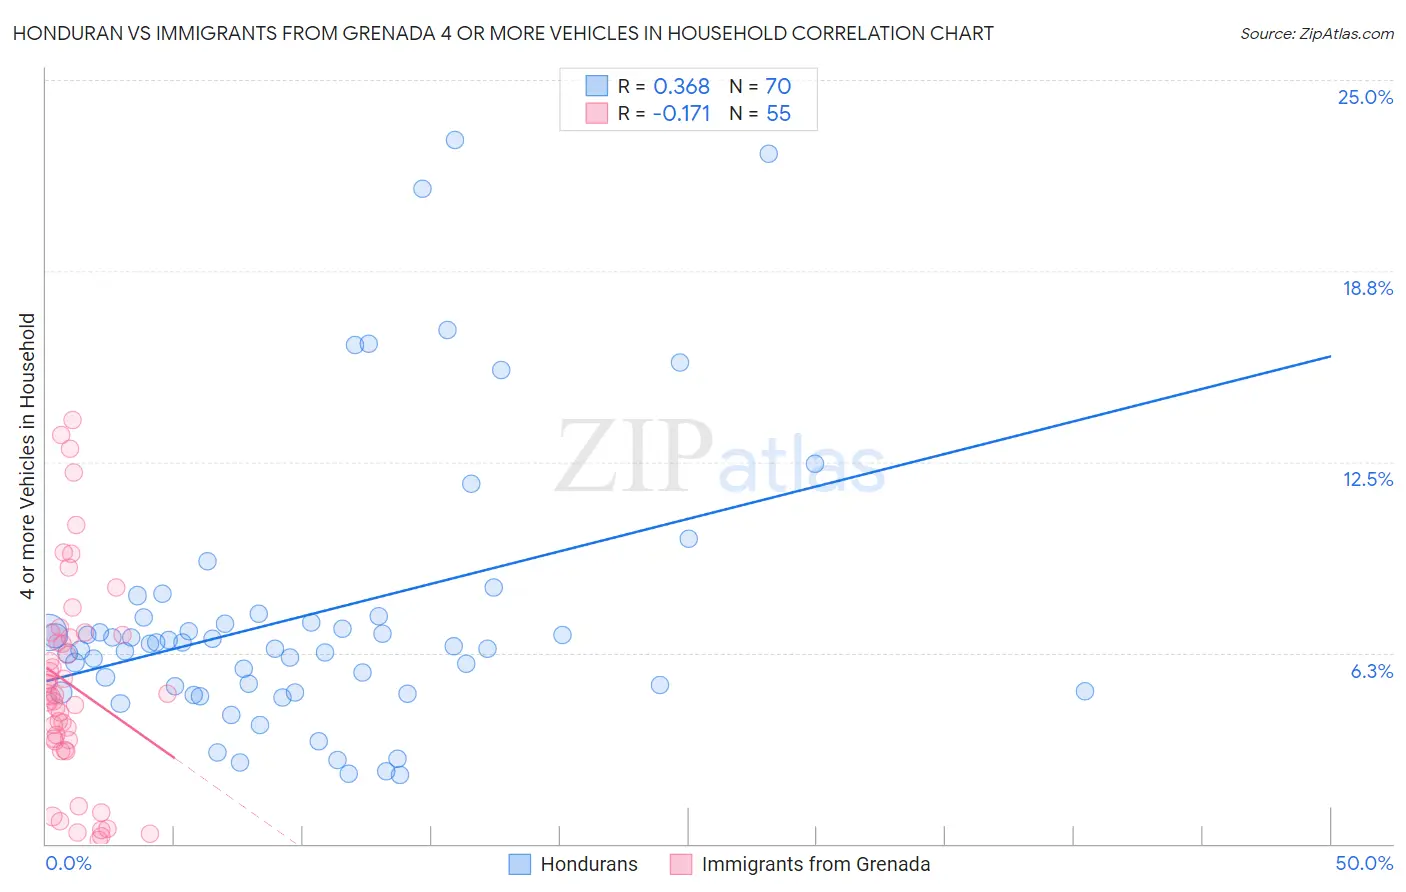
Honduran vs Immigrants from Grenada 4 or more Vehicles in Household Correlation Chart
The statistical analysis conducted on geographies consisting of 356,171,114 people shows a mild positive correlation between the proportion of Hondurans and percentage of households with 4 or more vehicles available in the United States with a correlation coefficient (R) of 0.368 and weighted average of 6.1%. Similarly, the statistical analysis conducted on geographies consisting of 66,738,845 people shows a poor negative correlation between the proportion of Immigrants from Grenada and percentage of households with 4 or more vehicles available in the United States with a correlation coefficient (R) of -0.171 and weighted average of 2.7%, a difference of 122.8%.
4 or more Vehicles in Household Correlation Summary
| Measurement | Honduran | Immigrants from Grenada |
| Minimum | 2.2% | 0.11% |
| Maximum | 23.0% | 13.9% |
| Range | 20.8% | 13.8% |
| Mean | 7.5% | 5.2% |
| Median | 6.5% | 4.9% |
| Interquartile 25% (IQ1) | 5.0% | 3.4% |
| Interquartile 75% (IQ3) | 7.4% | 6.9% |
| Interquartile Range (IQR) | 2.4% | 3.5% |
| Standard Deviation (Sample) | 4.5% | 3.4% |
| Standard Deviation (Population) | 4.5% | 3.3% |
Similar Demographics by 4 or more Vehicles in Household
Demographics Similar to Hondurans by 4 or more Vehicles in Household
In terms of 4 or more vehicles in household, the demographic groups most similar to Hondurans are Immigrants from Belize (6.1%, a difference of 0.090%), Kenyan (6.1%, a difference of 0.14%), Immigrants from Sierra Leone (6.1%, a difference of 0.19%), Immigrants from South Central Asia (6.1%, a difference of 0.33%), and Egyptian (6.1%, a difference of 0.34%).
| Demographics | Rating | Rank | 4 or more Vehicles in Household |
| Immigrants | Portugal | 22.3 /100 | #198 | Fair 6.1% |
| Immigrants | Norway | 21.8 /100 | #199 | Fair 6.1% |
| Latvians | 21.7 /100 | #200 | Fair 6.1% |
| Egyptians | 21.4 /100 | #201 | Fair 6.1% |
| Immigrants | South Central Asia | 21.3 /100 | #202 | Fair 6.1% |
| Immigrants | Sierra Leone | 20.5 /100 | #203 | Fair 6.1% |
| Immigrants | Belize | 19.8 /100 | #204 | Poor 6.1% |
| Hondurans | 19.3 /100 | #205 | Poor 6.1% |
| Kenyans | 18.5 /100 | #206 | Poor 6.1% |
| Immigrants | Chile | 16.9 /100 | #207 | Poor 6.1% |
| Immigrants | Nigeria | 15.6 /100 | #208 | Poor 6.1% |
| Immigrants | Honduras | 15.4 /100 | #209 | Poor 6.1% |
| Immigrants | Zimbabwe | 15.1 /100 | #210 | Poor 6.0% |
| Panamanians | 14.8 /100 | #211 | Poor 6.0% |
| Immigrants | Egypt | 14.7 /100 | #212 | Poor 6.0% |
Demographics Similar to Immigrants from Grenada by 4 or more Vehicles in Household
In terms of 4 or more vehicles in household, the demographic groups most similar to Immigrants from Grenada are Immigrants from St. Vincent and the Grenadines (3.0%, a difference of 8.5%), Immigrants from Dominican Republic (3.3%, a difference of 19.4%), Immigrants from Guyana (3.4%, a difference of 24.2%), British West Indian (3.5%, a difference of 26.2%), and Guyanese (3.5%, a difference of 27.4%).
| Demographics | Rating | Rank | 4 or more Vehicles in Household |
| Immigrants | Albania | 0.0 /100 | #333 | Tragic 4.1% |
| Immigrants | Trinidad and Tobago | 0.0 /100 | #334 | Tragic 4.1% |
| Barbadians | 0.0 /100 | #335 | Tragic 3.9% |
| Immigrants | Bangladesh | 0.0 /100 | #336 | Tragic 3.9% |
| Vietnamese | 0.0 /100 | #337 | Tragic 3.9% |
| Immigrants | Cabo Verde | 0.0 /100 | #338 | Tragic 3.8% |
| Immigrants | Uzbekistan | 0.0 /100 | #339 | Tragic 3.6% |
| Immigrants | Barbados | 0.0 /100 | #340 | Tragic 3.6% |
| Dominicans | 0.0 /100 | #341 | Tragic 3.5% |
| Guyanese | 0.0 /100 | #342 | Tragic 3.5% |
| British West Indians | 0.0 /100 | #343 | Tragic 3.5% |
| Immigrants | Guyana | 0.0 /100 | #344 | Tragic 3.4% |
| Immigrants | Dominican Republic | 0.0 /100 | #345 | Tragic 3.3% |
| Immigrants | St. Vincent and the Grenadines | 0.0 /100 | #346 | Tragic 3.0% |
| Immigrants | Grenada | 0.0 /100 | #347 | Tragic 2.7% |