Honduran vs Immigrants from South Africa 4 or more Vehicles in Household
COMPARE
Honduran
Immigrants from South Africa
4 or more Vehicles in Household
4 or more Vehicles in Household Comparison
Hondurans
Immigrants from South Africa
6.1%
4 OR MORE VEHICLES IN HOUSEHOLD
19.3/ 100
METRIC RATING
205th/ 347
METRIC RANK
6.2%
4 OR MORE VEHICLES IN HOUSEHOLD
35.4/ 100
METRIC RATING
187th/ 347
METRIC RANK
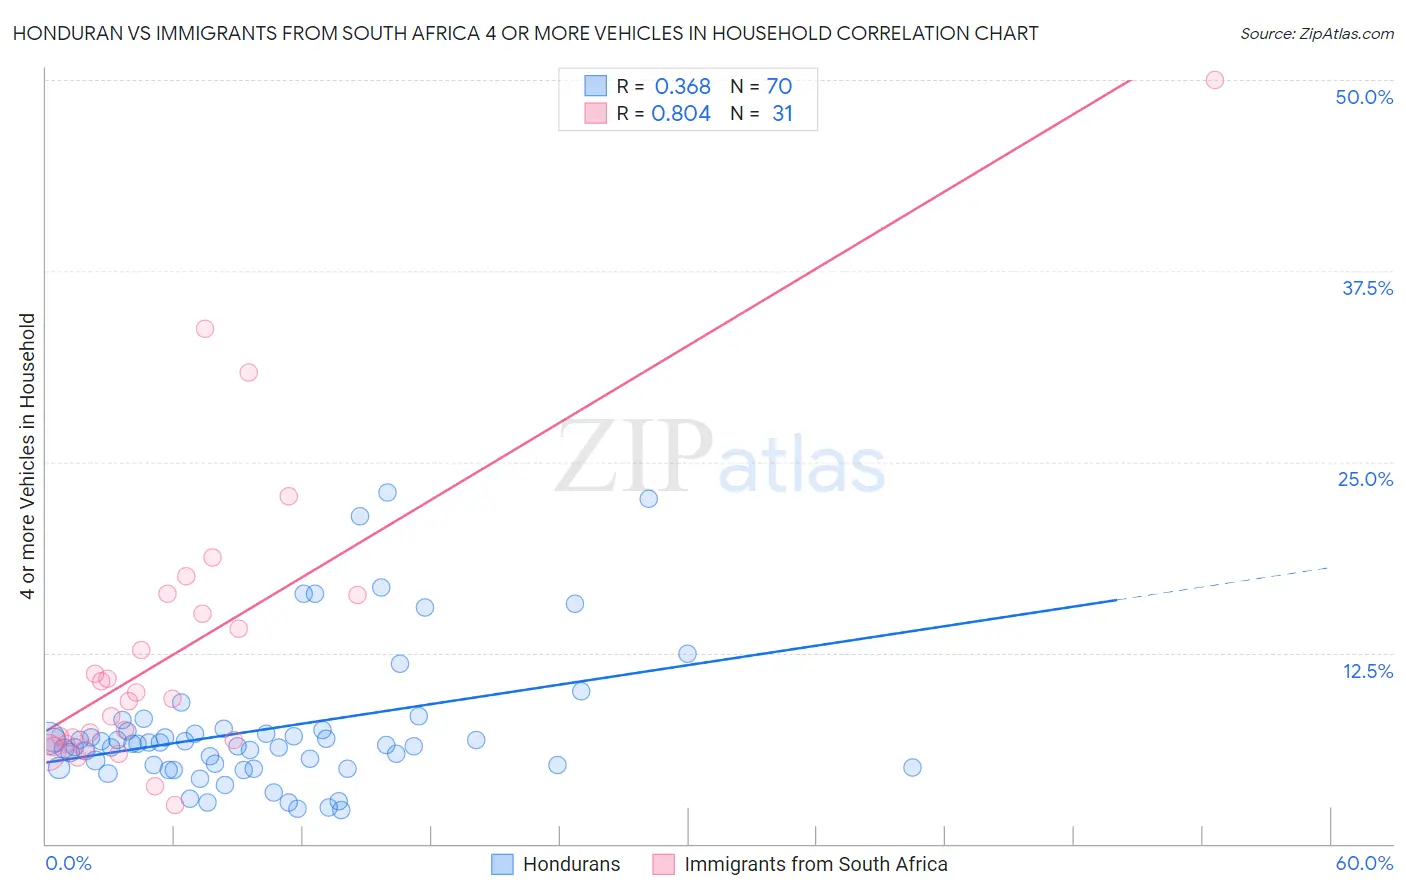
Honduran vs Immigrants from South Africa 4 or more Vehicles in Household Correlation Chart
The statistical analysis conducted on geographies consisting of 356,171,114 people shows a mild positive correlation between the proportion of Hondurans and percentage of households with 4 or more vehicles available in the United States with a correlation coefficient (R) of 0.368 and weighted average of 6.1%. Similarly, the statistical analysis conducted on geographies consisting of 232,301,901 people shows a very strong positive correlation between the proportion of Immigrants from South Africa and percentage of households with 4 or more vehicles available in the United States with a correlation coefficient (R) of 0.804 and weighted average of 6.2%, a difference of 2.2%.
4 or more Vehicles in Household Correlation Summary
| Measurement | Honduran | Immigrants from South Africa |
| Minimum | 2.2% | 2.6% |
| Maximum | 23.0% | 50.0% |
| Range | 20.8% | 47.4% |
| Mean | 7.5% | 12.8% |
| Median | 6.5% | 9.5% |
| Interquartile 25% (IQ1) | 5.0% | 6.6% |
| Interquartile 75% (IQ3) | 7.4% | 16.3% |
| Interquartile Range (IQR) | 2.4% | 9.7% |
| Standard Deviation (Sample) | 4.5% | 10.0% |
| Standard Deviation (Population) | 4.5% | 9.9% |
Demographics Similar to Hondurans and Immigrants from South Africa by 4 or more Vehicles in Household
In terms of 4 or more vehicles in household, the demographic groups most similar to Hondurans are Immigrants from Belize (6.1%, a difference of 0.090%), Kenyan (6.1%, a difference of 0.14%), Immigrants from Sierra Leone (6.1%, a difference of 0.19%), Immigrants from South Central Asia (6.1%, a difference of 0.33%), and Egyptian (6.1%, a difference of 0.34%). Similarly, the demographic groups most similar to Immigrants from South Africa are Kiowa (6.2%, a difference of 0.070%), Immigrants from Northern Europe (6.2%, a difference of 0.15%), Immigrants from Eastern Asia (6.2%, a difference of 0.24%), South African (6.2%, a difference of 0.36%), and Inupiat (6.2%, a difference of 0.54%).
| Demographics | Rating | Rank | 4 or more Vehicles in Household |
| Immigrants | Northern Europe | 36.8 /100 | #186 | Fair 6.2% |
| Immigrants | South Africa | 35.4 /100 | #187 | Fair 6.2% |
| Kiowa | 34.7 /100 | #188 | Fair 6.2% |
| Immigrants | Eastern Asia | 33.3 /100 | #189 | Fair 6.2% |
| South Africans | 32.2 /100 | #190 | Fair 6.2% |
| Inupiat | 30.7 /100 | #191 | Fair 6.2% |
| Romanians | 30.7 /100 | #192 | Fair 6.2% |
| Immigrants | Kuwait | 28.0 /100 | #193 | Fair 6.2% |
| Immigrants | Sweden | 27.0 /100 | #194 | Fair 6.2% |
| Argentineans | 27.0 /100 | #195 | Fair 6.2% |
| Tsimshian | 26.4 /100 | #196 | Fair 6.2% |
| Immigrants | Sri Lanka | 23.7 /100 | #197 | Fair 6.1% |
| Immigrants | Portugal | 22.3 /100 | #198 | Fair 6.1% |
| Immigrants | Norway | 21.8 /100 | #199 | Fair 6.1% |
| Latvians | 21.7 /100 | #200 | Fair 6.1% |
| Egyptians | 21.4 /100 | #201 | Fair 6.1% |
| Immigrants | South Central Asia | 21.3 /100 | #202 | Fair 6.1% |
| Immigrants | Sierra Leone | 20.5 /100 | #203 | Fair 6.1% |
| Immigrants | Belize | 19.8 /100 | #204 | Poor 6.1% |
| Hondurans | 19.3 /100 | #205 | Poor 6.1% |
| Kenyans | 18.5 /100 | #206 | Poor 6.1% |