Estonian vs Creek 2 or more Vehicles in Household
COMPARE
Estonian
Creek
2 or more Vehicles in Household
2 or more Vehicles in Household Comparison
Estonians
Creek
56.6%
2 OR MORE VEHICLES IN HOUSEHOLD
90.9/ 100
METRIC RATING
126th/ 347
METRIC RANK
58.3%
2 OR MORE VEHICLES IN HOUSEHOLD
99.5/ 100
METRIC RATING
76th/ 347
METRIC RANK
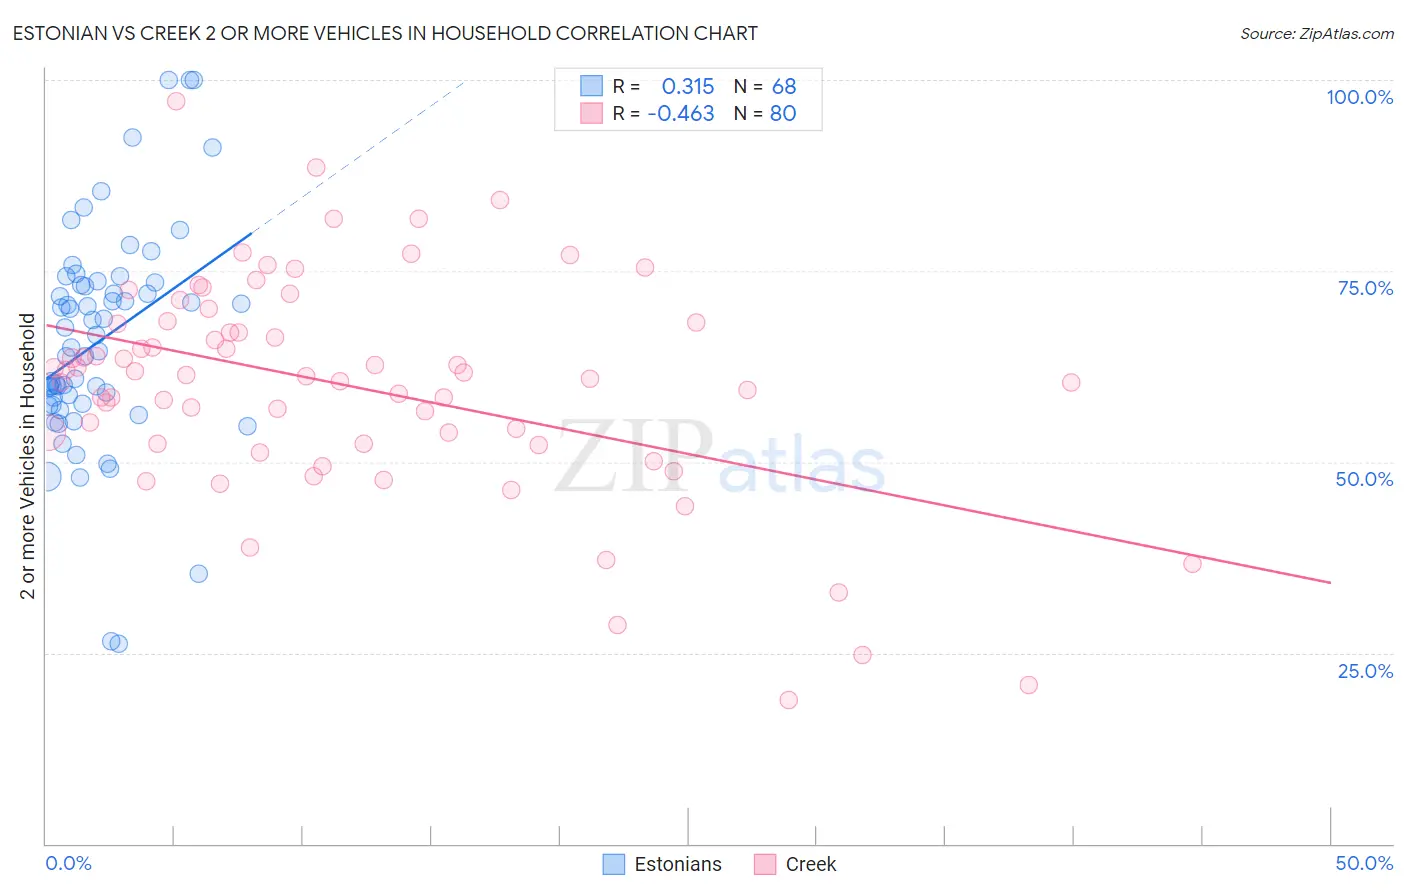
Estonian vs Creek 2 or more Vehicles in Household Correlation Chart
The statistical analysis conducted on geographies consisting of 123,500,786 people shows a mild positive correlation between the proportion of Estonians and percentage of households with 2 or more vehicles available in the United States with a correlation coefficient (R) of 0.315 and weighted average of 56.6%. Similarly, the statistical analysis conducted on geographies consisting of 178,443,711 people shows a moderate negative correlation between the proportion of Creek and percentage of households with 2 or more vehicles available in the United States with a correlation coefficient (R) of -0.463 and weighted average of 58.3%, a difference of 2.9%.
2 or more Vehicles in Household Correlation Summary
| Measurement | Estonian | Creek |
| Minimum | 26.1% | 18.9% |
| Maximum | 100.0% | 97.2% |
| Range | 73.9% | 78.3% |
| Mean | 65.9% | 59.9% |
| Median | 65.7% | 61.3% |
| Interquartile 25% (IQ1) | 57.5% | 52.3% |
| Interquartile 75% (IQ3) | 73.3% | 68.2% |
| Interquartile Range (IQR) | 15.7% | 15.8% |
| Standard Deviation (Sample) | 14.5% | 14.4% |
| Standard Deviation (Population) | 14.4% | 14.4% |
Similar Demographics by 2 or more Vehicles in Household
Demographics Similar to Estonians by 2 or more Vehicles in Household
In terms of 2 or more vehicles in household, the demographic groups most similar to Estonians are Immigrants from Thailand (56.6%, a difference of 0.030%), Immigrants from South Central Asia (56.6%, a difference of 0.050%), Ute (56.6%, a difference of 0.070%), Tsimshian (56.7%, a difference of 0.080%), and New Zealander (56.7%, a difference of 0.10%).
| Demographics | Rating | Rank | 2 or more Vehicles in Household |
| Natives/Alaskans | 95.0 /100 | #119 | Exceptional 57.0% |
| Costa Ricans | 94.7 /100 | #120 | Exceptional 56.9% |
| Sioux | 93.8 /100 | #121 | Exceptional 56.8% |
| Immigrants | South Africa | 92.5 /100 | #122 | Exceptional 56.7% |
| Australians | 91.8 /100 | #123 | Exceptional 56.7% |
| New Zealanders | 91.8 /100 | #124 | Exceptional 56.7% |
| Tsimshian | 91.6 /100 | #125 | Exceptional 56.7% |
| Estonians | 90.9 /100 | #126 | Exceptional 56.6% |
| Immigrants | Thailand | 90.7 /100 | #127 | Exceptional 56.6% |
| Immigrants | South Central Asia | 90.5 /100 | #128 | Exceptional 56.6% |
| Ute | 90.4 /100 | #129 | Exceptional 56.6% |
| Yugoslavians | 90.0 /100 | #130 | Exceptional 56.6% |
| Bulgarians | 89.7 /100 | #131 | Excellent 56.5% |
| Hungarians | 89.1 /100 | #132 | Excellent 56.5% |
| Comanche | 88.4 /100 | #133 | Excellent 56.5% |
Demographics Similar to Creek by 2 or more Vehicles in Household
In terms of 2 or more vehicles in household, the demographic groups most similar to Creek are Slovene (58.3%, a difference of 0.010%), Polish (58.3%, a difference of 0.030%), Lithuanian (58.2%, a difference of 0.060%), Immigrants from Afghanistan (58.3%, a difference of 0.11%), and Bolivian (58.3%, a difference of 0.12%).
| Demographics | Rating | Rank | 2 or more Vehicles in Household |
| Pennsylvania Germans | 99.7 /100 | #69 | Exceptional 58.5% |
| Italians | 99.6 /100 | #70 | Exceptional 58.4% |
| Bangladeshis | 99.6 /100 | #71 | Exceptional 58.4% |
| Austrians | 99.6 /100 | #72 | Exceptional 58.4% |
| Bolivians | 99.6 /100 | #73 | Exceptional 58.3% |
| Immigrants | Afghanistan | 99.6 /100 | #74 | Exceptional 58.3% |
| Poles | 99.5 /100 | #75 | Exceptional 58.3% |
| Creek | 99.5 /100 | #76 | Exceptional 58.3% |
| Slovenes | 99.5 /100 | #77 | Exceptional 58.3% |
| Lithuanians | 99.5 /100 | #78 | Exceptional 58.2% |
| Delaware | 99.4 /100 | #79 | Exceptional 58.2% |
| Immigrants | England | 99.3 /100 | #80 | Exceptional 58.1% |
| Immigrants | Iraq | 99.3 /100 | #81 | Exceptional 58.1% |
| Iranians | 99.3 /100 | #82 | Exceptional 58.1% |
| Icelanders | 99.2 /100 | #83 | Exceptional 58.0% |