Zip Codes with the Highest Percentage of Immigrants from Burma / Myanmar in Battle Creek, MI
RELATED REPORTS & OPTIONS
Burma / Myanmar
Battle Creek
Compare Zip Codes
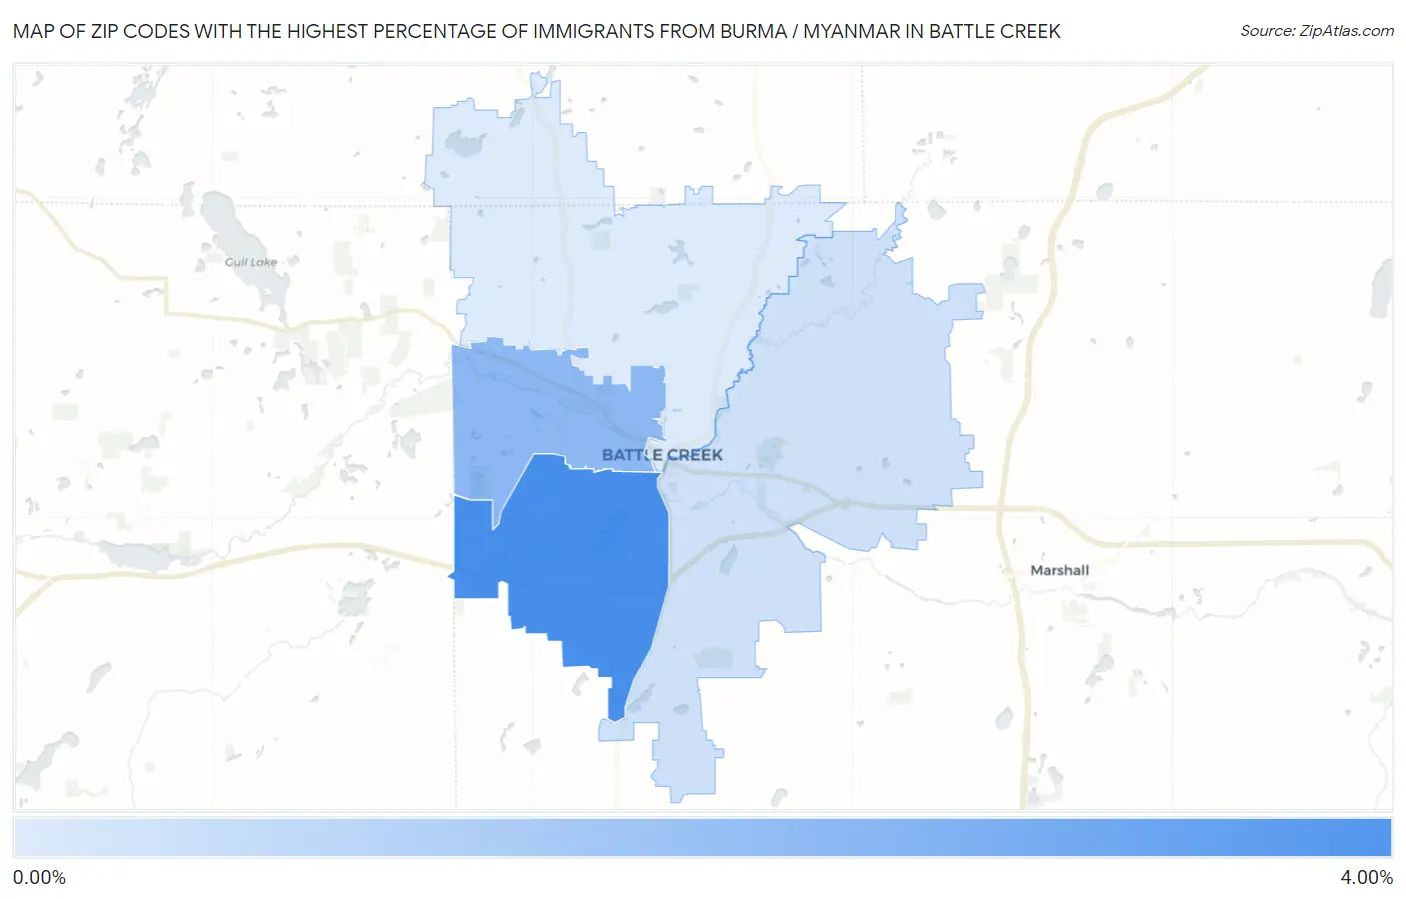
Map of Zip Codes with the Highest Percentage of Immigrants from Burma / Myanmar in Battle Creek
0.069%
3.14%
Zip Codes with the Highest Percentage of Immigrants from Burma / Myanmar in Battle Creek, MI
| Zip Code | Burma / Myanmar | vs State | vs National | |
| 1. | 49015 | 3.14% | 0.041%(+3.10)#2 | 0.047%(+3.09)#837 |
| 2. | 49037 | 1.49% | 0.041%(+1.45)#17 | 0.047%(+1.44)#1,930 |
| 3. | 49014 | 0.085% | 0.041%(+0.045)#168 | 0.047%(+0.038)#8,202 |
| 4. | 49017 | 0.069% | 0.041%(+0.029)#425 | 0.047%(+0.022)#13,448 |
1
Common Questions
What are the Top 3 Zip Codes with the Highest Percentage of Immigrants from Burma / Myanmar in Battle Creek, MI?
Top 3 Zip Codes with the Highest Percentage of Immigrants from Burma / Myanmar in Battle Creek, MI are:
What zip code has the Highest Percentage of Immigrants from Burma / Myanmar in Battle Creek, MI?
49015 has the Highest Percentage of Immigrants from Burma / Myanmar in Battle Creek, MI with 3.14%.
What is the Percentage of Immigrants from Burma / Myanmar in Battle Creek, MI?
Percentage of Immigrants from Burma / Myanmar in Battle Creek is 1.88%.
What is the Percentage of Immigrants from Burma / Myanmar in Michigan?
Percentage of Immigrants from Burma / Myanmar in Michigan is 0.041%.
What is the Percentage of Immigrants from Burma / Myanmar in the United States?
Percentage of Immigrants from Burma / Myanmar in the United States is 0.047%.