Zip Codes with the Highest Percentage of Immigrants from Asia in Battle Creek, MI
RELATED REPORTS & OPTIONS
Asia
Battle Creek
Compare Zip Codes
Map of Zip Codes with the Highest Percentage of Immigrants from Asia in Battle Creek
0.64%
5.36%
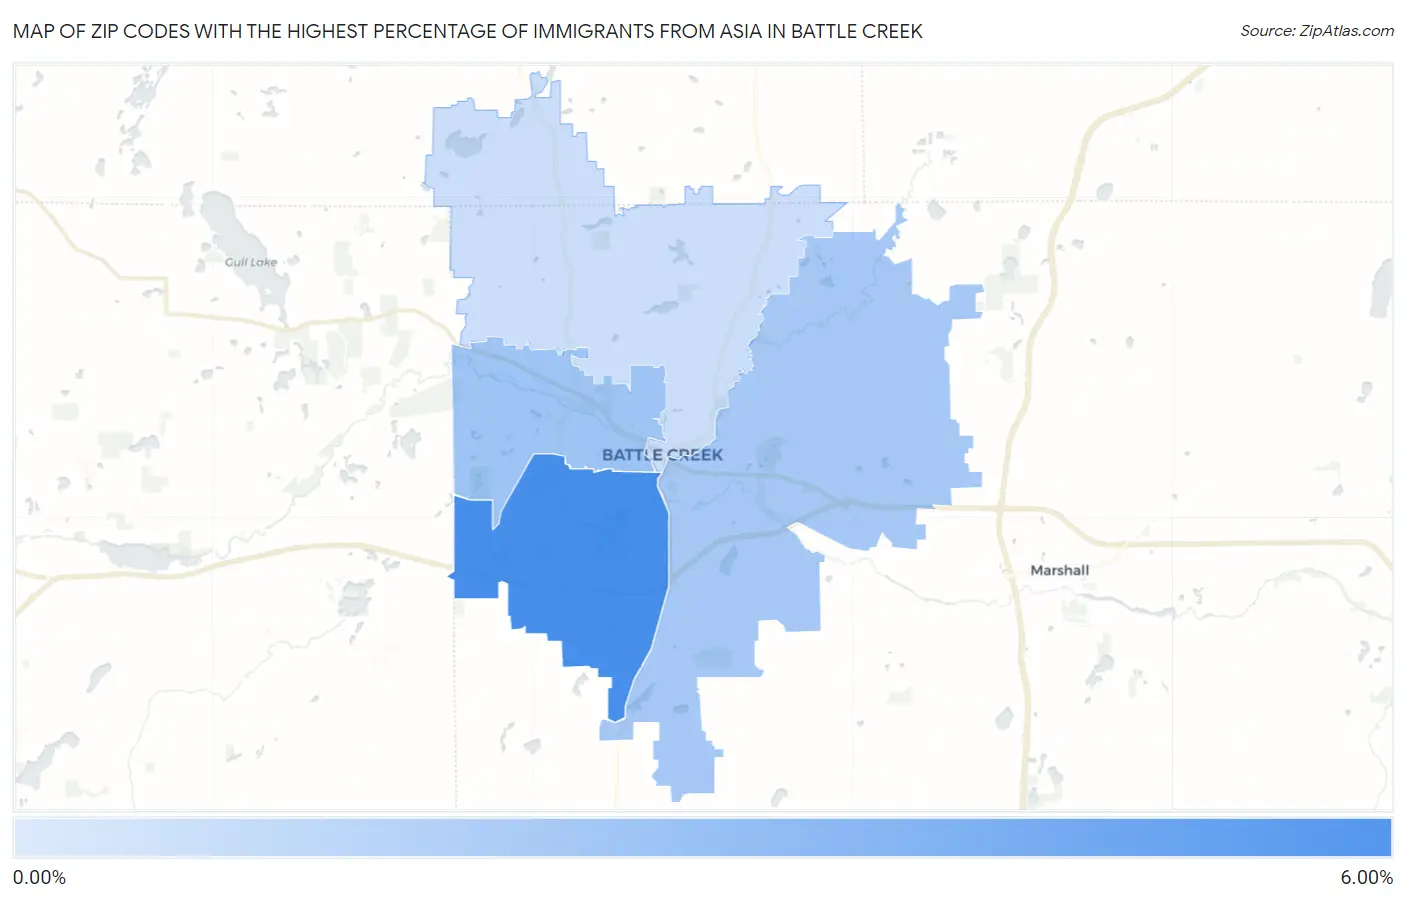
Zip Codes with the Highest Percentage of Immigrants from Asia in Battle Creek, MI
| Zip Code | Asia | vs State | vs National | |
| 1. | 49015 | 5.36% | 3.61% (+1.75)#71 | 4.26% (+1.10)#2,788 |
| 2. | 49037 | 2.23% | 3.61% (-1.38)#147 | 4.26% (-2.03)#6,259 |
| 3. | 49014 | 1.96% | 3.61% (-1.65)#163 | 4.26% (-2.30)#6,910 |
| 4. | 49017 | 0.64% | 3.61% (-2.97)#346 | 4.26% (-3.62)#12,609 |
1
Common Questions
What are the Top 3 Zip Codes with the Highest Percentage of Immigrants from Asia in Battle Creek, MI?
Top 3 Zip Codes with the Highest Percentage of Immigrants from Asia in Battle Creek, MI are:
What zip code has the Highest Percentage of Immigrants from Asia in Battle Creek, MI?
49015 has the Highest Percentage of Immigrants from Asia in Battle Creek, MI with 5.36%.
What is the Percentage of Immigrants from Asia in Battle Creek, MI?
Percentage of Immigrants from Asia in Battle Creek is 3.39%.
What is the Percentage of Immigrants from Asia in Michigan?
Percentage of Immigrants from Asia in Michigan is 3.61%.
What is the Percentage of Immigrants from Asia in the United States?
Percentage of Immigrants from Asia in the United States is 4.26%.