Zip Codes with the Highest Percentage of Population with a Degree in Physical and Health Sciences in Massachusetts
RELATED REPORTS & OPTIONS
Physical and Health Sciences
Massachusetts
Compare Zip Codes
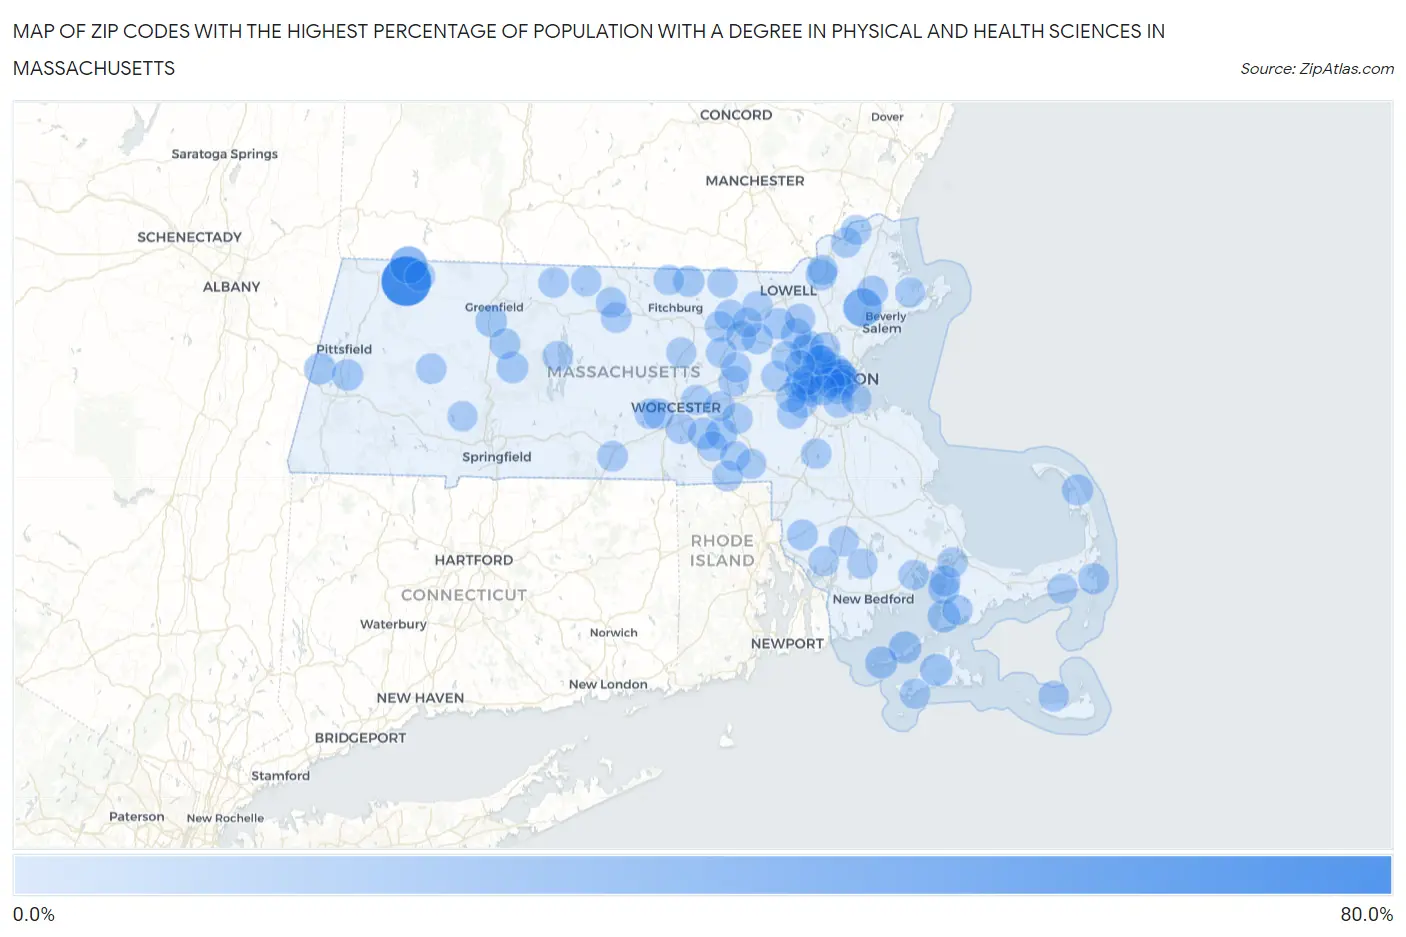
Map of Zip Codes with the Highest Percentage of Population with a Degree in Physical and Health Sciences in Massachusetts
0.0%
80.0%
Zip Codes with the Highest Percentage of Population with a Degree in Physical and Health Sciences in Massachusetts
| Zip Code | % Graduates | vs State | vs National | |
| 1. | 01343 | 78.6% | 3.7%(+74.9)#1 | 3.1%(+75.5)#27 |
| 2. | 01937 | 35.0% | 3.7%(+31.3)#2 | 3.1%(+31.9)#137 |
| 3. | 01350 | 30.8% | 3.7%(+27.1)#3 | 3.1%(+27.7)#188 |
| 4. | 02543 | 13.1% | 3.7%(+9.49)#4 | 3.1%(+10.0)#857 |
| 5. | 02540 | 13.0% | 3.7%(+9.38)#5 | 3.1%(+9.94)#873 |
| 6. | 02575 | 13.0% | 3.7%(+9.34)#6 | 3.1%(+9.90)#882 |
| 7. | 02142 | 11.8% | 3.7%(+8.12)#7 | 3.1%(+8.68)#1,036 |
| 8. | 02713 | 11.8% | 3.7%(+8.11)#8 | 3.1%(+8.66)#1,046 |
| 9. | 02421 | 11.4% | 3.7%(+7.78)#9 | 3.1%(+8.33)#1,088 |
| 10. | 01254 | 10.4% | 3.7%(+6.74)#10 | 3.1%(+7.30)#1,274 |
| 11. | 01342 | 10.3% | 3.7%(+6.60)#11 | 3.1%(+7.16)#1,308 |
| 12. | 01560 | 10.0% | 3.7%(+6.30)#12 | 3.1%(+6.86)#1,381 |
| 13. | 01568 | 9.8% | 3.7%(+6.13)#13 | 3.1%(+6.69)#1,416 |
| 14. | 01003 | 9.8% | 3.7%(+6.10)#14 | 3.1%(+6.66)#1,419 |
| 15. | 01240 | 9.7% | 3.7%(+6.06)#15 | 3.1%(+6.62)#1,431 |
| 16. | 02466 | 9.4% | 3.7%(+5.74)#16 | 3.1%(+6.30)#1,523 |
| 17. | 02139 | 9.1% | 3.7%(+5.41)#17 | 3.1%(+5.97)#1,644 |
| 18. | 02462 | 8.9% | 3.7%(+5.26)#18 | 3.1%(+5.82)#1,695 |
| 19. | 02666 | 8.9% | 3.7%(+5.21)#19 | 3.1%(+5.77)#1,713 |
| 20. | 02420 | 8.8% | 3.7%(+5.11)#20 | 3.1%(+5.67)#1,743 |
| 21. | 01474 | 8.6% | 3.7%(+4.94)#21 | 3.1%(+5.50)#1,802 |
| 22. | 01741 | 8.6% | 3.7%(+4.90)#22 | 3.1%(+5.46)#1,817 |
| 23. | 02534 | 8.5% | 3.7%(+4.82)#23 | 3.1%(+5.38)#1,845 |
| 24. | 02478 | 8.1% | 3.7%(+4.47)#24 | 3.1%(+5.03)#1,966 |
| 25. | 01720 | 8.0% | 3.7%(+4.29)#25 | 3.1%(+4.85)#2,038 |
| 26. | 02650 | 7.9% | 3.7%(+4.25)#26 | 3.1%(+4.81)#2,055 |
| 27. | 01983 | 7.9% | 3.7%(+4.24)#27 | 3.1%(+4.80)#2,057 |
| 28. | 01843 | 7.8% | 3.7%(+4.14)#28 | 3.1%(+4.69)#2,102 |
| 29. | 02559 | 7.7% | 3.7%(+4.07)#29 | 3.1%(+4.63)#2,128 |
| 30. | 01375 | 7.4% | 3.7%(+3.73)#30 | 3.1%(+4.29)#2,304 |
| 31. | 02769 | 7.3% | 3.7%(+3.64)#31 | 3.1%(+4.20)#2,357 |
| 32. | 02468 | 7.0% | 3.7%(+3.33)#32 | 3.1%(+3.89)#2,510 |
| 33. | 01527 | 6.9% | 3.7%(+3.23)#33 | 3.1%(+3.79)#2,581 |
| 34. | 02163 | 6.9% | 3.7%(+3.20)#34 | 3.1%(+3.76)#2,593 |
| 35. | 02140 | 6.7% | 3.7%(+3.08)#35 | 3.1%(+3.64)#2,672 |
| 36. | 02143 | 6.7% | 3.7%(+3.04)#36 | 3.1%(+3.60)#2,701 |
| 37. | 01730 | 6.7% | 3.7%(+3.00)#37 | 3.1%(+3.56)#2,738 |
| 38. | 01432 | 6.6% | 3.7%(+2.94)#38 | 3.1%(+3.50)#2,767 |
| 39. | 01529 | 6.6% | 3.7%(+2.93)#39 | 3.1%(+3.49)#2,777 |
| 40. | 02461 | 6.5% | 3.7%(+2.81)#40 | 3.1%(+3.37)#2,850 |
| 41. | 01468 | 6.4% | 3.7%(+2.75)#41 | 3.1%(+3.31)#2,898 |
| 42. | 01436 | 6.4% | 3.7%(+2.74)#42 | 3.1%(+3.29)#2,909 |
| 43. | 02554 | 6.4% | 3.7%(+2.70)#43 | 3.1%(+3.25)#2,945 |
| 44. | 01566 | 6.3% | 3.7%(+2.64)#44 | 3.1%(+3.20)#2,992 |
| 45. | 02141 | 6.3% | 3.7%(+2.62)#45 | 3.1%(+3.18)#3,010 |
| 46. | 01611 | 6.2% | 3.7%(+2.55)#46 | 3.1%(+3.11)#3,074 |
| 47. | 01752 | 6.2% | 3.7%(+2.53)#47 | 3.1%(+3.09)#3,092 |
| 48. | 01084 | 6.1% | 3.7%(+2.46)#48 | 3.1%(+3.02)#3,145 |
| 49. | 01434 | 6.1% | 3.7%(+2.46)#49 | 3.1%(+3.01)#3,153 |
| 50. | 01821 | 6.1% | 3.7%(+2.40)#50 | 3.1%(+2.96)#3,200 |
| 51. | 01524 | 6.0% | 3.7%(+2.36)#51 | 3.1%(+2.92)#3,248 |
| 52. | 01378 | 6.0% | 3.7%(+2.35)#52 | 3.1%(+2.91)#3,264 |
| 53. | 01740 | 5.9% | 3.7%(+2.28)#53 | 3.1%(+2.84)#3,325 |
| 54. | 02118 | 5.8% | 3.7%(+2.19)#54 | 3.1%(+2.75)#3,416 |
| 55. | 01719 | 5.8% | 3.7%(+2.18)#55 | 3.1%(+2.73)#3,438 |
| 56. | 02111 | 5.8% | 3.7%(+2.17)#56 | 3.1%(+2.73)#3,440 |
| 57. | 02476 | 5.8% | 3.7%(+2.14)#57 | 3.1%(+2.70)#3,471 |
| 58. | 02119 | 5.7% | 3.7%(+2.05)#58 | 3.1%(+2.61)#3,558 |
| 59. | 02492 | 5.7% | 3.7%(+2.05)#59 | 3.1%(+2.60)#3,562 |
| 60. | 02030 | 5.7% | 3.7%(+2.03)#60 | 3.1%(+2.59)#3,573 |
| 61. | 02446 | 5.7% | 3.7%(+2.03)#61 | 3.1%(+2.59)#3,574 |
| 62. | 02067 | 5.7% | 3.7%(+2.01)#62 | 3.1%(+2.57)#3,600 |
| 63. | 01368 | 5.6% | 3.7%(+1.96)#63 | 3.1%(+2.52)#3,664 |
| 64. | 02467 | 5.6% | 3.7%(+1.95)#64 | 3.1%(+2.51)#3,677 |
| 65. | 01830 | 5.6% | 3.7%(+1.95)#65 | 3.1%(+2.50)#3,682 |
| 66. | 01778 | 5.6% | 3.7%(+1.94)#66 | 3.1%(+2.49)#3,697 |
| 67. | 02535 | 5.6% | 3.7%(+1.92)#67 | 3.1%(+2.48)#3,718 |
| 68. | 01749 | 5.6% | 3.7%(+1.91)#68 | 3.1%(+2.47)#3,723 |
| 69. | 01545 | 5.5% | 3.7%(+1.89)#69 | 3.1%(+2.45)#3,765 |
| 70. | 01534 | 5.5% | 3.7%(+1.88)#70 | 3.1%(+2.43)#3,783 |
| 71. | 02465 | 5.5% | 3.7%(+1.87)#71 | 3.1%(+2.43)#3,790 |
| 72. | 02532 | 5.5% | 3.7%(+1.86)#72 | 3.1%(+2.42)#3,805 |
| 73. | 01890 | 5.5% | 3.7%(+1.81)#73 | 3.1%(+2.37)#3,867 |
| 74. | 01748 | 5.5% | 3.7%(+1.81)#74 | 3.1%(+2.36)#3,881 |
| 75. | 02779 | 5.5% | 3.7%(+1.80)#75 | 3.1%(+2.36)#3,886 |
| 76. | 02126 | 5.4% | 3.7%(+1.72)#76 | 3.1%(+2.27)#3,988 |
| 77. | 01367 | 5.3% | 3.7%(+1.65)#77 | 3.1%(+2.21)#4,072 |
| 78. | 02474 | 5.2% | 3.7%(+1.56)#78 | 3.1%(+2.12)#4,198 |
| 79. | 01840 | 5.2% | 3.7%(+1.54)#79 | 3.1%(+2.10)#4,230 |
| 80. | 01355 | 5.2% | 3.7%(+1.53)#80 | 3.1%(+2.09)#4,253 |
| 81. | 02717 | 5.2% | 3.7%(+1.51)#81 | 3.1%(+2.07)#4,288 |
| 82. | 01431 | 5.2% | 3.7%(+1.51)#82 | 3.1%(+2.07)#4,291 |
| 83. | 01860 | 5.2% | 3.7%(+1.50)#83 | 3.1%(+2.06)#4,293 |
| 84. | 02536 | 5.1% | 3.7%(+1.49)#84 | 3.1%(+2.04)#4,317 |
| 85. | 02738 | 5.1% | 3.7%(+1.48)#85 | 3.1%(+2.04)#4,325 |
| 86. | 02482 | 5.1% | 3.7%(+1.46)#86 | 3.1%(+2.02)#4,357 |
| 87. | 02726 | 5.1% | 3.7%(+1.45)#87 | 3.1%(+2.01)#4,377 |
| 88. | 02171 | 5.1% | 3.7%(+1.41)#88 | 3.1%(+1.97)#4,437 |
| 89. | 01886 | 5.0% | 3.7%(+1.38)#89 | 3.1%(+1.94)#4,480 |
| 90. | 01564 | 5.0% | 3.7%(+1.36)#90 | 3.1%(+1.92)#4,508 |
| 91. | 01073 | 5.0% | 3.7%(+1.32)#91 | 3.1%(+1.88)#4,592 |
| 92. | 01773 | 5.0% | 3.7%(+1.31)#92 | 3.1%(+1.87)#4,616 |
| 93. | 02671 | 5.0% | 3.7%(+1.29)#93 | 3.1%(+1.85)#4,652 |
| 94. | 01756 | 4.9% | 3.7%(+1.28)#94 | 3.1%(+1.84)#4,671 |
| 95. | 01929 | 4.9% | 3.7%(+1.27)#95 | 3.1%(+1.83)#4,688 |
| 96. | 02019 | 4.9% | 3.7%(+1.27)#96 | 3.1%(+1.83)#4,692 |
| 97. | 02451 | 4.9% | 3.7%(+1.27)#97 | 3.1%(+1.83)#4,701 |
| 98. | 01463 | 4.9% | 3.7%(+1.23)#98 | 3.1%(+1.79)#4,757 |
| 99. | 01460 | 4.9% | 3.7%(+1.22)#99 | 3.1%(+1.78)#4,775 |
| 100. | 01581 | 4.9% | 3.7%(+1.20)#100 | 3.1%(+1.75)#4,818 |
Common Questions
What are the Top 10 Zip Codes with the Highest Percentage of Population with a Degree in Physical and Health Sciences in Massachusetts?
Top 10 Zip Codes with the Highest Percentage of Population with a Degree in Physical and Health Sciences in Massachusetts are:
What zip code has the Highest Percentage of Population with a Degree in Physical and Health Sciences in Massachusetts?
01343 has the Highest Percentage of Population with a Degree in Physical and Health Sciences in Massachusetts with 78.6%.
What is the Percentage of Population with a Degree in Physical and Health Sciences in the State of Massachusetts?
Percentage of Population with a Degree in Physical and Health Sciences in Massachusetts is 3.7%.
What is the Percentage of Population with a Degree in Physical and Health Sciences in the United States?
Percentage of Population with a Degree in Physical and Health Sciences in the United States is 3.1%.