Zip Codes with the Highest Percentage of Population with a Degree in Psychology in Massachusetts
RELATED REPORTS & OPTIONS
Psychology
Massachusetts
Compare Zip Codes
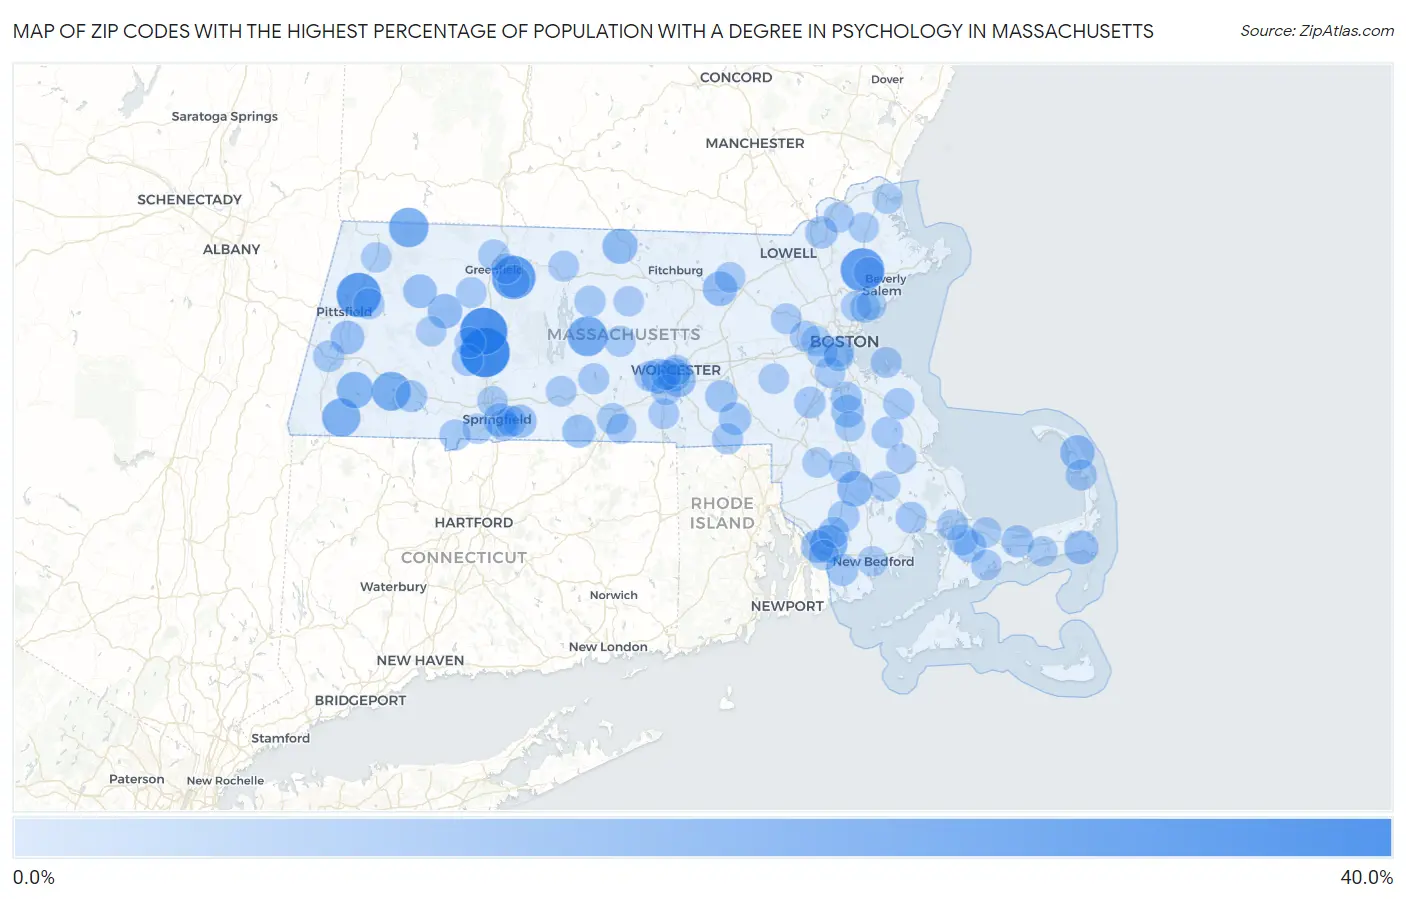
Map of Zip Codes with the Highest Percentage of Population with a Degree in Psychology in Massachusetts
0.0%
40.0%
Zip Codes with the Highest Percentage of Population with a Degree in Psychology in Massachusetts
| Zip Code | % Graduates | vs State | vs National | |
| 1. | 01063 | 40.0% | 5.9%(+34.1)#1 | 5.1%(+34.9)#174 |
| 2. | 01088 | 36.1% | 5.9%(+30.2)#2 | 5.1%(+31.0)#204 |
| 3. | 01224 | 31.2% | 5.9%(+25.4)#3 | 5.1%(+26.2)#281 |
| 4. | 01937 | 30.0% | 5.9%(+24.1)#4 | 5.1%(+24.9)#301 |
| 5. | 01347 | 29.9% | 5.9%(+24.1)#5 | 5.1%(+24.9)#304 |
| 6. | 01037 | 23.5% | 5.9%(+17.7)#6 | 5.1%(+18.5)#475 |
| 7. | 01350 | 23.1% | 5.9%(+17.2)#7 | 5.1%(+18.0)#492 |
| 8. | 01029 | 22.1% | 5.9%(+16.2)#8 | 5.1%(+17.0)#546 |
| 9. | 01244 | 21.1% | 5.9%(+15.2)#9 | 5.1%(+16.0)#597 |
| 10. | 02723 | 19.8% | 5.9%(+13.9)#10 | 5.1%(+14.7)#673 |
| 11. | 01245 | 18.1% | 5.9%(+12.3)#11 | 5.1%(+13.1)#792 |
| 12. | 02718 | 16.4% | 5.9%(+10.6)#12 | 5.1%(+11.4)#964 |
| 13. | 01475 | 15.8% | 5.9%(+9.92)#13 | 5.1%(+10.7)#1,036 |
| 14. | 01611 | 15.4% | 5.9%(+9.56)#14 | 5.1%(+10.4)#1,071 |
| 15. | 02666 | 15.0% | 5.9%(+9.17)#15 | 5.1%(+9.97)#1,127 |
| 16. | 01434 | 15.0% | 5.9%(+9.13)#16 | 5.1%(+9.94)#1,133 |
| 17. | 01032 | 14.9% | 5.9%(+9.04)#17 | 5.1%(+9.84)#1,146 |
| 18. | 01607 | 14.3% | 5.9%(+8.49)#18 | 5.1%(+9.29)#1,218 |
| 19. | 02659 | 13.9% | 5.9%(+8.08)#19 | 5.1%(+8.88)#1,288 |
| 20. | 01240 | 13.5% | 5.9%(+7.62)#20 | 5.1%(+8.43)#1,389 |
| 21. | 01070 | 13.3% | 5.9%(+7.45)#21 | 5.1%(+8.25)#1,421 |
| 22. | 01610 | 13.3% | 5.9%(+7.40)#22 | 5.1%(+8.20)#1,429 |
| 23. | 01105 | 12.8% | 5.9%(+6.90)#23 | 5.1%(+7.70)#1,530 |
| 24. | 01128 | 12.7% | 5.9%(+6.87)#24 | 5.1%(+7.67)#1,539 |
| 25. | 02724 | 12.6% | 5.9%(+6.71)#25 | 5.1%(+7.51)#1,570 |
| 26. | 01081 | 12.4% | 5.9%(+6.55)#26 | 5.1%(+7.36)#1,626 |
| 27. | 01351 | 12.0% | 5.9%(+6.19)#27 | 5.1%(+7.00)#1,705 |
| 28. | 02322 | 11.8% | 5.9%(+5.95)#28 | 5.1%(+6.76)#1,787 |
| 29. | 01756 | 11.4% | 5.9%(+5.56)#29 | 5.1%(+6.36)#1,904 |
| 30. | 01568 | 11.4% | 5.9%(+5.53)#30 | 5.1%(+6.33)#1,913 |
| 31. | 01841 | 11.2% | 5.9%(+5.35)#31 | 5.1%(+6.16)#1,975 |
| 32. | 02630 | 11.0% | 5.9%(+5.16)#32 | 5.1%(+5.96)#2,056 |
| 33. | 02644 | 11.0% | 5.9%(+5.12)#33 | 5.1%(+5.93)#2,066 |
| 34. | 01008 | 10.6% | 5.9%(+4.75)#34 | 5.1%(+5.55)#2,214 |
| 35. | 02790 | 10.4% | 5.9%(+4.50)#35 | 5.1%(+5.30)#2,310 |
| 36. | 02032 | 10.1% | 5.9%(+4.24)#36 | 5.1%(+5.05)#2,448 |
| 37. | 01262 | 10.0% | 5.9%(+4.11)#37 | 5.1%(+4.91)#2,516 |
| 38. | 01027 | 10.0% | 5.9%(+4.10)#38 | 5.1%(+4.90)#2,521 |
| 39. | 01108 | 9.9% | 5.9%(+4.08)#39 | 5.1%(+4.89)#2,530 |
| 40. | 02767 | 9.9% | 5.9%(+4.07)#40 | 5.1%(+4.87)#2,542 |
| 41. | 02702 | 9.9% | 5.9%(+4.06)#41 | 5.1%(+4.87)#2,545 |
| 42. | 02368 | 9.9% | 5.9%(+4.06)#42 | 5.1%(+4.86)#2,549 |
| 43. | 02341 | 9.9% | 5.9%(+4.02)#43 | 5.1%(+4.83)#2,565 |
| 44. | 02576 | 9.7% | 5.9%(+3.79)#44 | 5.1%(+4.60)#2,692 |
| 45. | 02061 | 9.6% | 5.9%(+3.79)#45 | 5.1%(+4.59)#2,695 |
| 46. | 01529 | 9.6% | 5.9%(+3.76)#46 | 5.1%(+4.57)#2,714 |
| 47. | 01226 | 9.5% | 5.9%(+3.68)#47 | 5.1%(+4.49)#2,755 |
| 48. | 02667 | 9.5% | 5.9%(+3.64)#48 | 5.1%(+4.45)#2,780 |
| 49. | 01566 | 9.4% | 5.9%(+3.57)#49 | 5.1%(+4.37)#2,828 |
| 50. | 01366 | 9.4% | 5.9%(+3.56)#50 | 5.1%(+4.37)#2,832 |
| 51. | 01118 | 9.3% | 5.9%(+3.46)#51 | 5.1%(+4.26)#2,899 |
| 52. | 01068 | 9.3% | 5.9%(+3.43)#52 | 5.1%(+4.23)#2,925 |
| 53. | 02720 | 9.3% | 5.9%(+3.42)#53 | 5.1%(+4.22)#2,931 |
| 54. | 01077 | 9.2% | 5.9%(+3.36)#54 | 5.1%(+4.17)#2,974 |
| 55. | 02542 | 9.1% | 5.9%(+3.29)#55 | 5.1%(+4.10)#3,018 |
| 56. | 02532 | 9.1% | 5.9%(+3.29)#56 | 5.1%(+4.09)#3,023 |
| 57. | 01301 | 9.1% | 5.9%(+3.23)#57 | 5.1%(+4.04)#3,049 |
| 58. | 01585 | 9.0% | 5.9%(+3.18)#58 | 5.1%(+3.99)#3,106 |
| 59. | 02045 | 8.9% | 5.9%(+3.07)#59 | 5.1%(+3.87)#3,204 |
| 60. | 01053 | 8.9% | 5.9%(+3.06)#60 | 5.1%(+3.87)#3,211 |
| 61. | 01524 | 8.9% | 5.9%(+3.06)#61 | 5.1%(+3.86)#3,215 |
| 62. | 01364 | 8.8% | 5.9%(+2.90)#62 | 5.1%(+3.70)#3,340 |
| 63. | 01341 | 8.7% | 5.9%(+2.86)#63 | 5.1%(+3.66)#3,387 |
| 64. | 01069 | 8.7% | 5.9%(+2.83)#64 | 5.1%(+3.63)#3,429 |
| 65. | 01432 | 8.7% | 5.9%(+2.80)#65 | 5.1%(+3.60)#3,453 |
| 66. | 01923 | 8.6% | 5.9%(+2.77)#66 | 5.1%(+3.58)#3,484 |
| 67. | 02635 | 8.6% | 5.9%(+2.74)#67 | 5.1%(+3.55)#3,509 |
| 68. | 01540 | 8.6% | 5.9%(+2.73)#68 | 5.1%(+3.53)#3,528 |
| 69. | 01835 | 8.5% | 5.9%(+2.66)#69 | 5.1%(+3.46)#3,593 |
| 70. | 01773 | 8.5% | 5.9%(+2.64)#70 | 5.1%(+3.45)#3,605 |
| 71. | 01376 | 8.5% | 5.9%(+2.61)#71 | 5.1%(+3.41)#3,648 |
| 72. | 01906 | 8.4% | 5.9%(+2.59)#72 | 5.1%(+3.39)#3,663 |
| 73. | 01501 | 8.4% | 5.9%(+2.58)#73 | 5.1%(+3.39)#3,669 |
| 74. | 02119 | 8.4% | 5.9%(+2.58)#74 | 5.1%(+3.38)#3,678 |
| 75. | 01608 | 8.4% | 5.9%(+2.54)#75 | 5.1%(+3.35)#3,714 |
| 76. | 01013 | 8.4% | 5.9%(+2.52)#76 | 5.1%(+3.32)#3,732 |
| 77. | 02136 | 8.3% | 5.9%(+2.49)#77 | 5.1%(+3.29)#3,754 |
| 78. | 02346 | 8.3% | 5.9%(+2.48)#78 | 5.1%(+3.29)#3,759 |
| 79. | 01603 | 8.3% | 5.9%(+2.44)#79 | 5.1%(+3.25)#3,809 |
| 80. | 02458 | 8.3% | 5.9%(+2.43)#80 | 5.1%(+3.23)#3,823 |
| 81. | 02453 | 8.3% | 5.9%(+2.42)#81 | 5.1%(+3.23)#3,832 |
| 82. | 01770 | 8.2% | 5.9%(+2.34)#82 | 5.1%(+3.14)#3,913 |
| 83. | 02467 | 8.2% | 5.9%(+2.31)#83 | 5.1%(+3.11)#3,945 |
| 84. | 01084 | 8.2% | 5.9%(+2.31)#84 | 5.1%(+3.11)#3,953 |
| 85. | 01030 | 8.2% | 5.9%(+2.30)#85 | 5.1%(+3.10)#3,960 |
| 86. | 02301 | 8.1% | 5.9%(+2.29)#86 | 5.1%(+3.09)#3,973 |
| 87. | 01905 | 8.1% | 5.9%(+2.29)#87 | 5.1%(+3.09)#3,974 |
| 88. | 02766 | 8.1% | 5.9%(+2.28)#88 | 5.1%(+3.08)#3,980 |
| 89. | 01550 | 8.1% | 5.9%(+2.26)#89 | 5.1%(+3.06)#3,998 |
| 90. | 02721 | 8.1% | 5.9%(+2.25)#90 | 5.1%(+3.06)#4,004 |
| 91. | 01833 | 8.1% | 5.9%(+2.21)#91 | 5.1%(+3.02)#4,052 |
| 92. | 01452 | 8.0% | 5.9%(+2.17)#92 | 5.1%(+2.97)#4,094 |
| 93. | 01220 | 8.0% | 5.9%(+2.17)#93 | 5.1%(+2.97)#4,099 |
| 94. | 02537 | 8.0% | 5.9%(+2.15)#94 | 5.1%(+2.96)#4,116 |
| 95. | 02740 | 8.0% | 5.9%(+2.15)#95 | 5.1%(+2.95)#4,122 |
| 96. | 02121 | 8.0% | 5.9%(+2.11)#96 | 5.1%(+2.91)#4,177 |
| 97. | 01950 | 7.9% | 5.9%(+2.09)#97 | 5.1%(+2.90)#4,197 |
| 98. | 02664 | 7.9% | 5.9%(+2.09)#98 | 5.1%(+2.89)#4,202 |
| 99. | 02367 | 7.9% | 5.9%(+2.06)#99 | 5.1%(+2.87)#4,242 |
| 100. | 01902 | 7.9% | 5.9%(+2.05)#100 | 5.1%(+2.86)#4,250 |
Common Questions
What are the Top 10 Zip Codes with the Highest Percentage of Population with a Degree in Psychology in Massachusetts?
Top 10 Zip Codes with the Highest Percentage of Population with a Degree in Psychology in Massachusetts are:
What zip code has the Highest Percentage of Population with a Degree in Psychology in Massachusetts?
01063 has the Highest Percentage of Population with a Degree in Psychology in Massachusetts with 40.0%.
What is the Percentage of Population with a Degree in Psychology in the State of Massachusetts?
Percentage of Population with a Degree in Psychology in Massachusetts is 5.9%.
What is the Percentage of Population with a Degree in Psychology in the United States?
Percentage of Population with a Degree in Psychology in the United States is 5.1%.