Zip Codes with the Highest Percentage of Population with a Degree in Business in Massachusetts
RELATED REPORTS & OPTIONS
Business
Massachusetts
Compare Zip Codes
Map of Zip Codes with the Highest Percentage of Population with a Degree in Business in Massachusetts
20.0%
100.0%
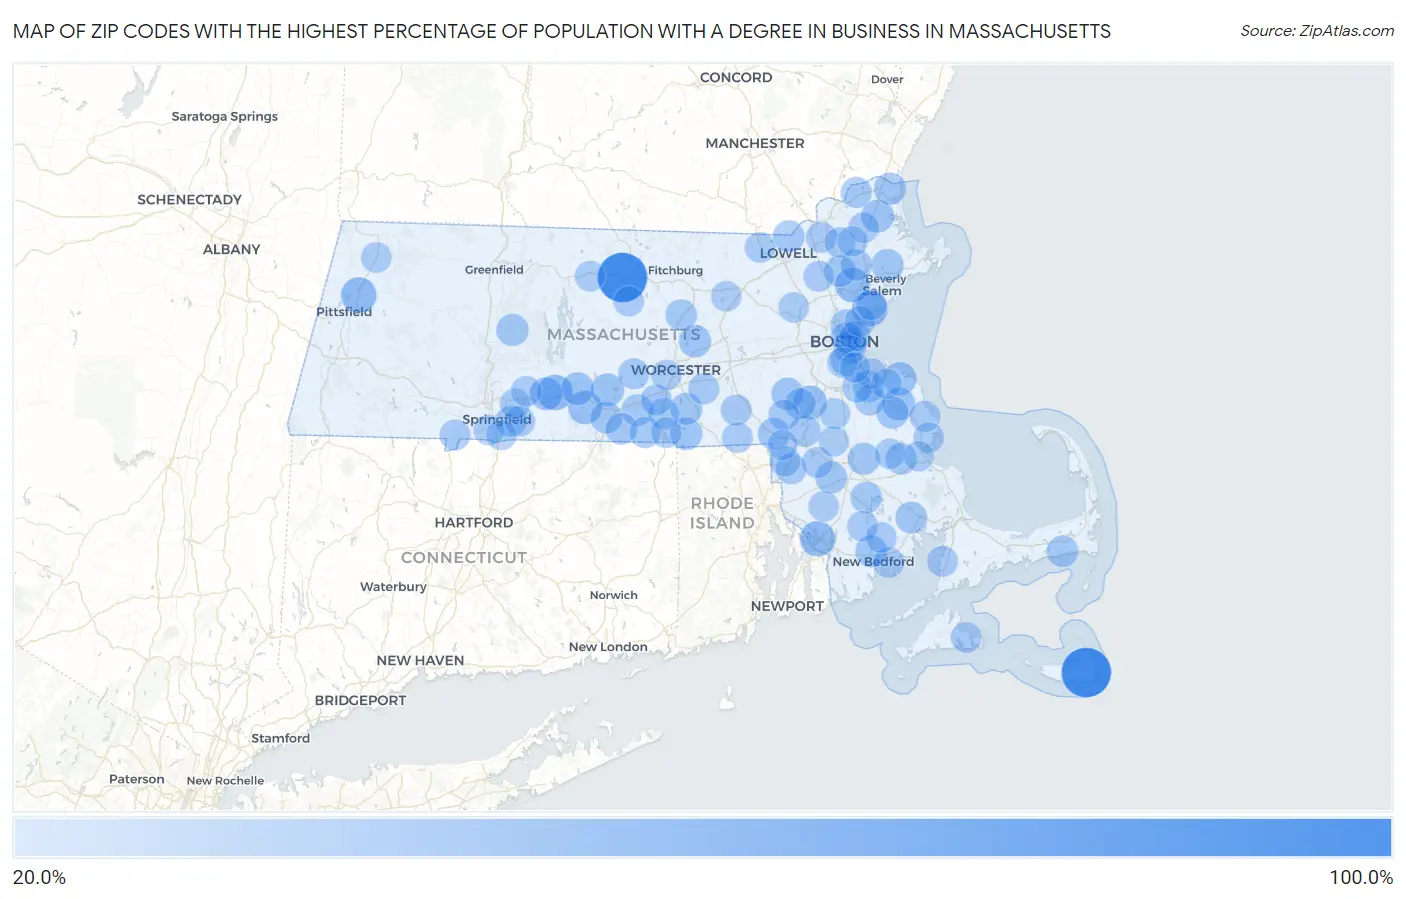
Zip Codes with the Highest Percentage of Population with a Degree in Business in Massachusetts
| Zip Code | % Graduates | vs State | vs National | |
| 1. | 01438 | 82.2% | 16.8%(+65.4)#1 | 19.5%(+62.7)#217 |
| 2. | 02564 | 81.9% | 16.8%(+65.1)#2 | 19.5%(+62.4)#220 |
| 3. | 01224 | 37.5% | 16.8%(+20.7)#3 | 19.5%(+18.0)#1,434 |
| 4. | 01079 | 37.4% | 16.8%(+20.6)#4 | 19.5%(+17.9)#1,453 |
| 5. | 01901 | 36.9% | 16.8%(+20.1)#5 | 19.5%(+17.4)#1,504 |
| 6. | 02725 | 36.8% | 16.8%(+20.0)#6 | 19.5%(+17.3)#1,518 |
| 7. | 01940 | 34.2% | 16.8%(+17.4)#7 | 19.5%(+14.7)#1,853 |
| 8. | 02032 | 32.7% | 16.8%(+15.9)#8 | 19.5%(+13.2)#2,120 |
| 9. | 01010 | 31.6% | 16.8%(+14.8)#9 | 19.5%(+12.1)#2,382 |
| 10. | 01506 | 30.2% | 16.8%(+13.4)#10 | 19.5%(+10.7)#2,769 |
| 11. | 02025 | 30.0% | 16.8%(+13.2)#11 | 19.5%(+10.5)#2,853 |
| 12. | 01092 | 29.5% | 16.8%(+12.7)#12 | 19.5%(+9.97)#3,018 |
| 13. | 02061 | 29.4% | 16.8%(+12.6)#13 | 19.5%(+9.94)#3,035 |
| 14. | 01080 | 29.4% | 16.8%(+12.6)#14 | 19.5%(+9.91)#3,045 |
| 15. | 01922 | 28.9% | 16.8%(+12.1)#15 | 19.5%(+9.43)#3,231 |
| 16. | 02127 | 28.0% | 16.8%(+11.2)#16 | 19.5%(+8.48)#3,703 |
| 17. | 01516 | 27.5% | 16.8%(+10.7)#17 | 19.5%(+8.03)#3,906 |
| 18. | 01505 | 27.3% | 16.8%(+10.5)#18 | 19.5%(+7.76)#4,074 |
| 19. | 02052 | 27.1% | 16.8%(+10.3)#19 | 19.5%(+7.62)#4,132 |
| 20. | 02339 | 26.9% | 16.8%(+10.1)#20 | 19.5%(+7.45)#4,223 |
| 21. | 01590 | 26.9% | 16.8%(+10.1)#21 | 19.5%(+7.36)#4,276 |
| 22. | 02324 | 26.8% | 16.8%(+10.0)#22 | 19.5%(+7.33)#4,292 |
| 23. | 01003 | 26.8% | 16.8%(+10.0)#23 | 19.5%(+7.33)#4,293 |
| 24. | 01984 | 26.8% | 16.8%(+9.99)#24 | 19.5%(+7.29)#4,325 |
| 25. | 01952 | 26.7% | 16.8%(+9.89)#25 | 19.5%(+7.19)#4,387 |
| 26. | 02780 | 26.2% | 16.8%(+9.43)#26 | 19.5%(+6.73)#4,733 |
| 27. | 01518 | 25.8% | 16.8%(+9.01)#27 | 19.5%(+6.31)#5,003 |
| 28. | 02093 | 25.8% | 16.8%(+8.96)#28 | 19.5%(+6.26)#5,045 |
| 29. | 02576 | 25.7% | 16.8%(+8.93)#29 | 19.5%(+6.24)#5,068 |
| 30. | 02746 | 25.7% | 16.8%(+8.90)#30 | 19.5%(+6.20)#5,096 |
| 31. | 01507 | 25.5% | 16.8%(+8.74)#31 | 19.5%(+6.04)#5,219 |
| 32. | 02671 | 25.5% | 16.8%(+8.70)#32 | 19.5%(+6.00)#5,259 |
| 33. | 01864 | 25.5% | 16.8%(+8.67)#33 | 19.5%(+5.97)#5,274 |
| 34. | 01826 | 25.4% | 16.8%(+8.61)#34 | 19.5%(+5.91)#5,325 |
| 35. | 02188 | 25.2% | 16.8%(+8.40)#35 | 19.5%(+5.70)#5,487 |
| 36. | 01550 | 25.2% | 16.8%(+8.37)#36 | 19.5%(+5.67)#5,513 |
| 37. | 02347 | 25.0% | 16.8%(+8.17)#37 | 19.5%(+5.47)#5,730 |
| 38. | 02122 | 24.9% | 16.8%(+8.12)#38 | 19.5%(+5.42)#5,762 |
| 39. | 01949 | 24.9% | 16.8%(+8.09)#39 | 19.5%(+5.39)#5,792 |
| 40. | 02035 | 24.8% | 16.8%(+8.02)#40 | 19.5%(+5.32)#5,852 |
| 41. | 02149 | 24.7% | 16.8%(+7.92)#41 | 19.5%(+5.23)#5,929 |
| 42. | 01564 | 24.5% | 16.8%(+7.75)#42 | 19.5%(+5.05)#6,080 |
| 43. | 02367 | 24.5% | 16.8%(+7.72)#43 | 19.5%(+5.02)#6,108 |
| 44. | 01571 | 24.2% | 16.8%(+7.42)#44 | 19.5%(+4.72)#6,380 |
| 45. | 02081 | 24.1% | 16.8%(+7.26)#45 | 19.5%(+4.56)#6,541 |
| 46. | 01540 | 23.7% | 16.8%(+6.90)#46 | 19.5%(+4.20)#6,911 |
| 47. | 01118 | 23.6% | 16.8%(+6.79)#47 | 19.5%(+4.09)#7,024 |
| 48. | 01747 | 23.6% | 16.8%(+6.75)#48 | 19.5%(+4.05)#7,069 |
| 49. | 02190 | 23.5% | 16.8%(+6.68)#49 | 19.5%(+3.98)#7,148 |
| 50. | 01860 | 23.4% | 16.8%(+6.59)#50 | 19.5%(+3.89)#7,227 |
| 51. | 01537 | 23.3% | 16.8%(+6.50)#51 | 19.5%(+3.80)#7,336 |
| 52. | 01562 | 23.3% | 16.8%(+6.49)#52 | 19.5%(+3.79)#7,359 |
| 53. | 01519 | 23.3% | 16.8%(+6.46)#53 | 19.5%(+3.76)#7,387 |
| 54. | 02766 | 23.2% | 16.8%(+6.39)#54 | 19.5%(+3.69)#7,453 |
| 55. | 02050 | 23.2% | 16.8%(+6.37)#55 | 19.5%(+3.67)#7,466 |
| 56. | 02556 | 23.1% | 16.8%(+6.31)#56 | 19.5%(+3.61)#7,540 |
| 57. | 02703 | 23.0% | 16.8%(+6.23)#57 | 19.5%(+3.53)#7,635 |
| 58. | 01843 | 23.0% | 16.8%(+6.20)#58 | 19.5%(+3.51)#7,654 |
| 59. | 02056 | 23.0% | 16.8%(+6.20)#59 | 19.5%(+3.50)#7,658 |
| 60. | 02539 | 23.0% | 16.8%(+6.20)#60 | 19.5%(+3.50)#7,666 |
| 61. | 02210 | 22.7% | 16.8%(+5.94)#61 | 19.5%(+3.24)#7,919 |
| 62. | 02191 | 22.7% | 16.8%(+5.94)#62 | 19.5%(+3.24)#7,922 |
| 63. | 02113 | 22.7% | 16.8%(+5.87)#63 | 19.5%(+3.18)#8,006 |
| 64. | 01077 | 22.6% | 16.8%(+5.82)#64 | 19.5%(+3.13)#8,053 |
| 65. | 02717 | 22.6% | 16.8%(+5.80)#65 | 19.5%(+3.10)#8,087 |
| 66. | 02719 | 22.6% | 16.8%(+5.78)#66 | 19.5%(+3.08)#8,100 |
| 67. | 01887 | 22.6% | 16.8%(+5.76)#67 | 19.5%(+3.06)#8,129 |
| 68. | 01845 | 22.5% | 16.8%(+5.69)#68 | 19.5%(+2.99)#8,205 |
| 69. | 01833 | 22.4% | 16.8%(+5.60)#69 | 19.5%(+2.90)#8,311 |
| 70. | 02128 | 22.4% | 16.8%(+5.58)#70 | 19.5%(+2.88)#8,335 |
| 71. | 02760 | 22.4% | 16.8%(+5.58)#71 | 19.5%(+2.88)#8,336 |
| 72. | 02743 | 22.2% | 16.8%(+5.43)#72 | 19.5%(+2.73)#8,502 |
| 73. | 01504 | 22.2% | 16.8%(+5.42)#73 | 19.5%(+2.72)#8,509 |
| 74. | 02151 | 22.1% | 16.8%(+5.29)#74 | 19.5%(+2.59)#8,694 |
| 75. | 01570 | 22.1% | 16.8%(+5.27)#75 | 19.5%(+2.57)#8,712 |
| 76. | 01451 | 22.0% | 16.8%(+5.18)#76 | 19.5%(+2.48)#8,845 |
| 77. | 01220 | 22.0% | 16.8%(+5.18)#77 | 19.5%(+2.48)#8,848 |
| 78. | 01879 | 22.0% | 16.8%(+5.16)#78 | 19.5%(+2.46)#8,872 |
| 79. | 02715 | 21.9% | 16.8%(+5.13)#79 | 19.5%(+2.43)#8,910 |
| 80. | 01001 | 21.9% | 16.8%(+5.10)#80 | 19.5%(+2.40)#8,952 |
| 81. | 01331 | 21.9% | 16.8%(+5.07)#81 | 19.5%(+2.37)#8,992 |
| 82. | 01452 | 21.8% | 16.8%(+5.01)#82 | 19.5%(+2.31)#9,064 |
| 83. | 02184 | 21.8% | 16.8%(+5.00)#83 | 19.5%(+2.31)#9,072 |
| 84. | 02072 | 21.7% | 16.8%(+4.92)#84 | 19.5%(+2.22)#9,189 |
| 85. | 01731 | 21.7% | 16.8%(+4.90)#85 | 19.5%(+2.20)#9,210 |
| 86. | 02332 | 21.7% | 16.8%(+4.89)#86 | 19.5%(+2.19)#9,224 |
| 87. | 02338 | 21.7% | 16.8%(+4.89)#87 | 19.5%(+2.19)#9,225 |
| 88. | 02124 | 21.7% | 16.8%(+4.87)#88 | 19.5%(+2.17)#9,252 |
| 89. | 01128 | 21.6% | 16.8%(+4.82)#89 | 19.5%(+2.12)#9,301 |
| 90. | 02043 | 21.6% | 16.8%(+4.82)#90 | 19.5%(+2.12)#9,316 |
| 91. | 02762 | 21.5% | 16.8%(+4.73)#91 | 19.5%(+2.03)#9,418 |
| 92. | 02364 | 21.5% | 16.8%(+4.73)#92 | 19.5%(+2.03)#9,419 |
| 93. | 01151 | 21.5% | 16.8%(+4.71)#93 | 19.5%(+2.01)#9,444 |
| 94. | 01921 | 21.5% | 16.8%(+4.71)#94 | 19.5%(+2.01)#9,448 |
| 95. | 01056 | 21.5% | 16.8%(+4.69)#95 | 19.5%(+1.99)#9,477 |
| 96. | 01603 | 21.5% | 16.8%(+4.66)#96 | 19.5%(+1.97)#9,511 |
| 97. | 02170 | 21.5% | 16.8%(+4.66)#97 | 19.5%(+1.96)#9,516 |
| 98. | 02375 | 21.4% | 16.8%(+4.64)#98 | 19.5%(+1.94)#9,539 |
| 99. | 01106 | 21.4% | 16.8%(+4.64)#99 | 19.5%(+1.94)#9,541 |
| 100. | 01902 | 21.4% | 16.8%(+4.63)#100 | 19.5%(+1.93)#9,549 |
Common Questions
What are the Top 10 Zip Codes with the Highest Percentage of Population with a Degree in Business in Massachusetts?
Top 10 Zip Codes with the Highest Percentage of Population with a Degree in Business in Massachusetts are:
What zip code has the Highest Percentage of Population with a Degree in Business in Massachusetts?
01438 has the Highest Percentage of Population with a Degree in Business in Massachusetts with 82.2%.
What is the Percentage of Population with a Degree in Business in the State of Massachusetts?
Percentage of Population with a Degree in Business in Massachusetts is 16.8%.
What is the Percentage of Population with a Degree in Business in the United States?
Percentage of Population with a Degree in Business in the United States is 19.5%.