Zip Codes with the Highest Percentage of Population with a Degree in Literature and Languages in Massachusetts
RELATED REPORTS & OPTIONS
Literature and Languages
Massachusetts
Compare Zip Codes
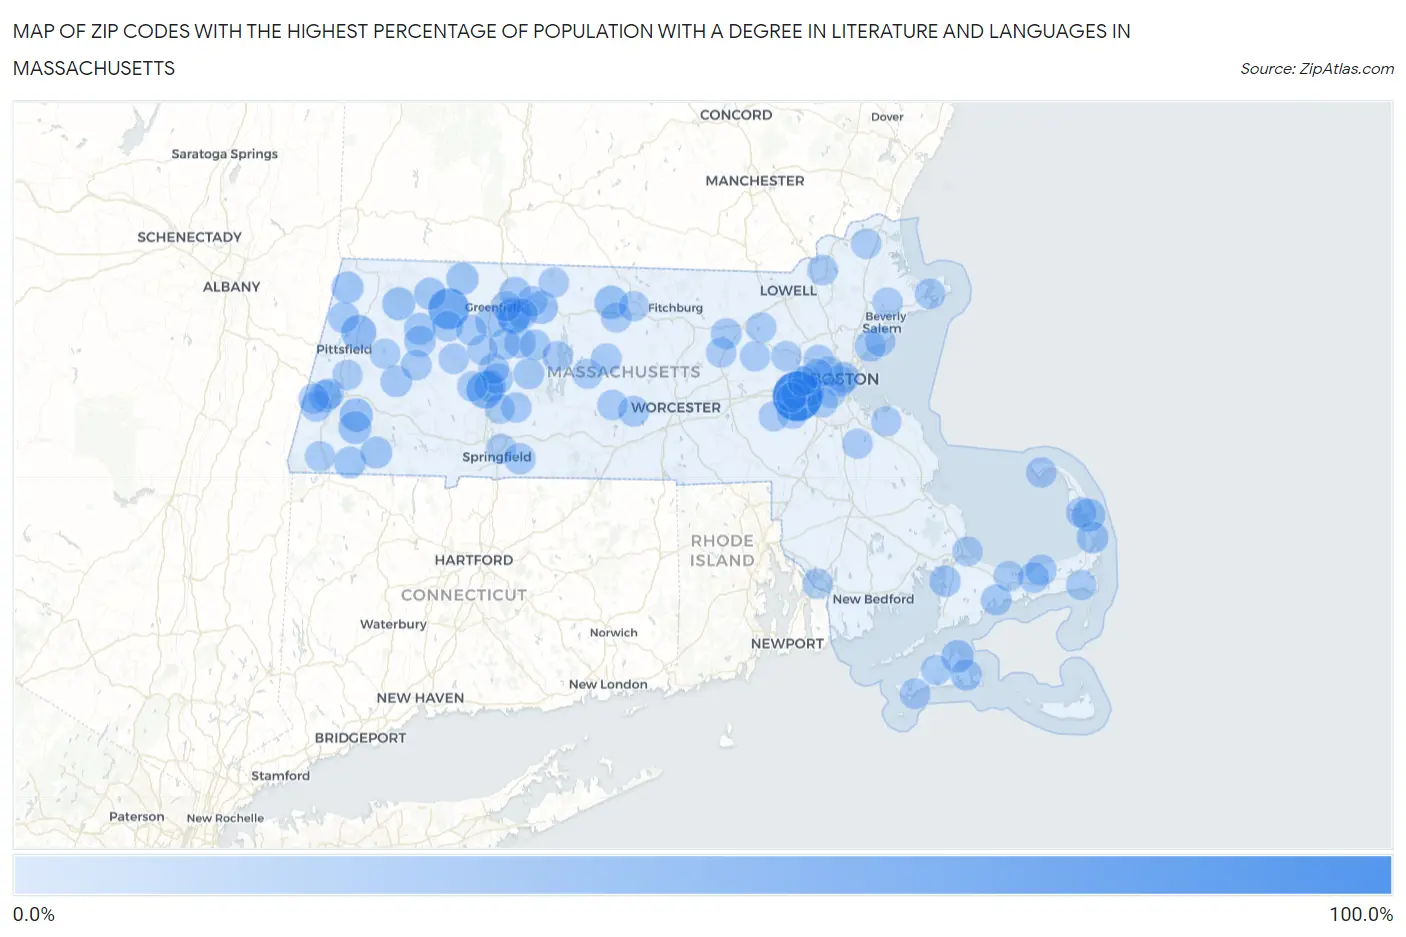
Map of Zip Codes with the Highest Percentage of Population with a Degree in Literature and Languages in Massachusetts
0.0%
100.0%
Zip Codes with the Highest Percentage of Population with a Degree in Literature and Languages in Massachusetts
| Zip Code | % Graduates | vs State | vs National | |
| 1. | 02457 | 100.0% | 6.3%(+93.7)#1 | 4.4%(+95.6)#1 |
| 2. | 01338 | 58.3% | 6.3%(+52.1)#2 | 4.4%(+53.9)#42 |
| 3. | 01063 | 40.0% | 6.3%(+33.7)#3 | 4.4%(+35.6)#116 |
| 4. | 01224 | 31.2% | 6.3%(+25.0)#4 | 4.4%(+26.8)#192 |
| 5. | 01347 | 29.0% | 6.3%(+22.7)#5 | 4.4%(+24.6)#213 |
| 6. | 01436 | 24.2% | 6.3%(+17.9)#6 | 4.4%(+19.7)#331 |
| 7. | 01264 | 23.1% | 6.3%(+16.8)#7 | 4.4%(+18.7)#358 |
| 8. | 02663 | 22.6% | 6.3%(+16.3)#8 | 4.4%(+18.2)#370 |
| 9. | 01380 | 22.2% | 6.3%(+15.9)#9 | 4.4%(+17.8)#397 |
| 10. | 01256 | 21.8% | 6.3%(+15.5)#10 | 4.4%(+17.4)#402 |
| 11. | 01245 | 21.8% | 6.3%(+15.5)#11 | 4.4%(+17.4)#404 |
| 12. | 02557 | 19.6% | 6.3%(+13.3)#12 | 4.4%(+15.2)#498 |
| 13. | 01340 | 18.4% | 6.3%(+12.1)#13 | 4.4%(+14.0)#553 |
| 14. | 01229 | 18.2% | 6.3%(+11.9)#14 | 4.4%(+13.8)#569 |
| 15. | 01267 | 17.5% | 6.3%(+11.2)#15 | 4.4%(+13.1)#602 |
| 16. | 01339 | 17.3% | 6.3%(+11.0)#16 | 4.4%(+12.8)#616 |
| 17. | 01060 | 17.2% | 6.3%(+10.9)#17 | 4.4%(+12.8)#623 |
| 18. | 02642 | 16.9% | 6.3%(+10.6)#18 | 4.4%(+12.5)#639 |
| 19. | 01259 | 16.7% | 6.3%(+10.4)#19 | 4.4%(+12.3)#652 |
| 20. | 01342 | 16.5% | 6.3%(+10.2)#20 | 4.4%(+12.0)#672 |
| 21. | 01255 | 16.4% | 6.3%(+10.2)#21 | 4.4%(+12.0)#674 |
| 22. | 01070 | 15.9% | 6.3%(+9.61)#22 | 4.4%(+11.5)#736 |
| 23. | 01243 | 15.3% | 6.3%(+9.00)#23 | 4.4%(+10.9)#794 |
| 24. | 01026 | 14.9% | 6.3%(+8.61)#24 | 4.4%(+10.5)#826 |
| 25. | 01054 | 14.5% | 6.3%(+8.27)#25 | 4.4%(+10.1)#870 |
| 26. | 01354 | 14.4% | 6.3%(+8.17)#26 | 4.4%(+10.0)#878 |
| 27. | 01351 | 14.4% | 6.3%(+8.15)#27 | 4.4%(+10.0)#881 |
| 28. | 02559 | 14.3% | 6.3%(+8.08)#28 | 4.4%(+9.94)#886 |
| 29. | 02539 | 14.3% | 6.3%(+8.07)#29 | 4.4%(+9.93)#887 |
| 30. | 01128 | 13.6% | 6.3%(+7.35)#30 | 4.4%(+9.22)#966 |
| 31. | 01237 | 13.3% | 6.3%(+7.05)#31 | 4.4%(+8.92)#1,009 |
| 32. | 01035 | 13.3% | 6.3%(+7.00)#32 | 4.4%(+8.87)#1,014 |
| 33. | 02199 | 12.9% | 6.3%(+6.67)#33 | 4.4%(+8.54)#1,061 |
| 34. | 02108 | 12.9% | 6.3%(+6.64)#34 | 4.4%(+8.50)#1,064 |
| 35. | 01375 | 12.9% | 6.3%(+6.61)#35 | 4.4%(+8.47)#1,070 |
| 36. | 02638 | 12.5% | 6.3%(+6.25)#36 | 4.4%(+8.11)#1,136 |
| 37. | 02675 | 12.4% | 6.3%(+6.09)#37 | 4.4%(+7.95)#1,161 |
| 38. | 01072 | 12.3% | 6.3%(+6.02)#38 | 4.4%(+7.89)#1,169 |
| 39. | 01901 | 12.2% | 6.3%(+5.95)#39 | 4.4%(+7.81)#1,188 |
| 40. | 02655 | 12.2% | 6.3%(+5.94)#40 | 4.4%(+7.80)#1,190 |
| 41. | 01330 | 12.1% | 6.3%(+5.85)#41 | 4.4%(+7.71)#1,197 |
| 42. | 01451 | 12.1% | 6.3%(+5.81)#42 | 4.4%(+7.68)#1,205 |
| 43. | 01002 | 12.1% | 6.3%(+5.80)#43 | 4.4%(+7.67)#1,206 |
| 44. | 01562 | 11.9% | 6.3%(+5.67)#44 | 4.4%(+7.53)#1,233 |
| 45. | 01236 | 11.7% | 6.3%(+5.38)#45 | 4.4%(+7.25)#1,299 |
| 46. | 01005 | 11.6% | 6.3%(+5.34)#46 | 4.4%(+7.20)#1,309 |
| 47. | 01098 | 11.4% | 6.3%(+5.14)#47 | 4.4%(+7.00)#1,359 |
| 48. | 01262 | 11.3% | 6.3%(+5.04)#48 | 4.4%(+6.91)#1,386 |
| 49. | 02464 | 11.3% | 6.3%(+5.01)#49 | 4.4%(+6.87)#1,390 |
| 50. | 01840 | 11.1% | 6.3%(+4.81)#50 | 4.4%(+6.67)#1,453 |
| 51. | 01341 | 11.0% | 6.3%(+4.77)#51 | 4.4%(+6.63)#1,462 |
| 52. | 01038 | 11.0% | 6.3%(+4.72)#52 | 4.4%(+6.59)#1,475 |
| 53. | 02667 | 10.9% | 6.3%(+4.67)#53 | 4.4%(+6.54)#1,494 |
| 54. | 02535 | 10.9% | 6.3%(+4.63)#54 | 4.4%(+6.49)#1,500 |
| 55. | 01930 | 10.9% | 6.3%(+4.61)#55 | 4.4%(+6.47)#1,508 |
| 56. | 02657 | 10.8% | 6.3%(+4.52)#56 | 4.4%(+6.39)#1,527 |
| 57. | 01344 | 10.8% | 6.3%(+4.51)#57 | 4.4%(+6.37)#1,531 |
| 58. | 01355 | 10.7% | 6.3%(+4.47)#58 | 4.4%(+6.33)#1,544 |
| 59. | 01349 | 10.7% | 6.3%(+4.47)#59 | 4.4%(+6.33)#1,546 |
| 60. | 01266 | 10.7% | 6.3%(+4.38)#60 | 4.4%(+6.25)#1,572 |
| 61. | 01376 | 10.6% | 6.3%(+4.33)#61 | 4.4%(+6.19)#1,597 |
| 62. | 01096 | 10.4% | 6.3%(+4.11)#62 | 4.4%(+5.98)#1,676 |
| 63. | 01033 | 10.4% | 6.3%(+4.11)#63 | 4.4%(+5.97)#1,682 |
| 64. | 02476 | 10.3% | 6.3%(+4.06)#64 | 4.4%(+5.92)#1,704 |
| 65. | 01062 | 10.3% | 6.3%(+4.00)#65 | 4.4%(+5.86)#1,723 |
| 66. | 02668 | 10.2% | 6.3%(+3.96)#66 | 4.4%(+5.83)#1,732 |
| 67. | 01535 | 10.0% | 6.3%(+3.77)#67 | 4.4%(+5.63)#1,798 |
| 68. | 01718 | 10.0% | 6.3%(+3.75)#68 | 4.4%(+5.62)#1,808 |
| 69. | 02030 | 10.0% | 6.3%(+3.75)#69 | 4.4%(+5.61)#1,811 |
| 70. | 01740 | 10.0% | 6.3%(+3.70)#70 | 4.4%(+5.57)#1,844 |
| 71. | 01985 | 9.9% | 6.3%(+3.64)#71 | 4.4%(+5.51)#1,865 |
| 72. | 02659 | 9.8% | 6.3%(+3.56)#72 | 4.4%(+5.43)#1,900 |
| 73. | 01093 | 9.8% | 6.3%(+3.53)#73 | 4.4%(+5.39)#1,913 |
| 74. | 01104 | 9.8% | 6.3%(+3.52)#74 | 4.4%(+5.39)#1,916 |
| 75. | 02343 | 9.8% | 6.3%(+3.51)#75 | 4.4%(+5.37)#1,923 |
| 76. | 02138 | 9.7% | 6.3%(+3.47)#76 | 4.4%(+5.33)#1,938 |
| 77. | 02130 | 9.7% | 6.3%(+3.44)#77 | 4.4%(+5.30)#1,953 |
| 78. | 02562 | 9.7% | 6.3%(+3.40)#78 | 4.4%(+5.27)#1,961 |
| 79. | 01257 | 9.7% | 6.3%(+3.38)#79 | 4.4%(+5.24)#1,973 |
| 80. | 01754 | 9.7% | 6.3%(+3.38)#80 | 4.4%(+5.24)#1,975 |
| 81. | 01468 | 9.6% | 6.3%(+3.38)#81 | 4.4%(+5.24)#1,978 |
| 82. | 02575 | 9.6% | 6.3%(+3.36)#82 | 4.4%(+5.22)#1,984 |
| 83. | 01378 | 9.5% | 6.3%(+3.27)#83 | 4.4%(+5.13)#2,019 |
| 84. | 01773 | 9.5% | 6.3%(+3.25)#84 | 4.4%(+5.11)#2,036 |
| 85. | 01037 | 9.5% | 6.3%(+3.23)#85 | 4.4%(+5.09)#2,044 |
| 86. | 01770 | 9.5% | 6.3%(+3.20)#86 | 4.4%(+5.06)#2,057 |
| 87. | 02481 | 9.5% | 6.3%(+3.18)#87 | 4.4%(+5.04)#2,066 |
| 88. | 01907 | 9.4% | 6.3%(+3.16)#88 | 4.4%(+5.02)#2,073 |
| 89. | 01235 | 9.4% | 6.3%(+3.15)#89 | 4.4%(+5.01)#2,076 |
| 90. | 02465 | 9.4% | 6.3%(+3.13)#90 | 4.4%(+4.99)#2,089 |
| 91. | 02724 | 9.4% | 6.3%(+3.13)#91 | 4.4%(+4.99)#2,090 |
| 92. | 01240 | 9.3% | 6.3%(+3.03)#92 | 4.4%(+4.89)#2,149 |
| 93. | 02482 | 9.3% | 6.3%(+3.01)#93 | 4.4%(+4.87)#2,159 |
| 94. | 02043 | 9.3% | 6.3%(+2.99)#94 | 4.4%(+4.86)#2,169 |
| 95. | 02472 | 9.2% | 6.3%(+2.97)#95 | 4.4%(+4.84)#2,181 |
| 96. | 01984 | 9.2% | 6.3%(+2.94)#96 | 4.4%(+4.80)#2,201 |
| 97. | 01440 | 9.1% | 6.3%(+2.86)#97 | 4.4%(+4.72)#2,244 |
| 98. | 02132 | 9.1% | 6.3%(+2.84)#98 | 4.4%(+4.70)#2,254 |
| 99. | 01075 | 9.1% | 6.3%(+2.83)#99 | 4.4%(+4.70)#2,257 |
| 100. | 02466 | 9.1% | 6.3%(+2.82)#100 | 4.4%(+4.69)#2,262 |
Common Questions
What are the Top 10 Zip Codes with the Highest Percentage of Population with a Degree in Literature and Languages in Massachusetts?
Top 10 Zip Codes with the Highest Percentage of Population with a Degree in Literature and Languages in Massachusetts are:
What zip code has the Highest Percentage of Population with a Degree in Literature and Languages in Massachusetts?
02457 has the Highest Percentage of Population with a Degree in Literature and Languages in Massachusetts with 100.0%.
What is the Percentage of Population with a Degree in Literature and Languages in the State of Massachusetts?
Percentage of Population with a Degree in Literature and Languages in Massachusetts is 6.3%.
What is the Percentage of Population with a Degree in Literature and Languages in the United States?
Percentage of Population with a Degree in Literature and Languages in the United States is 4.4%.