Zip Codes with the Highest Percentage of Population Employed in Farming, Fishing & Forestry in Quincy, IL
RELATED REPORTS & OPTIONS
Farming, Fishing & Forestry
Quincy
Compare Zip Codes
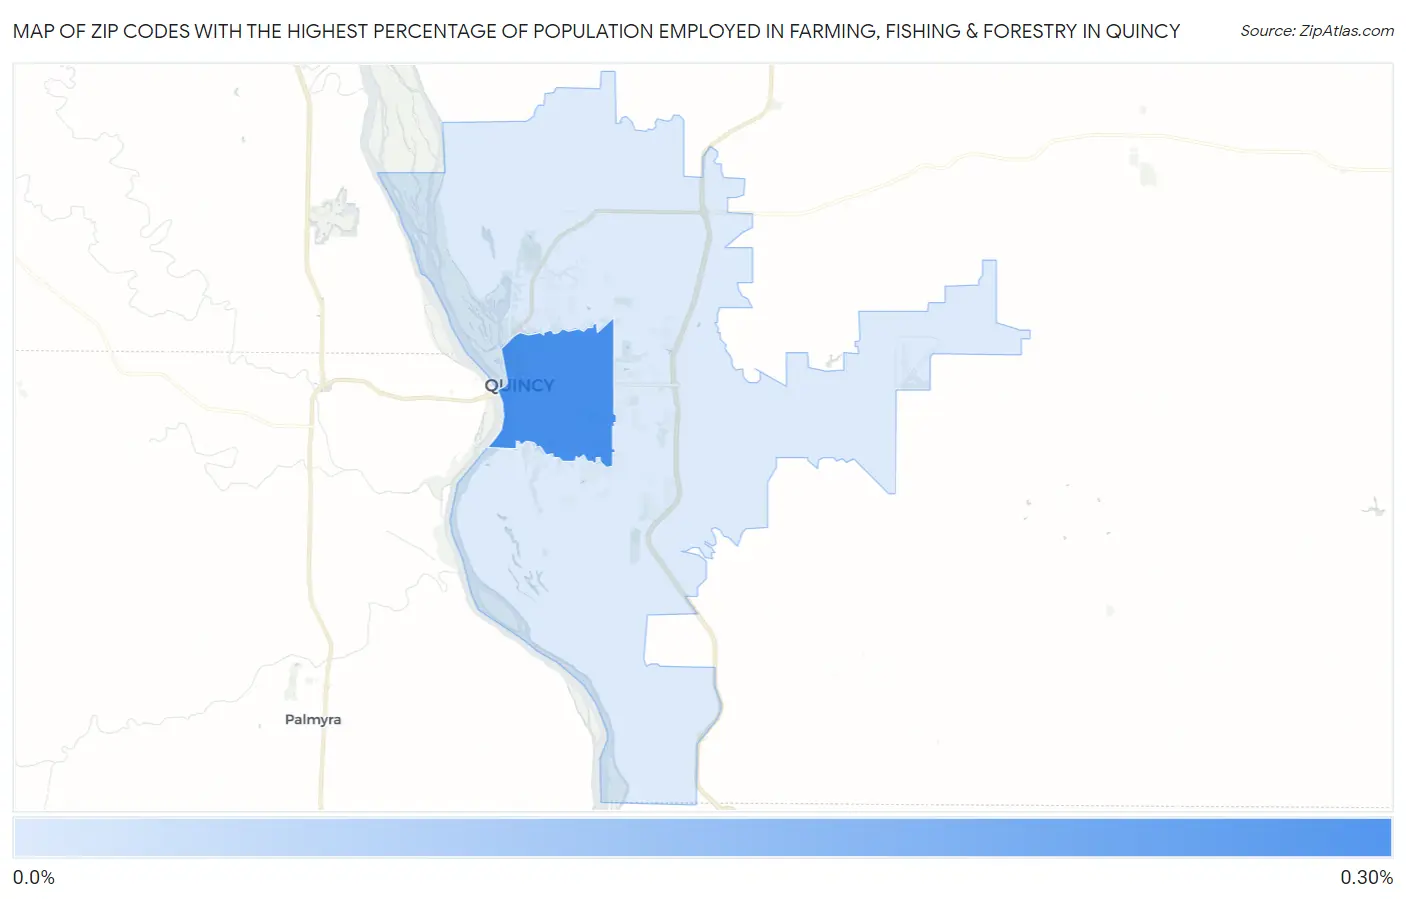
Map of Zip Codes with the Highest Percentage of Population Employed in Farming, Fishing & Forestry in Quincy
0.097%
0.26%
Zip Codes with the Highest Percentage of Population Employed in Farming, Fishing & Forestry in Quincy, IL
| Zip Code | % Employed | vs State | vs National | |
| 1. | 62301 | 0.26% | 0.31%(-0.054)#674 | 0.61%(-0.349)#15,318 |
| 2. | 62305 | 0.097% | 0.31%(-0.214)#778 | 0.61%(-0.509)#17,826 |
1
Common Questions
What are the Top Zip Codes with the Highest Percentage of Population Employed in Farming, Fishing & Forestry in Quincy, IL?
Top Zip Codes with the Highest Percentage of Population Employed in Farming, Fishing & Forestry in Quincy, IL are:
What zip code has the Highest Percentage of Population Employed in Farming, Fishing & Forestry in Quincy, IL?
62301 has the Highest Percentage of Population Employed in Farming, Fishing & Forestry in Quincy, IL with 0.26%.
What is the Percentage of Population Employed in Farming, Fishing & Forestry in Quincy, IL?
Percentage of Population Employed in Farming, Fishing & Forestry in Quincy is 0.20%.
What is the Percentage of Population Employed in Farming, Fishing & Forestry in Illinois?
Percentage of Population Employed in Farming, Fishing & Forestry in Illinois is 0.31%.
What is the Percentage of Population Employed in Farming, Fishing & Forestry in the United States?
Percentage of Population Employed in Farming, Fishing & Forestry in the United States is 0.61%.