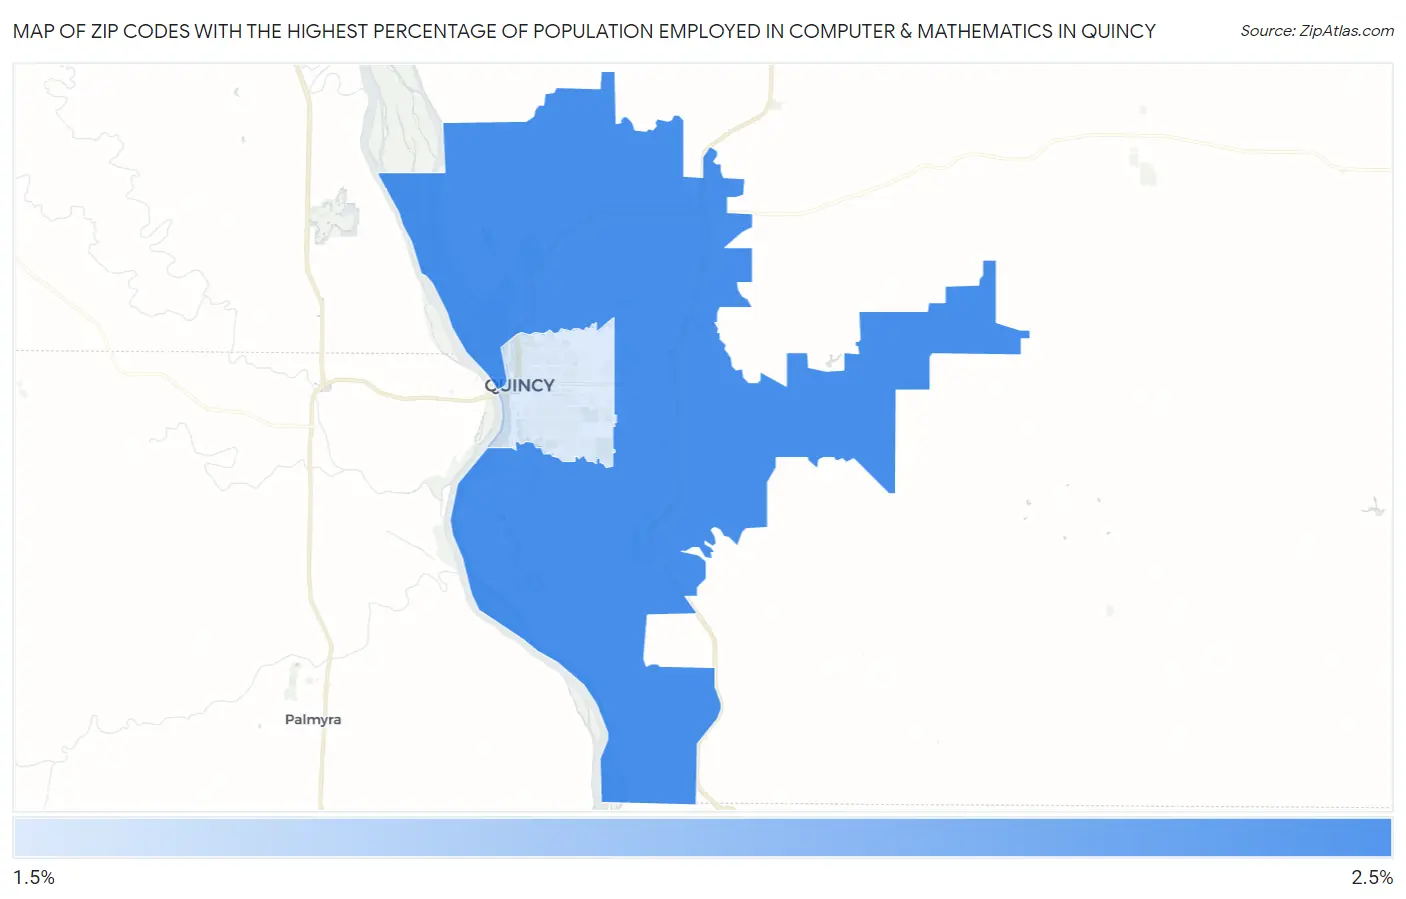
Zip Codes with the Highest Percentage of Population Employed in Computer & Mathematics in Quincy, IL
RELATED REPORTS & OPTIONS
Computer & Mathematics
Quincy
Compare Zip Codes
Map of Zip Codes with the Highest Percentage of Population Employed in Computer & Mathematics in Quincy
1.6%
2.4%
Zip Codes with the Highest Percentage of Population Employed in Computer & Mathematics in Quincy, IL
| Zip Code | % Employed | vs State | vs National | |
| 1. | 62305 | 2.4% | 3.6%(-1.20)#414 | 3.5%(-1.16)#10,178 |
| 2. | 62301 | 1.6% | 3.6%(-2.00)#573 | 3.5%(-1.96)#14,021 |
1
Common Questions
What are the Top Zip Codes with the Highest Percentage of Population Employed in Computer & Mathematics in Quincy, IL?
Top Zip Codes with the Highest Percentage of Population Employed in Computer & Mathematics in Quincy, IL are:
What zip code has the Highest Percentage of Population Employed in Computer & Mathematics in Quincy, IL?
62305 has the Highest Percentage of Population Employed in Computer & Mathematics in Quincy, IL with 2.4%.
What is the Percentage of Population Employed in Computer & Mathematics in Quincy, IL?
Percentage of Population Employed in Computer & Mathematics in Quincy is 2.2%.
What is the Percentage of Population Employed in Computer & Mathematics in Illinois?
Percentage of Population Employed in Computer & Mathematics in Illinois is 3.6%.
What is the Percentage of Population Employed in Computer & Mathematics in the United States?
Percentage of Population Employed in Computer & Mathematics in the United States is 3.5%.