Zip Codes with the Highest Percentage of Population Employed in Community & Social Service in Quincy, IL
RELATED REPORTS & OPTIONS
Community & Social Service
Quincy
Compare Zip Codes
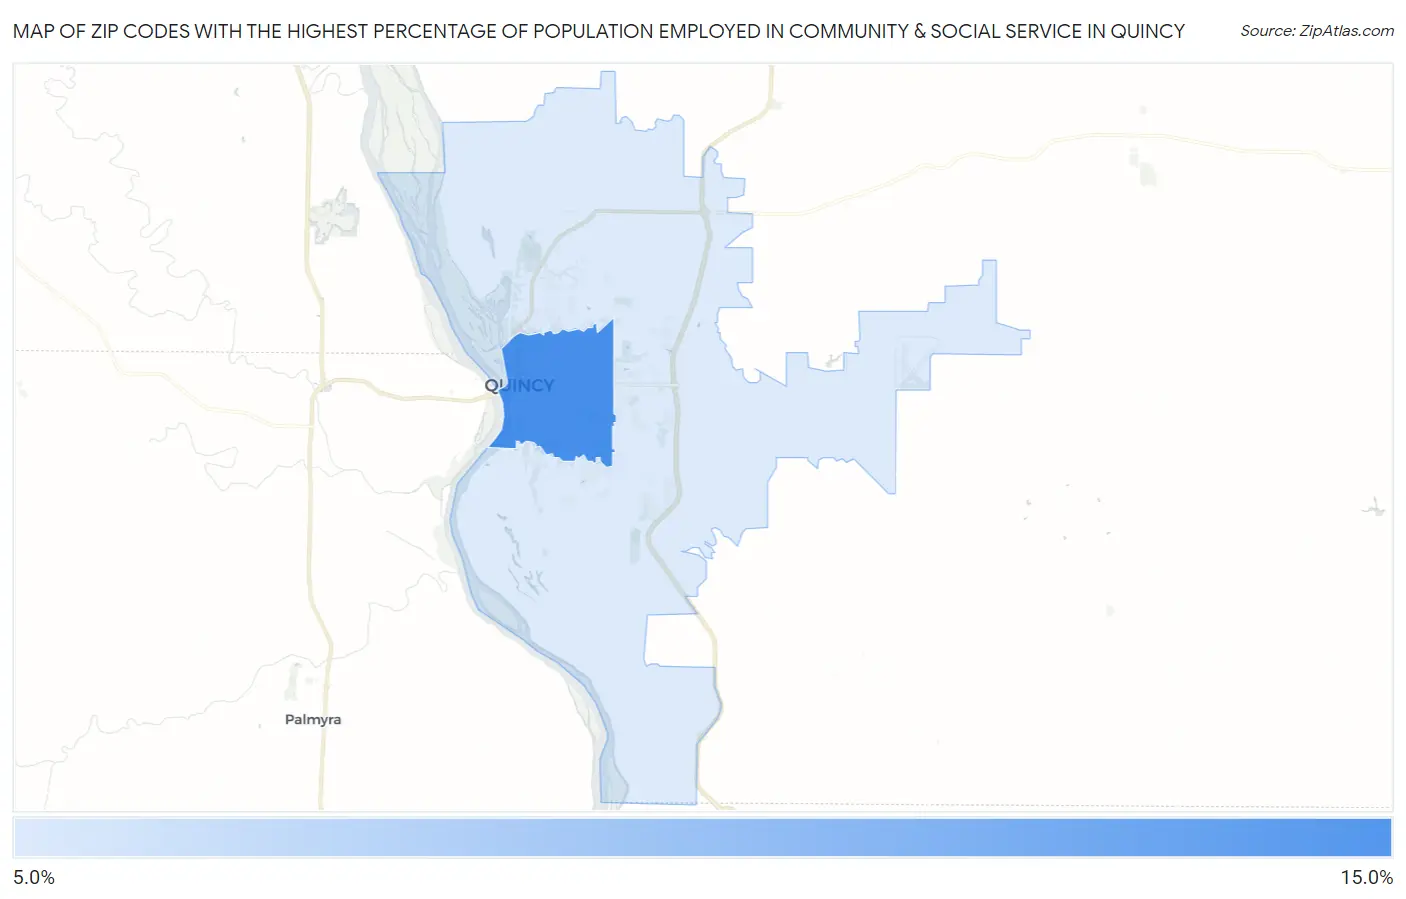
Map of Zip Codes with the Highest Percentage of Population Employed in Community & Social Service in Quincy
8.4%
11.5%
Zip Codes with the Highest Percentage of Population Employed in Community & Social Service in Quincy, IL
| Zip Code | % Employed | vs State | vs National | |
| 1. | 62301 | 11.5% | 11.3%(+0.175)#354 | 11.2%(+0.240)#10,557 |
| 2. | 62305 | 8.4% | 11.3%(-2.84)#701 | 11.2%(-2.78)#18,347 |
1
Common Questions
What are the Top Zip Codes with the Highest Percentage of Population Employed in Community & Social Service in Quincy, IL?
Top Zip Codes with the Highest Percentage of Population Employed in Community & Social Service in Quincy, IL are:
What zip code has the Highest Percentage of Population Employed in Community & Social Service in Quincy, IL?
62301 has the Highest Percentage of Population Employed in Community & Social Service in Quincy, IL with 11.5%.
What is the Percentage of Population Employed in Community & Social Service in Quincy, IL?
Percentage of Population Employed in Community & Social Service in Quincy is 10.1%.
What is the Percentage of Population Employed in Community & Social Service in Illinois?
Percentage of Population Employed in Community & Social Service in Illinois is 11.3%.
What is the Percentage of Population Employed in Community & Social Service in the United States?
Percentage of Population Employed in Community & Social Service in the United States is 11.2%.