Zip Codes with the Highest Percentage of Population Employed in Food Preparation & Serving in Covington, GA
RELATED REPORTS & OPTIONS
Food Preparation & Serving
Covington
Compare Zip Codes
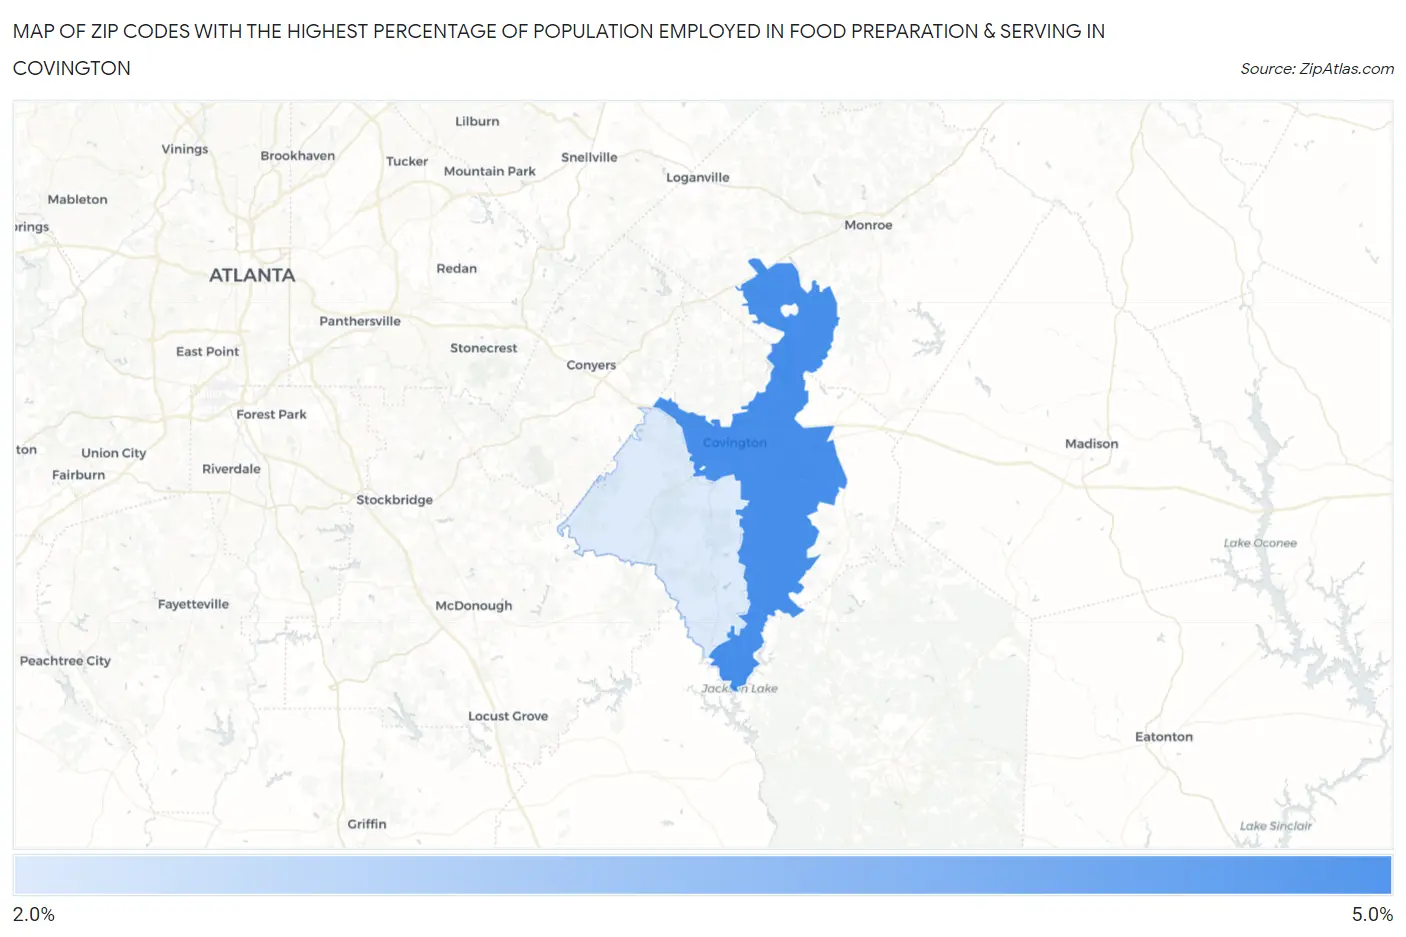
Map of Zip Codes with the Highest Percentage of Population Employed in Food Preparation & Serving in Covington
2.6%
4.9%
Zip Codes with the Highest Percentage of Population Employed in Food Preparation & Serving in Covington, GA
| Zip Code | % Employed | vs State | vs National | |
| 1. | 30014 | 4.9% | 5.1%(-0.267)#310 | 5.3%(-0.408)#13,461 |
| 2. | 30016 | 2.6% | 5.1%(-2.59)#543 | 5.3%(-2.73)#22,965 |
1
Common Questions
What are the Top Zip Codes with the Highest Percentage of Population Employed in Food Preparation & Serving in Covington, GA?
Top Zip Codes with the Highest Percentage of Population Employed in Food Preparation & Serving in Covington, GA are:
What zip code has the Highest Percentage of Population Employed in Food Preparation & Serving in Covington, GA?
30014 has the Highest Percentage of Population Employed in Food Preparation & Serving in Covington, GA with 4.9%.
What is the Percentage of Population Employed in Food Preparation & Serving in Covington, GA?
Percentage of Population Employed in Food Preparation & Serving in Covington is 5.7%.
What is the Percentage of Population Employed in Food Preparation & Serving in Georgia?
Percentage of Population Employed in Food Preparation & Serving in Georgia is 5.1%.
What is the Percentage of Population Employed in Food Preparation & Serving in the United States?
Percentage of Population Employed in Food Preparation & Serving in the United States is 5.3%.