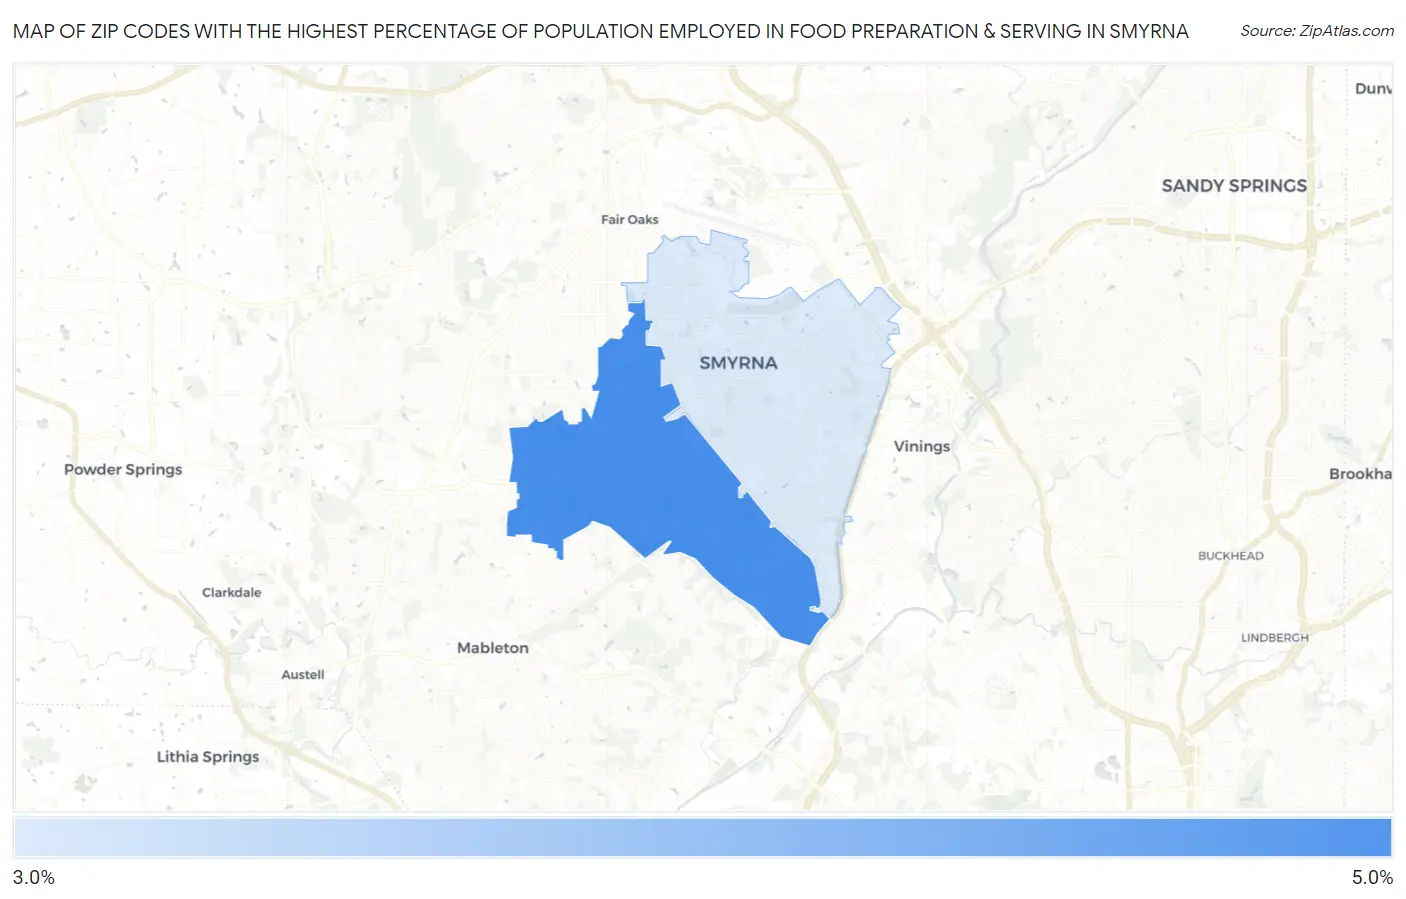
Zip Codes with the Highest Percentage of Population Employed in Food Preparation & Serving in Smyrna, GA
RELATED REPORTS & OPTIONS
Food Preparation & Serving
Smyrna
Compare Zip Codes
Map of Zip Codes with the Highest Percentage of Population Employed in Food Preparation & Serving in Smyrna
4.0%
4.5%
Zip Codes with the Highest Percentage of Population Employed in Food Preparation & Serving in Smyrna, GA
| Zip Code | % Employed | vs State | vs National | |
| 1. | 30082 | 4.5% | 5.1%(-0.596)#346 | 5.3%(-0.737)#14,826 |
| 2. | 30080 | 4.0% | 5.1%(-1.19)#402 | 5.3%(-1.33)#17,301 |
1
Common Questions
What are the Top Zip Codes with the Highest Percentage of Population Employed in Food Preparation & Serving in Smyrna, GA?
Top Zip Codes with the Highest Percentage of Population Employed in Food Preparation & Serving in Smyrna, GA are:
What zip code has the Highest Percentage of Population Employed in Food Preparation & Serving in Smyrna, GA?
30082 has the Highest Percentage of Population Employed in Food Preparation & Serving in Smyrna, GA with 4.5%.
What is the Percentage of Population Employed in Food Preparation & Serving in Smyrna, GA?
Percentage of Population Employed in Food Preparation & Serving in Smyrna is 4.0%.
What is the Percentage of Population Employed in Food Preparation & Serving in Georgia?
Percentage of Population Employed in Food Preparation & Serving in Georgia is 5.1%.
What is the Percentage of Population Employed in Food Preparation & Serving in the United States?
Percentage of Population Employed in Food Preparation & Serving in the United States is 5.3%.